Downloaded 688 times

This document discusses different types of graphs and tables used to represent data. It introduces bar graphs, line graphs, circle graphs, and pictographs for visualizing data, as well as frequency tables and line plots for organizing raw numbers. Bar graphs compare data using bar lengths. Line graphs show changes over time by connecting points. Circle graphs represent parts of data as percentages of a whole circle. Pictographs use pictures to compare amounts of data, similar to bar graphs. Frequency tables list how often each item occurs, while line plots show frequencies using X marks.
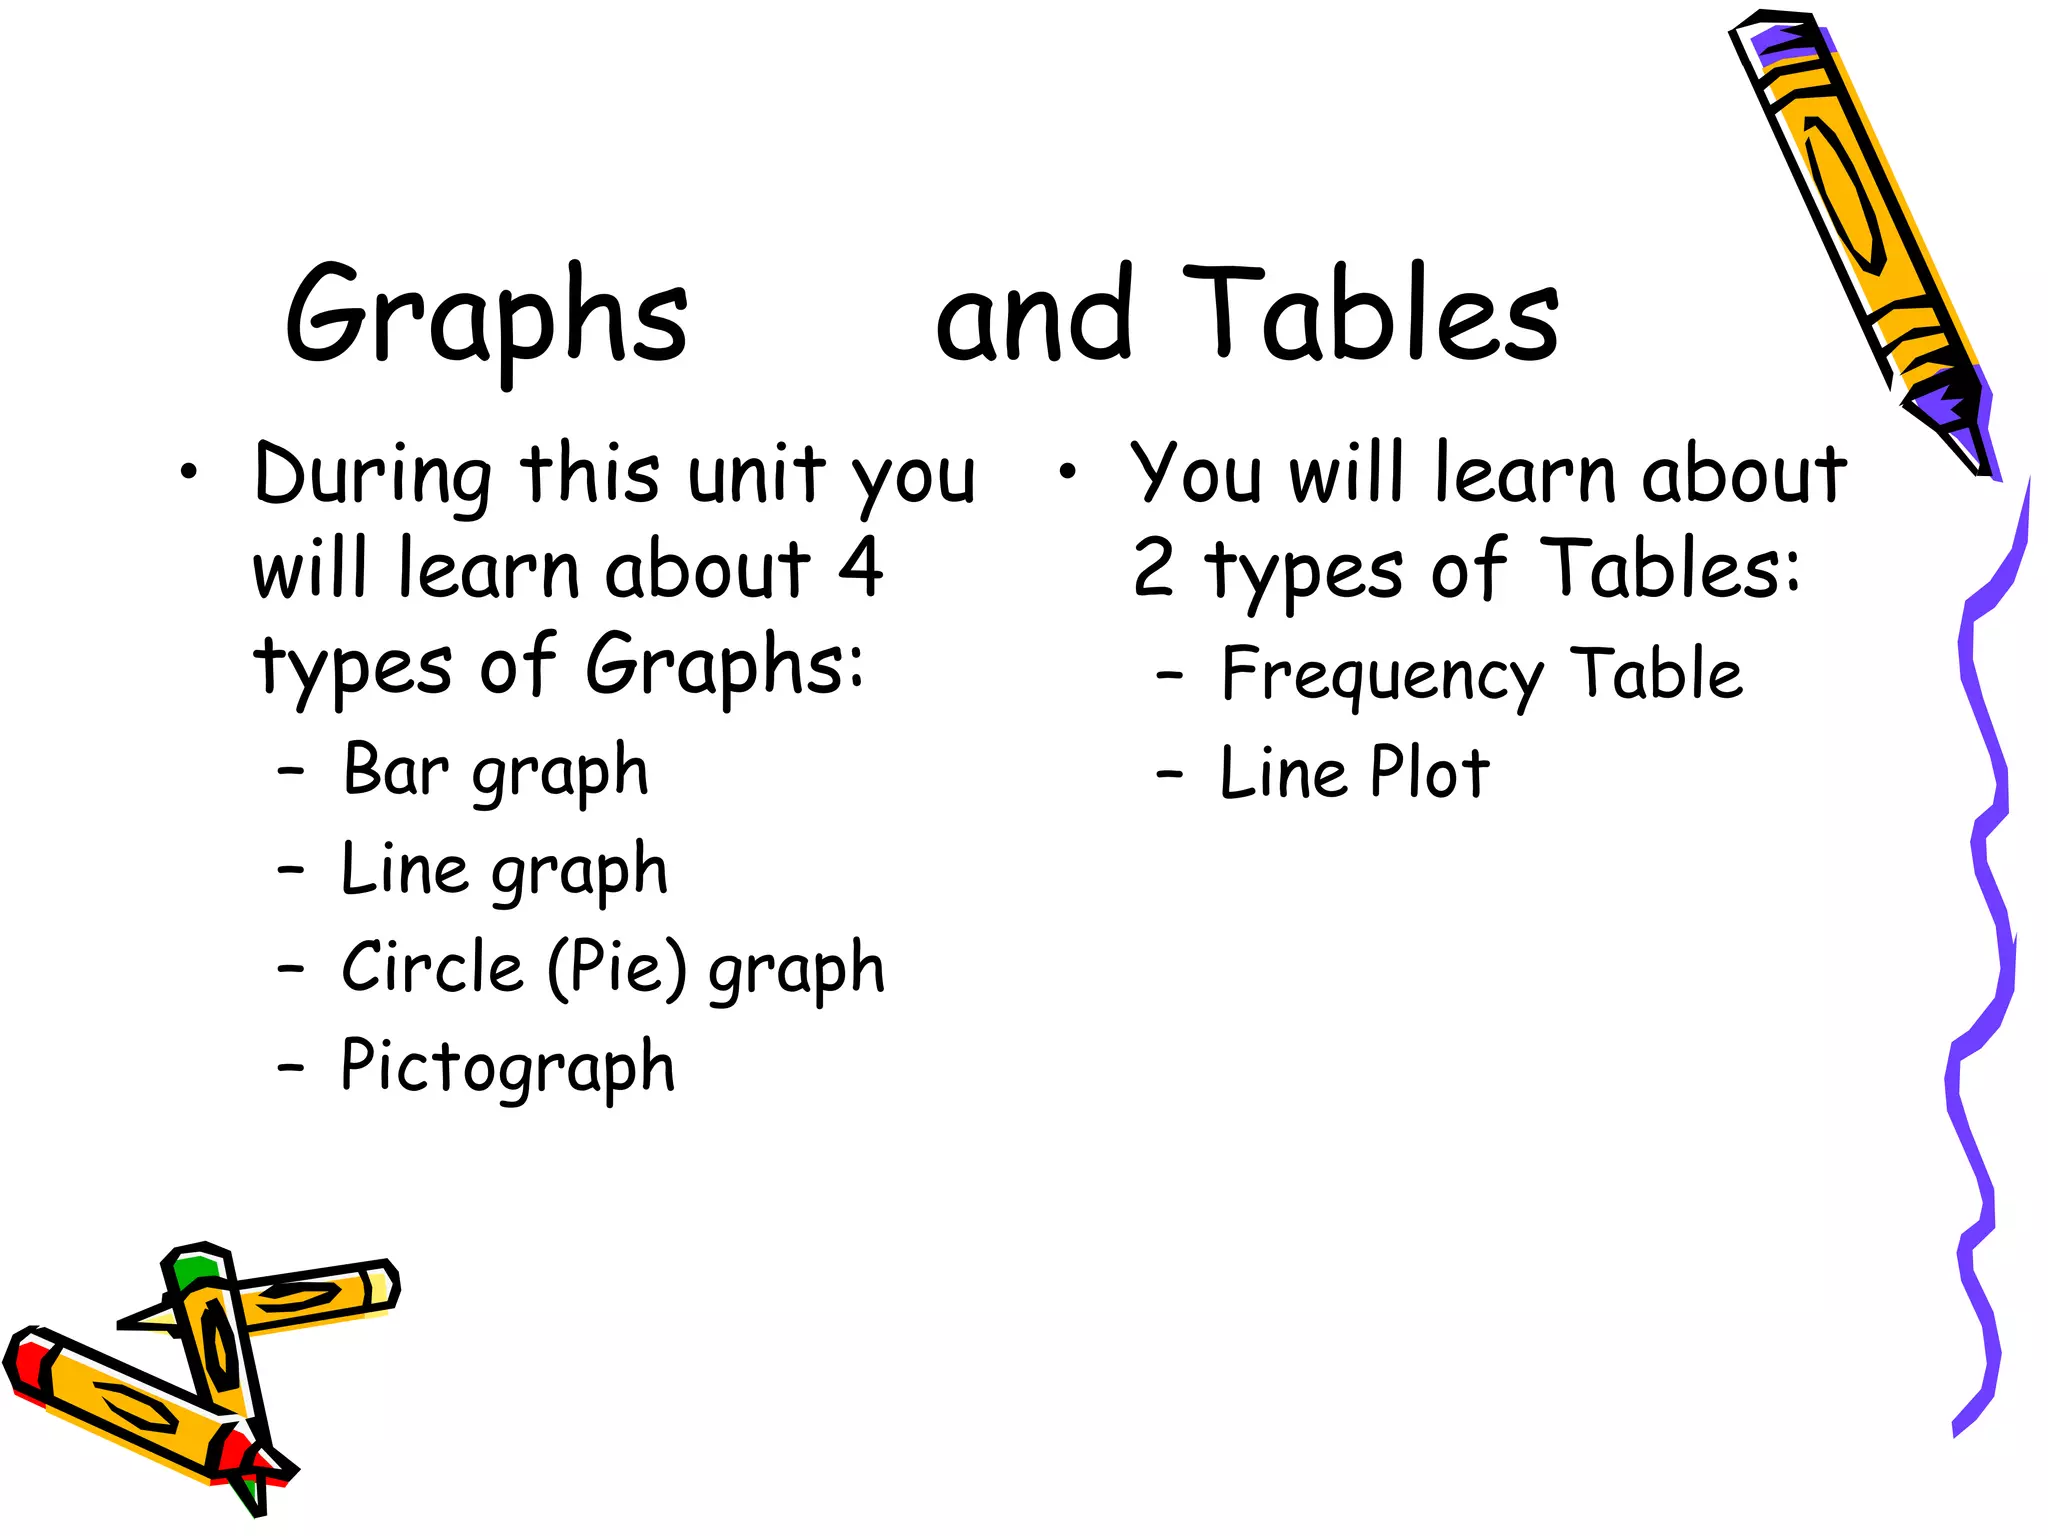
This slide introduces four types of graphs (Bar, Line, Circle, Pictograph) and two types of tables (Frequency Table, Line Plot).
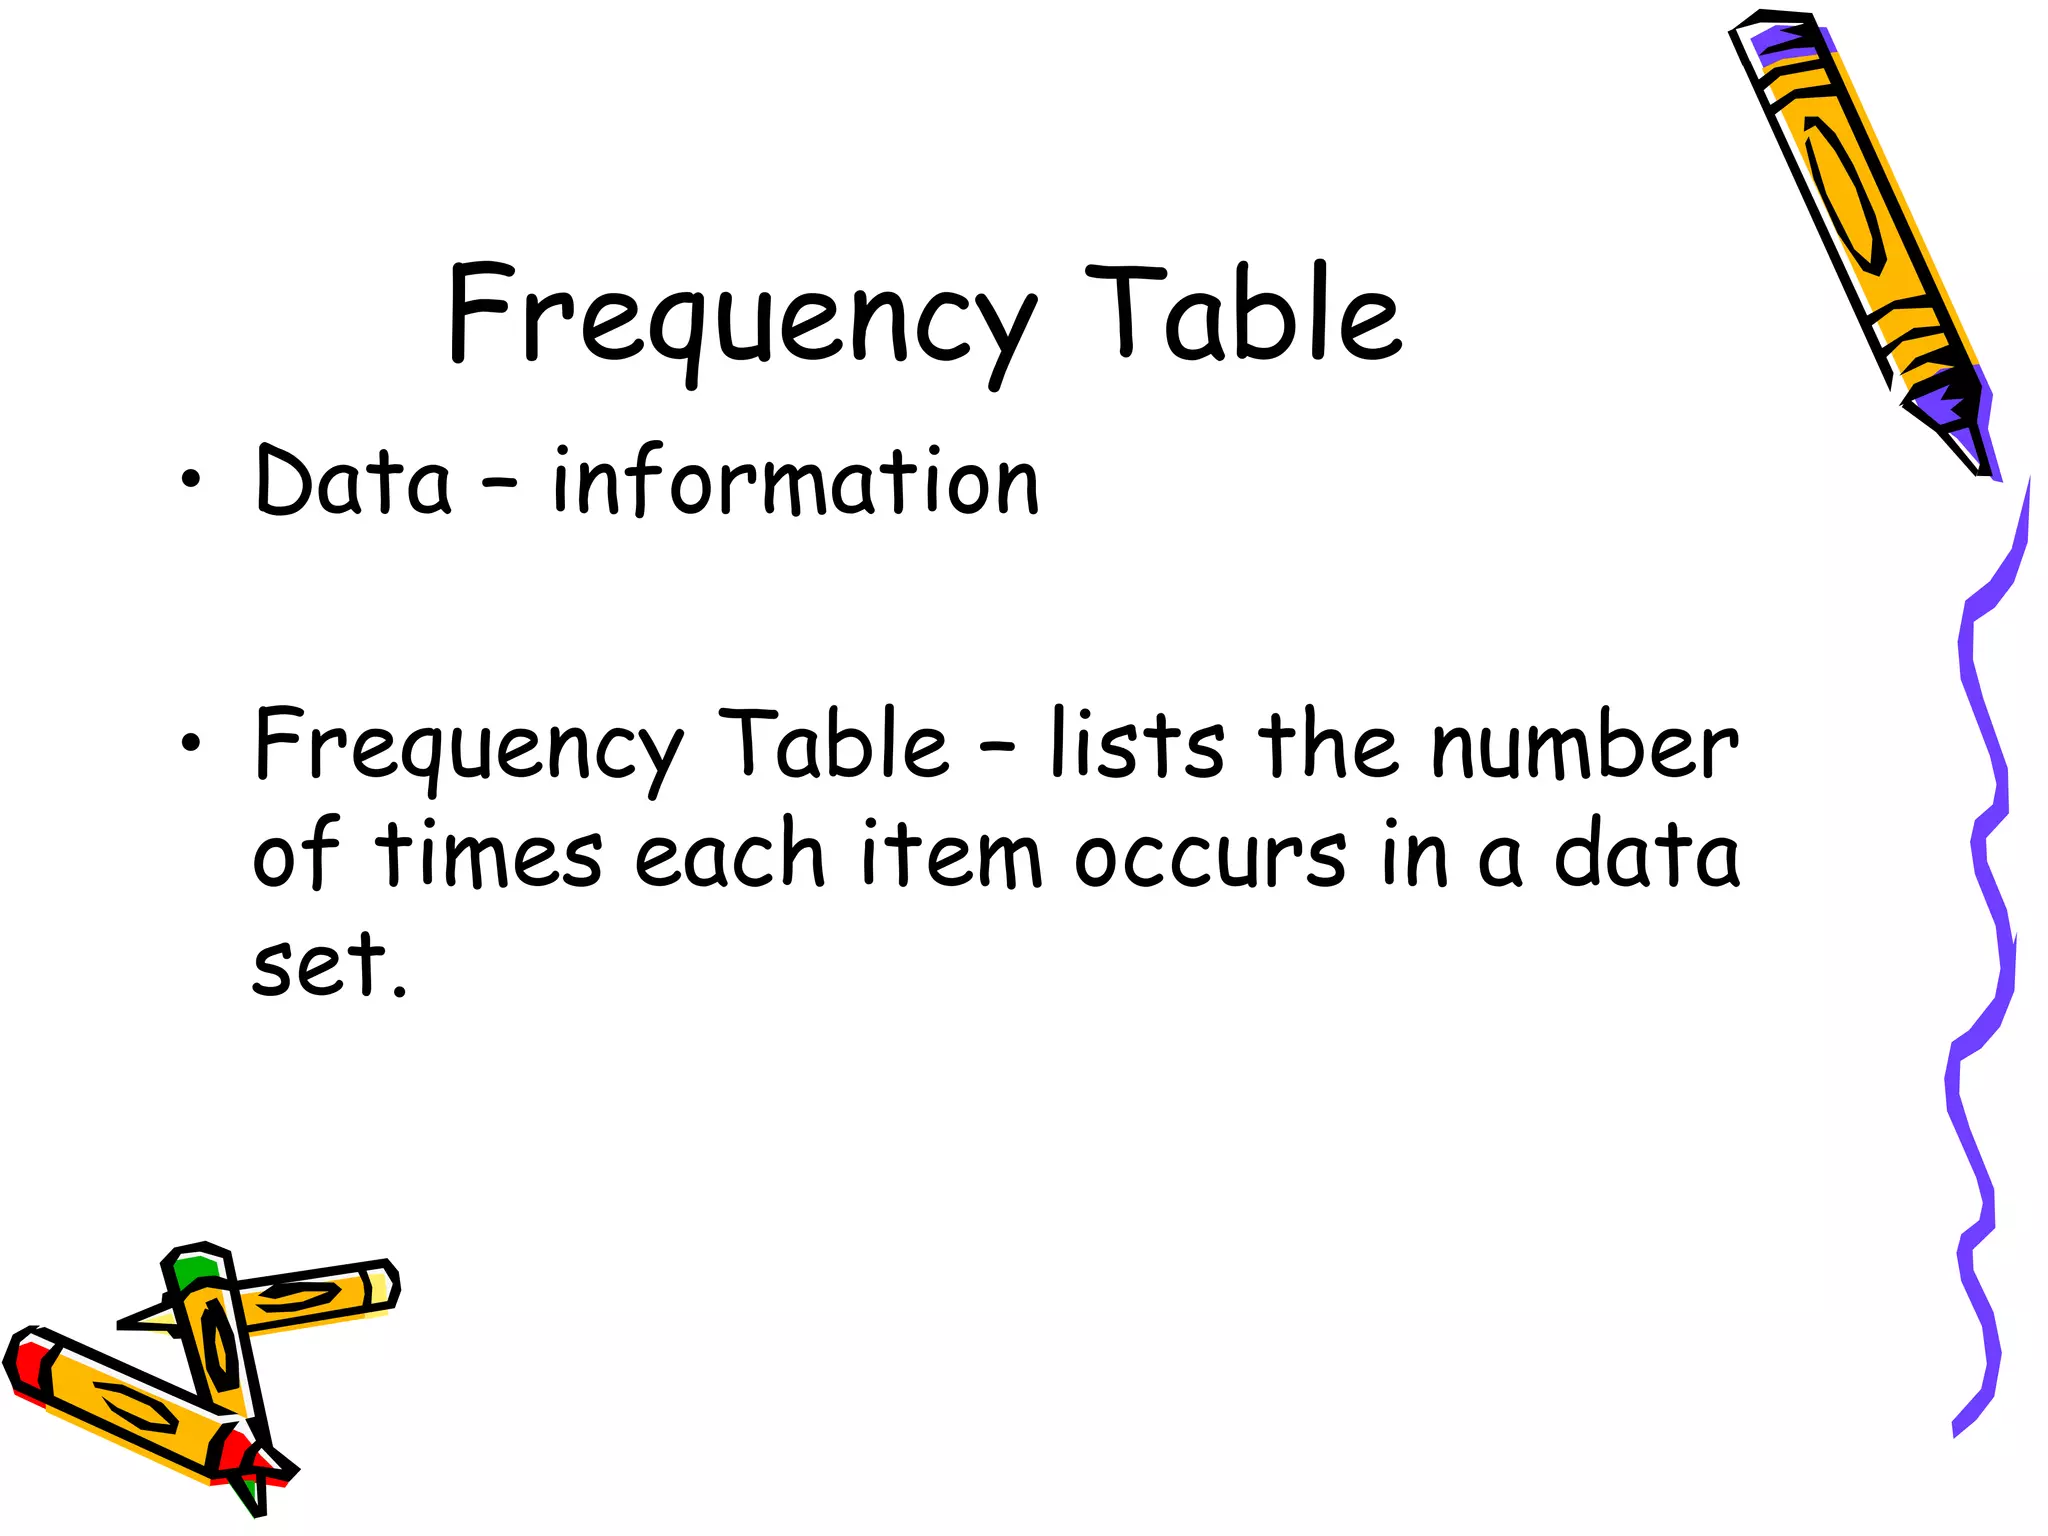
Describes what Frequency Tables are, emphasizing that they list occurrences of items in a data set.
Line Plots represent data using X marks to show frequencies of occurrences.
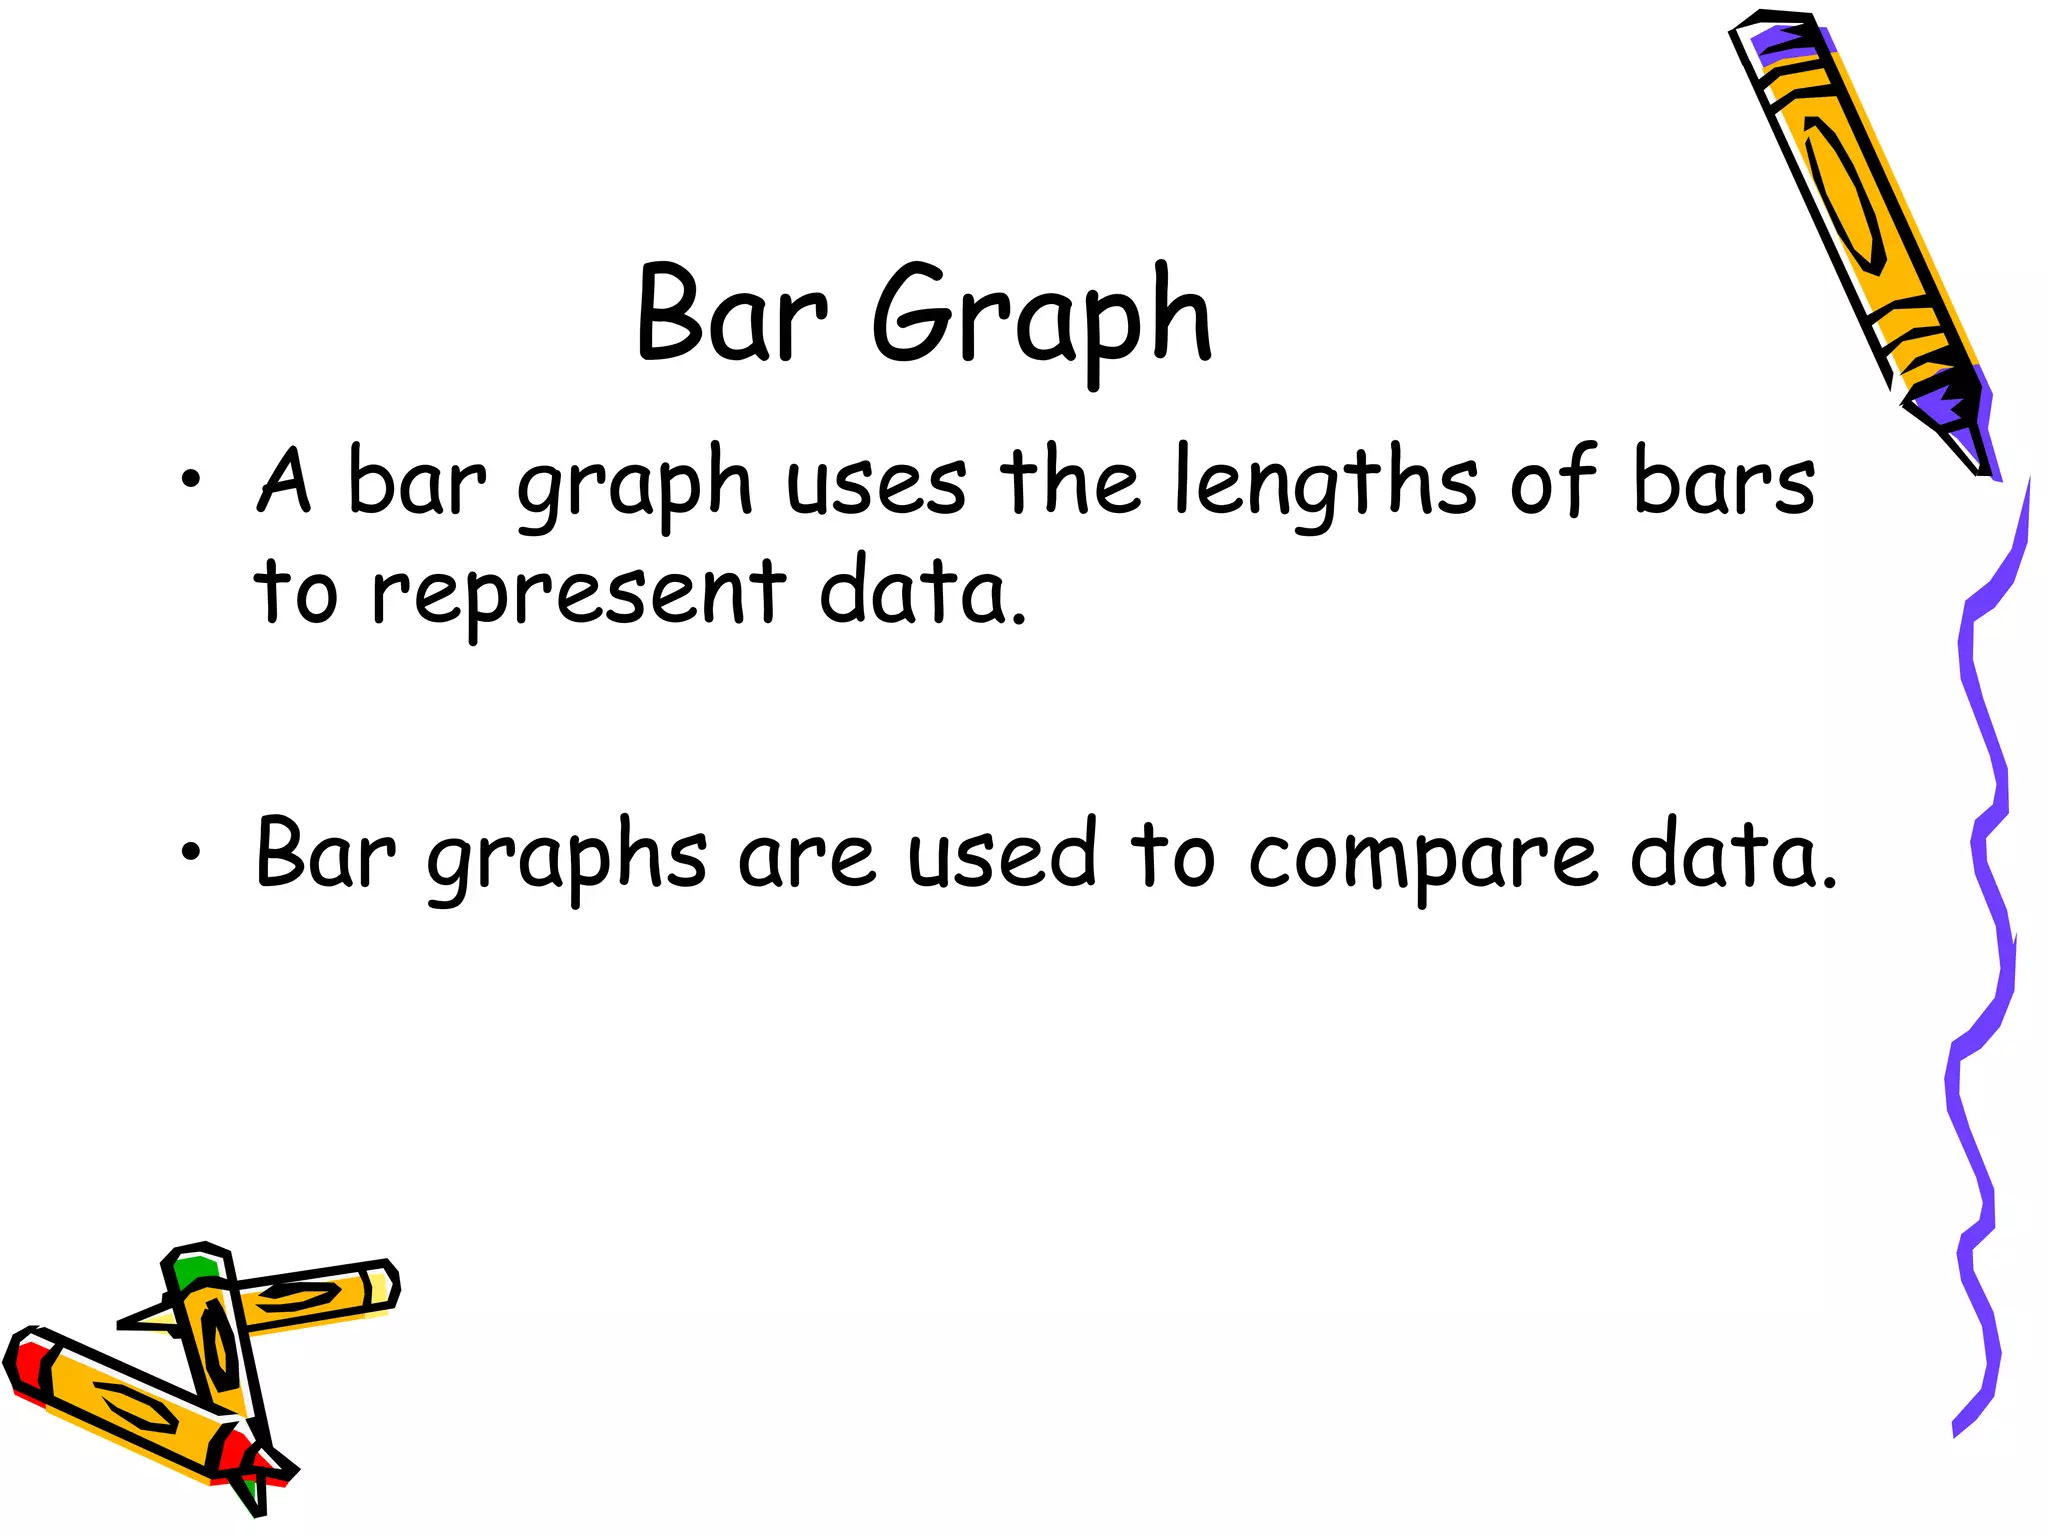
A Bar Graph uses bar lengths to compare data, illustrating differences clearly.
Line Graphs connect points with lines to illustrate data changes over time.
Circle (Pie) Graphs depict data as parts of a whole, useful for comparing proportions.
Pictographs use pictures to depict data, functioning similarly to bar graphs for comparison.


