
Recommended
Recommended
More Related Content
What's hot
What's hot (10)
Similar to Tui Dissertation Defense Abbrv Hales (Linkedin)
Similar to Tui Dissertation Defense Abbrv Hales (Linkedin) (20)
Recently uploaded
Recently uploaded (20)
Tui Dissertation Defense Abbrv Hales (Linkedin)
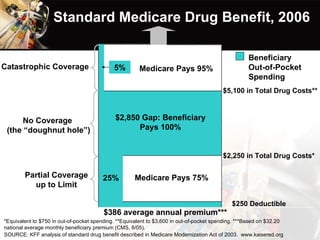
- 1. Standard Medicare Drug Benefit, 2006 $386 average annual premium*** $250 Deductible $2,250 in Total Drug Costs* $5,100 in Total Drug Costs** 25% 5% $2,850 Gap: Beneficiary Pays 100% Medicare Pays 75% Medicare Pays 95% No Coverage (the “doughnut hole”) Catastrophic Coverage Partial Coverage up to Limit Beneficiary Out-of-Pocket Spending *Equivalent to $750 in out-of-pocket spending. **Equivalent to $3,600 in out-of-pocket spending. ***Based on $32.20 national average monthly beneficiary premium (CMS, 8/05). SOURCE: KFF analysis of standard drug benefit described in Medicare Modernization Act of 2003. www.kaisered.org
- 2. The “Doughnut Hole” National Committee to Preserve Social Security and Medicare. http://www.ncpssm.org/news/archive/update_partd_2008/
- 6. Days Spent in the “doughnut hole” Legend: Distribution of Days Spent by Members in the Doughnut Hole The graph displays the distribution of days spent in the doughnut hole by the 500 members of the standard Part D prescription drug plan (standard PDP). The mean was 144.68 days +/- 2.268 SEM.
- 7. Rx Fulfillment Behaviors Legend: Fulfillment Behaviors for Members Who Experienced the Doughnut Hole This table shows the prescription fulfillment behaviors of standard PDP members. Data are expressed in terms of the frequency, percent, and cumulative percent. Total number of participants n = 500. Legend: Fulfillment Behaviors for Members without a Doughnut Hole This table shows the prescription fulfillment behaviors of enhanced members. Data are expressed in terms of the frequency, percent, and cumulative percent. Total number of participants n = 250. Fulfillment Behaviors for Members Who Experienced the Doughnut Hole Fulfillment Behaviors for Members without a Doughnut Hole 100.0 500 Total 5.6 28 Switched, Stopped, and Delayed 10.0 50 Delayed and Stopped 5.2 26 Switched and Stopped 9.8 49 Switched and Delayed 6.0 30 Stopped 22.0 110 Delayed 13.4 67 Switched 28.0 140 Filled Percent Frequency Doughnut Hole = Y 100.0 250 Total 1.2 3 Switched, Stopped, and Delayed 8.4 21 Delayed and Stopped 4.0 10 Switched and Stopped 3.2 8 Switched and Delayed 8.4 21 Stopped 10.8 27 Delayed 10.0 25 Switched 54.0 135 Filled Percent Frequency Doughnut Hole = N
- 8. Rx Fulfillment Behaviors – Frequency graphs Legend: Rx Fulfillment Behavior of Standard PDP Members This figure shows the prescription fulfillment behavior of standard PDP members when experiencing the doughnut hole. Data are expressed as the mean of the number of participants who 1 = filled, 2 = switched, 3 =delayed, 4 = stopped, 5 = both switched and delayed, 6 = switched and stopped, 7 = delayed and stopped, or 8 = switched, stopped and delayed their prescription medication. Total number of participants n = 500. Legend: Rx Fulfillment Behavior when NOT Experiencing the Doughnut Hole This figure shows the prescription fulfillment behavior of enhanced members, who do NOT experience the doughnut hole. Data are expressed as the mean of the number of participants who 1 = filled, 2 = switched, 3 =delayed, 4 = stopped, 5 = both switched and delayed, 6 = switched and stopped, 7 = delayed and stopped, or 8 = switched, stopped and delayed their prescription medication. Total number of participants n = 250. Frequency Frequency
- 9. Percentage of Classes Affected Legend: Percentage of Classes Affected by Prescription Fulfillment Decisions of Standard PDP Members This pie chart shows the percentages for the classes which were impacted by prescription fulfillment behaviors of standard PDP members. Data are percent. Total number of participants n = 500.
- 10. Odd Ratios Legend: Descriptive Cross Tabulation for Prescription Fulfillment Behaviors and the presence of a doughnut hole with Odds Ratios The above table compares the prescription fulfillment behaviors identified for members experiencing and Not experiencing the doughnut hole . Prescription fulfillment frequencies are displayed for each type of prescription fulfillment behavior possible from a member; these are separated by group (those who experienced the doughnut hole compared with those who did NOT experience the hole. Odd ratios are displayed for each classification of finalized cumulative prescription decisions made by members (p<0.05). 750 750 250 500 Total 4.667 31 3 28 Switched, Stopped, and Delayed 1.190 71 21 50 Delayed and Stopped 1.300 36 10 26 Switched and Stopped 3.063 57 8 49 Switched and Delayed 0.714 51 21 30 Stopped 2.037 137 27 110 Delayed 1.340 92 25 67 Switched 0.519 275 135 140 Filled Rx Fulfillment Behavior No hole exp – had full coverage at all times Yes – Experienced the hole – no coverage Odds Ratio Total Doughnut Hole Y or N Rx Fulfillment Behavior Cross Tabulation with Odds Ratios
- 11. Covariate Analysis Legend: Multinomial Regression. This table displays the findings of a multinomial regression model. A stepwise method was used to introduce age, gender, type of class of medications, the number of medications, and days spent in the doughnut hole were reported. Reference category is filled. The odds ratios for each variable are displayed. (p<0.05) - P=.000 Significance of Days Spent in the Hole 1.500 2 6 32 different Medications 1.750 8 28 20 Different Medications 5.667 3 34 16 Different Medications 2.800 5 28 9 Different Medications 1.833 3 11 7 Different Medications Odd Ratios greater than 1.5 times p=.000 Significance of Number of Medications .833 6 10 Other (Skin, Stroke, Dental) (9) .944 36 68 Cancer (8) 1.009 58 117 Gastrointestinal (7) 1.059 51 108 Endocrine & Metabolic (6) 1.196 46 110 Central Nervous System (5) .688 32 44 Cardiovascular (4) 1.308 13 34 Anti-infective (3) .313 8 5 Analgesic (2) - 0 4 Asthma/Allergy (1) p=.712 Significance of Classes of Medication 1.014 141 286 Female .982 109 214 Male p=.848 Significance of Gender .538 13 14 Age 77 .767 15 23 Age 74 p=.355 Significance of Age Odds Ratio No – No hole exp – had full coverage at all times Yes – Experienced the hole, no coverage Multinomial Regression Results (n=750) Variables in the Equation