Downloaded 136 times

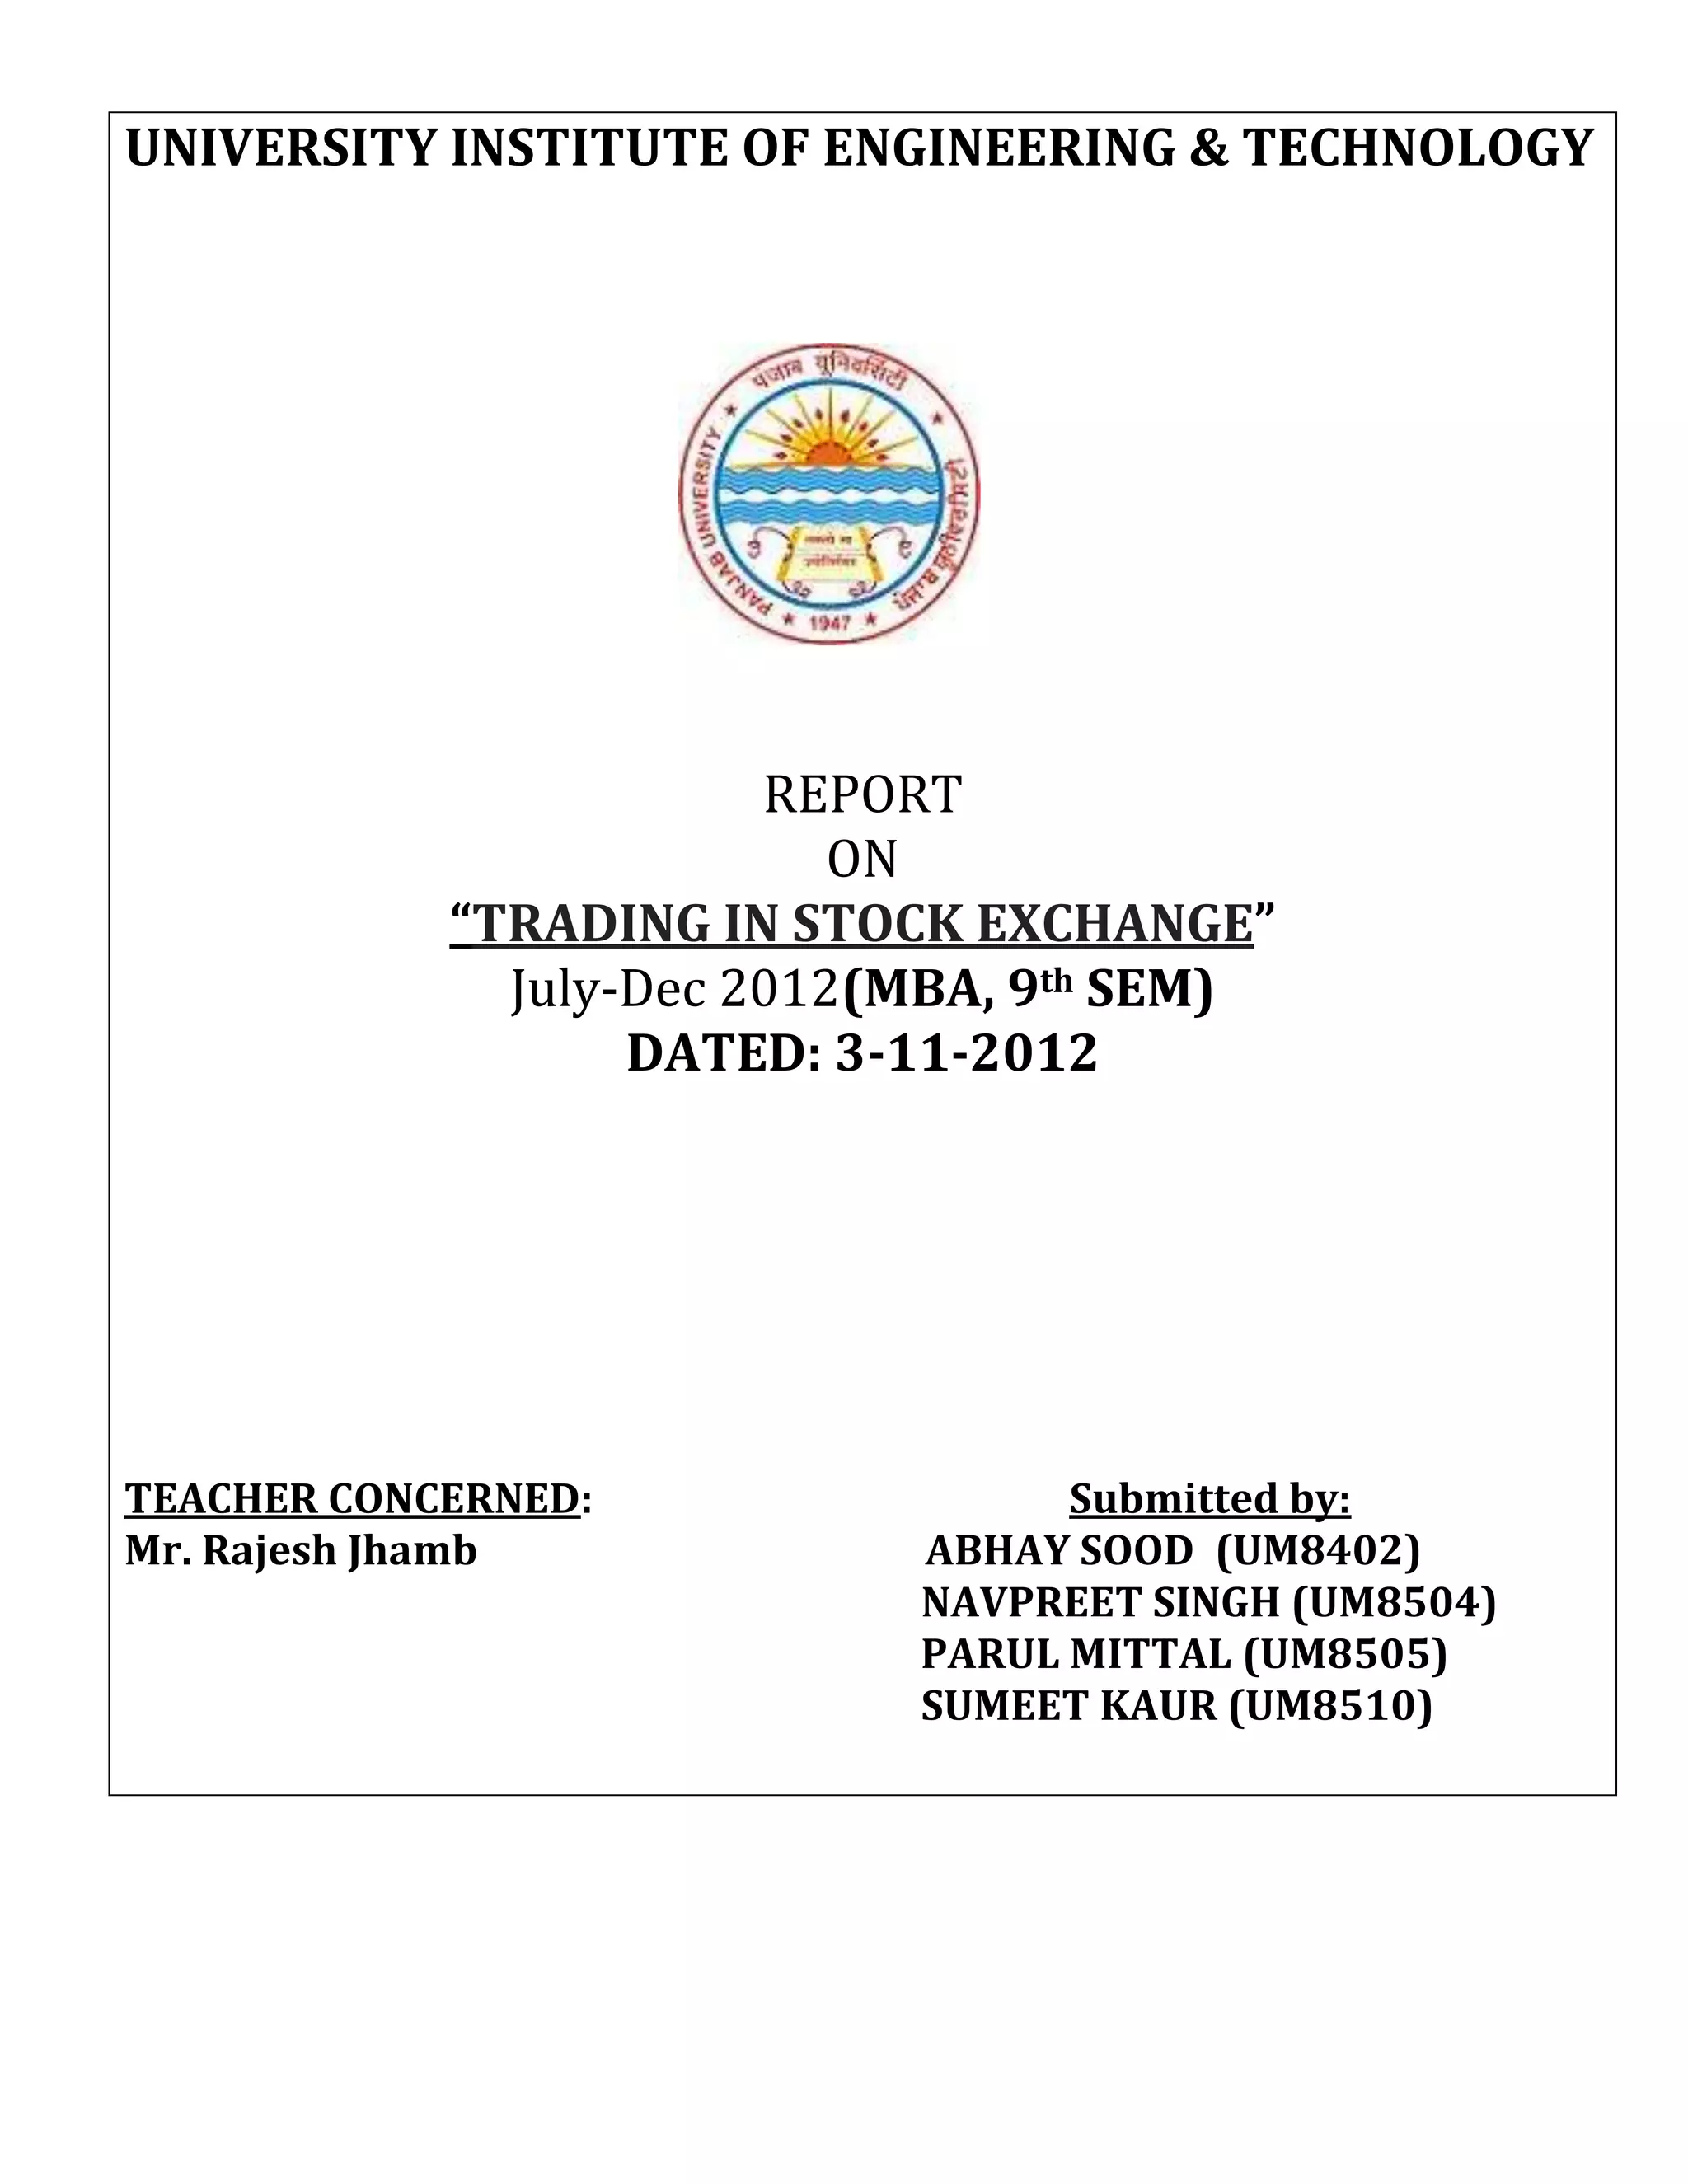
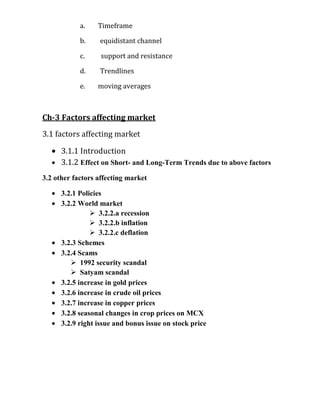
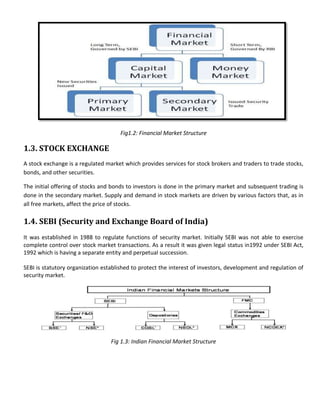
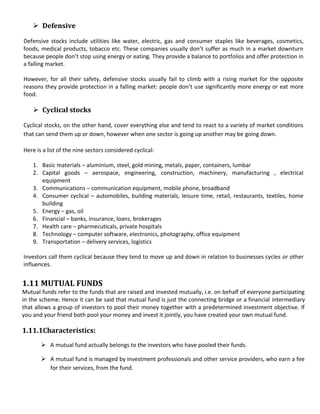
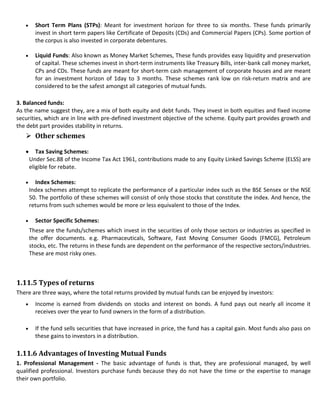
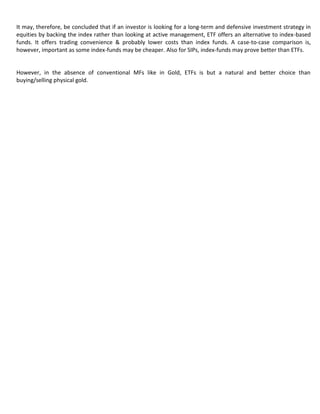
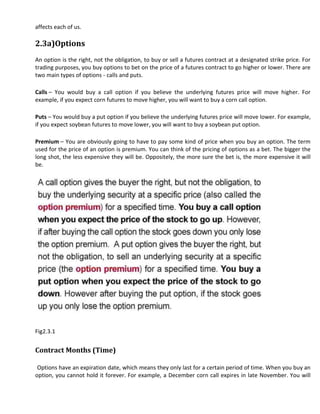
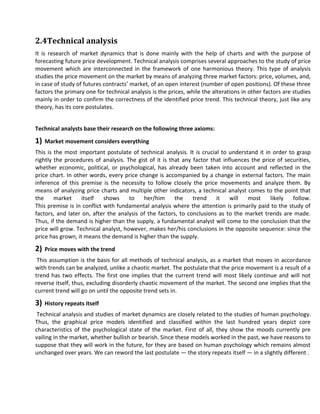
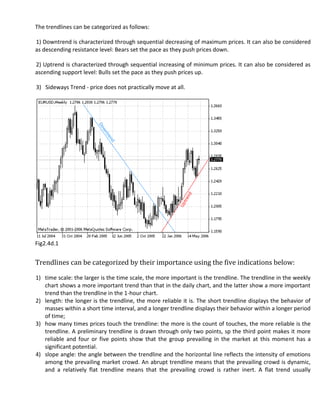
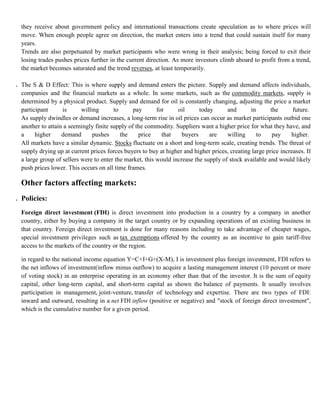
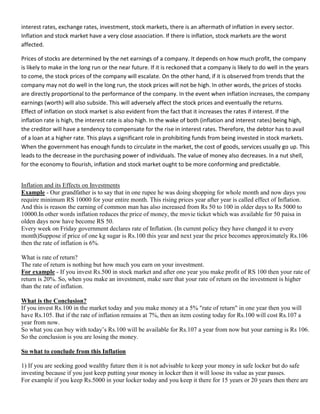
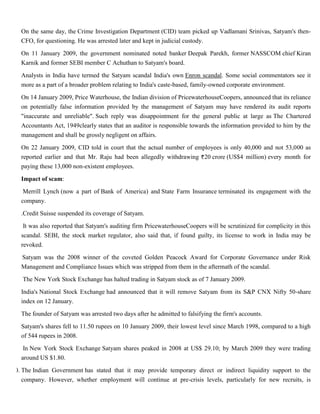
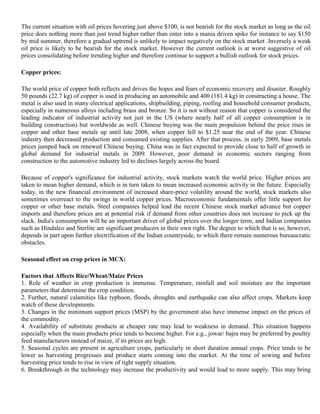
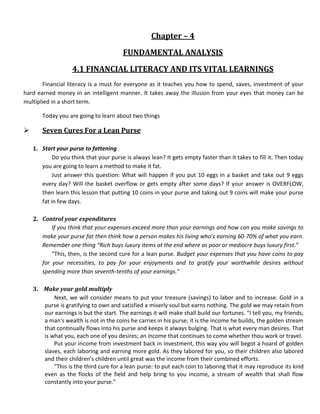
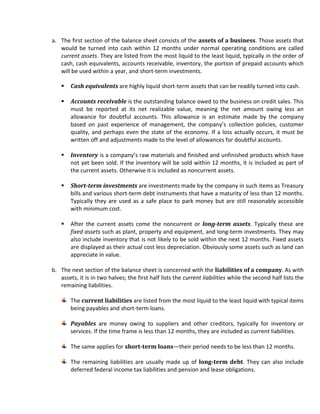
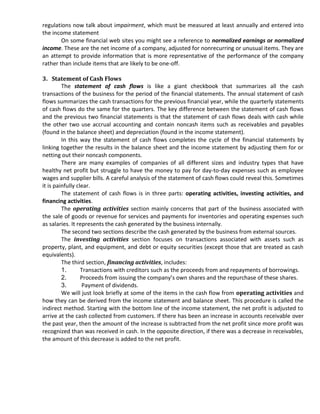
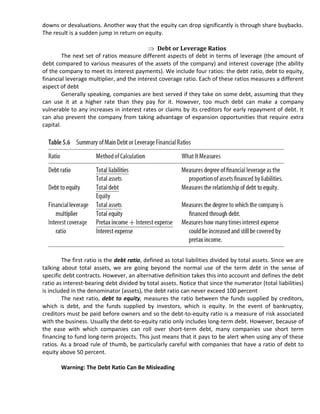
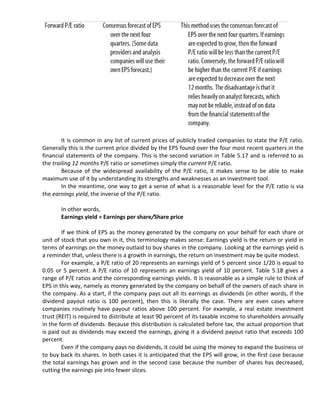
![1. Global recession:
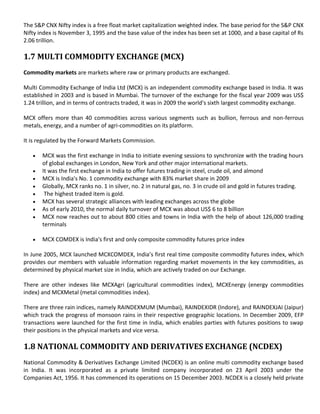
A recession is a decline in a country's Gross Domestic Product (GDP) growth for two or more consecutive quarters
of a year. A recession normally takes place when consumers lose confidence in the growth of the economy and
spend less. This leads to a decreased demand for goods and services, which in turn leads to a decrease in
production, lay-offs and a sharp rise in unemployment. Investors spend less as they fear stocks values will fall and
thus stock markets fall on negative sentiment.
According to the U.S. National Bureau of Economic Research (the official arbiter of U.S. recessions) the recession
began in December 2007 and ended in June 2009.[12][13] US mortgage-backed securities, which had risks that were
hard to assess, were marketed around the world. The emergence of sub-prime loan losses in 2007 began the crisis
and exposed other risky loans and over-inflated asset prices. With loan losses mounting and the fall of Lehman
Brothers on September 15, 2008, a major panic broke out on the inter-bank loan market. As share and housing
prices declined, many large and well established investment and commercial banks in the United States
and Europe suffered huge losses and even faced bankruptcy, resulting in massive public financial assistance.
A global recession has resulted in a sharp drop in international trade, rising unemployment and slumping
commodity prices. In December 2008, the National Bureau of Economic Research (NBER) declared that the
United States had been in recession since December 2007.[16] Several economists predicted that recovery might not
appear until 2011 and that the recession would be the worst since the Great Depression of the 1930s.
Causes:
The origin has been focused on the respective parts played by the public monetary policy (in the US notably) and
by the practices of private financial institutions. In the U.S., mortgage funding was unusually decentralized,
opaque, and competitive, and it is believed that competition between lenders for revenue and market share
contributed to declining underwriting standards and risky lending.
Some economists have claimed that the ultimate point of origin of the financial crisis of 2007–2010 can be traced
back to an extremely indebted US economy. High private debt levels also impact growth by making recessions
deeper and the following recovery weaker.
Impact:
Indian stock market crashed from the high of 20000 to a low of around 8000 points during the year 2008-2009.
Corporate performance of most of the companies remained subdued, and the impact of moderation in demand was
visible in the substantial deceleration during the said years. Corporate profitability also exhibited negative growth,
which has led to the bearish trend in the stock market. Recession has effected the investments made by Foreign
Institutional Investors (FIIs) in the Indian Stock Market as FIIs started disinvesting to meet their commitments
abroad. This is putting lot of pressure on domestic financial system, which has led to liquidity crunch in all major
sectors of the country. 2008 was a bad year for the markets as the Sensex reported some of its major falls during
that year. This owed to the global recession of 2008. Some of the biggest falls of sensex are:
•18th May, 2006 – Massive sell off by FIIs, retail investors and an overall weak global sentiment led to a 826 point
fall in the Sensex, which closed at 11,391 points.
r• 21 January, 2008 — This day marked the highest fall in the history of Sensex as it declined 1,408 points on the
back of investors selling owing to fears about fears that the US may be headed for a recession.
• 22 January, 2008 – Sensex declined by 875 points to close at 16,729 points. Trading was suspended for an hour
at the BSE as crashed by 10 percent.
•11th Feb, 2008 – Sensex declined by 833 points to close at 16,630.9 points.
• 3 March, 2008 — Major sell off by funds, budget related concerns and fears about the US heading for a recession](https://image.slidesharecdn.com/tradinginstockexchange-121111054501-phpapp02/85/Trading-in-stock-exchange-44-320.jpg)
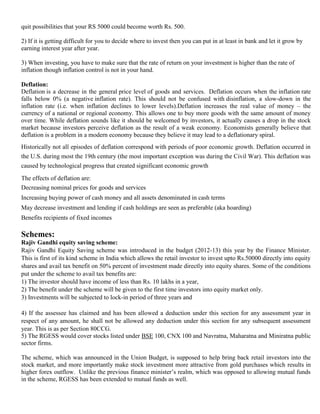
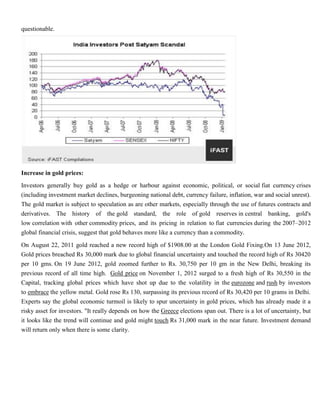
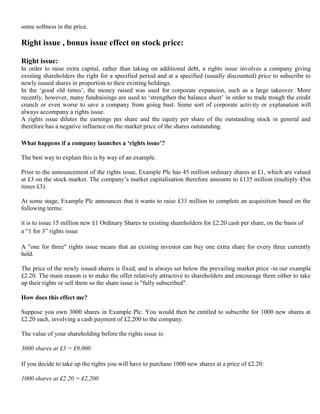
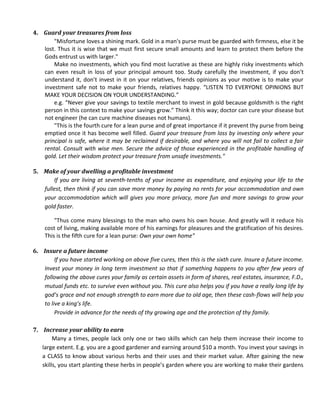
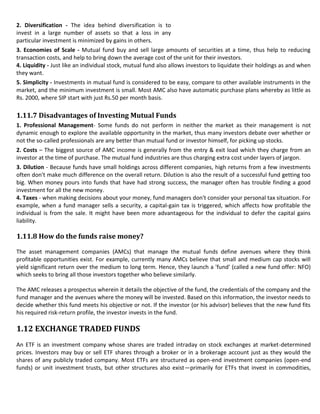
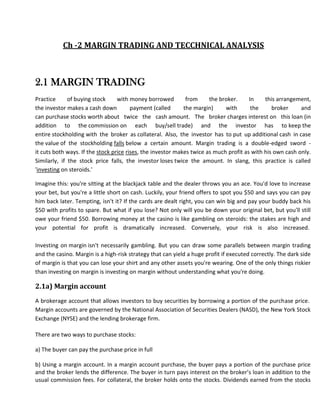
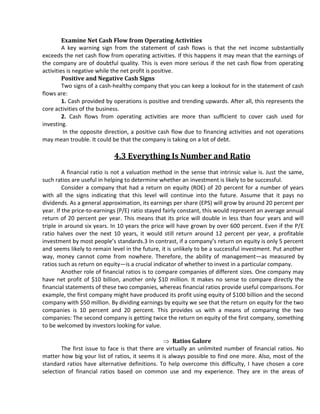
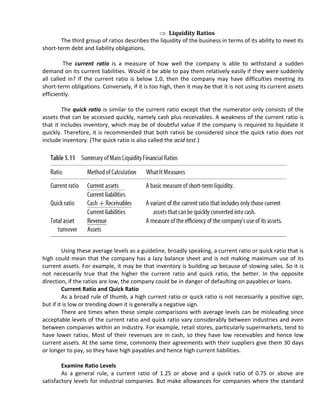
![3. How much money did the company manage to keep? What do they intend doing with it? What did
they do with the money they kept from previous years? Another set of questions relates to financial
ratios.
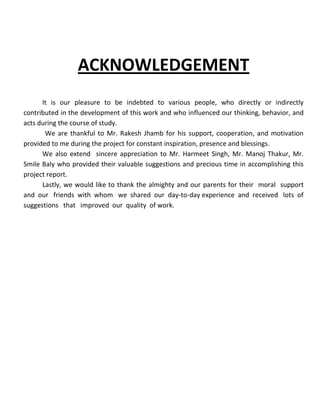
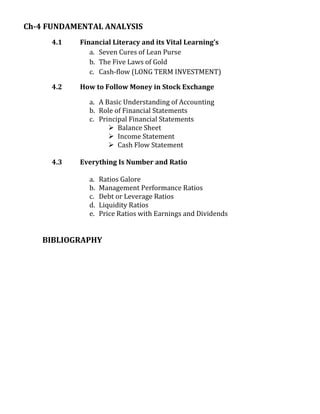
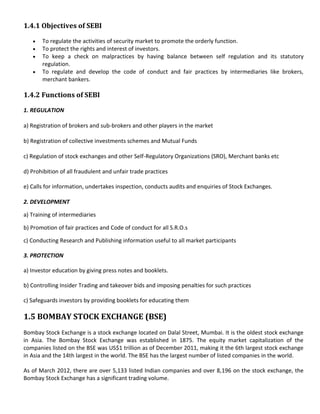
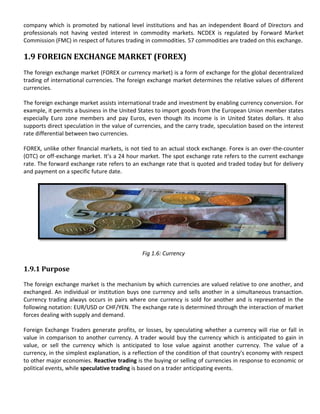
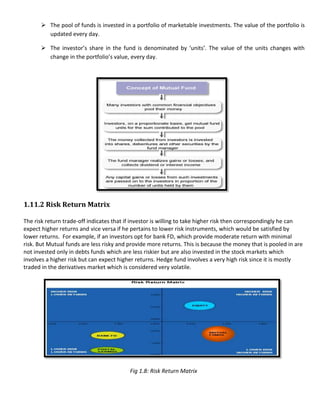
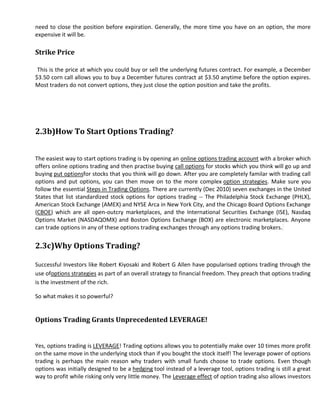
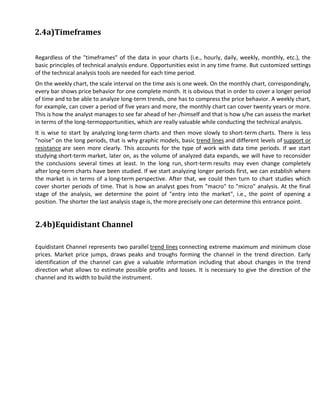
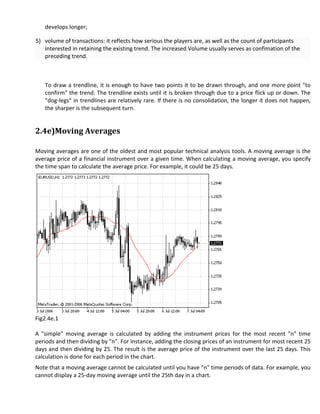
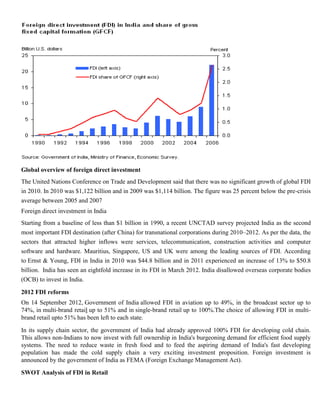
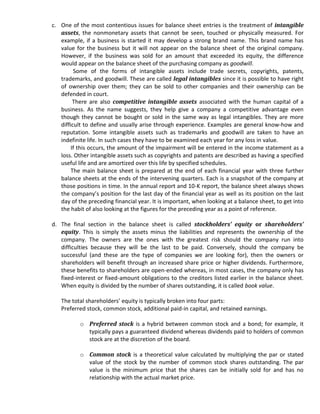
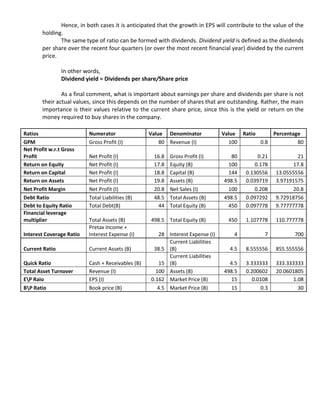
1. Balance Sheet
The balance sheet, also called the statement of financial position, provides a summary of the
equity of the company provided by its shareholders, what the company owns in terms of assets, and
what it owes to its lenders as liabilities.
The core relationship is: Assets = Liabilities + Shareholders Equity
An asset is a resource that has the potential to generate future cash inflows or to reduce future
cash outflows. The assets can be broken down into monetary assets, fixed assets, inventory, and
intangible assets. Conversely, liabilities are expected to lead to a future cash outflow or the loss of a
future cash inflow. The balance sheet is an example of accrual accounting, which means that revenue
and expenses are recognized in the periods in which they are earned or incurred, irrespective of
whether any cash was involved. For example, if a sale is completed with payment to be made in 30
days, this is called a receivable and appears as an asset on the balance sheet. In the opposite
direction, if an agreement is made to pay for an item in 30 days, this is called a payable and appears as
a liability on the balance sheet. A typical arrangement is called end of month plus 30: If purchases are
made within a particular month, they would be payable within 30 days from the end of that month.
The balance sheet or statement of financial position gives a snapshot of the assets and liabilities
of a business at a single point in time.
Liabilities and Shareholders’
Assets Equity
Current assets Current Liabilities
1
Cash and cash equivalents 2.5 Accounts payable 2
2
Accounts receivable .5 Short-term borrowing 1
2
Inventories 0 Other current liabilities 1.5
3
Other current assets .5 Total current liabilities [A] 4.5
3
Total current assets [A] 8.5 Long-term debt 30
Non-Current Assets Other long-term liabilities 14
1
Investments 50 Total liabilities [B] 44
Plant, property and equipment (fixed 2
assets) 35 Shareholders’ equity
7
Intangible assets 5 Share Capital of Rs. 1 each 100
4
Total non-current assets [B] 60 Reserved & Surplus 350
4
TOTAL ASSETS [A+B] 98.5 Total Equity [C] 450
TOTAL LIABILITIES + EQUITY
[A+B+C] 498.5](https://image.slidesharecdn.com/tradinginstockexchange-121111054501-phpapp02/85/Trading-in-stock-exchange-62-320.jpg)
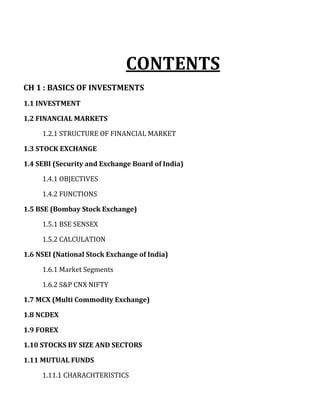
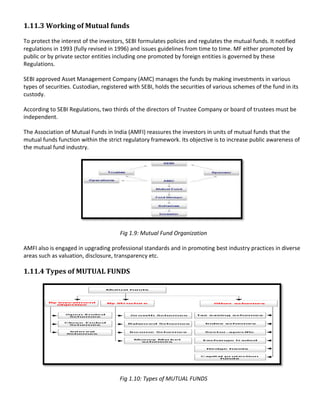
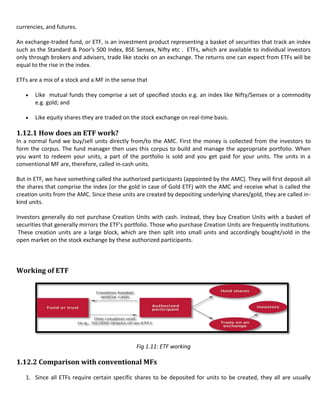
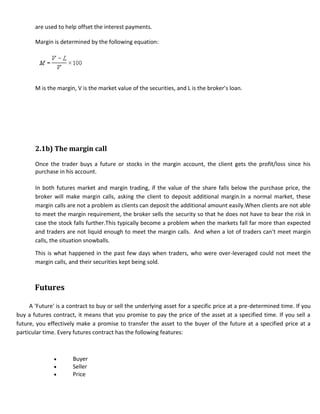
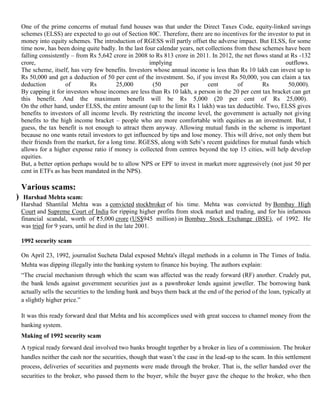
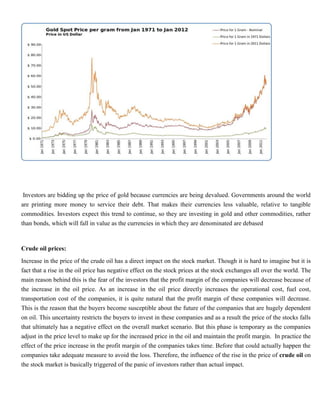
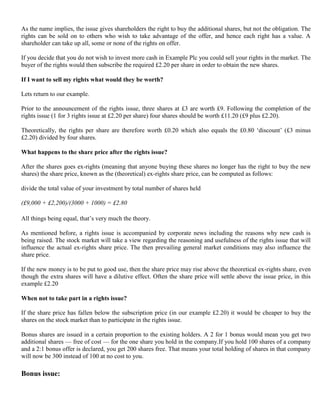
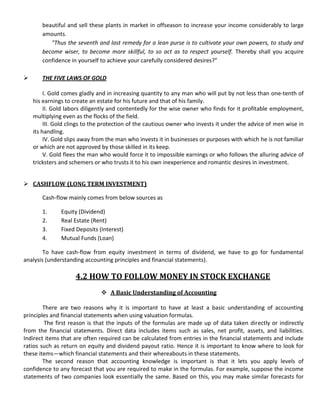
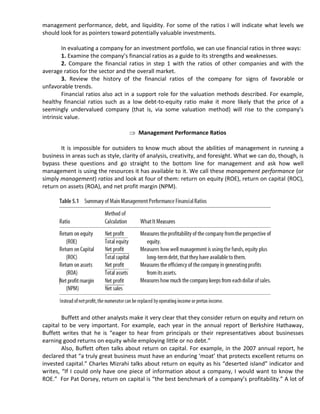
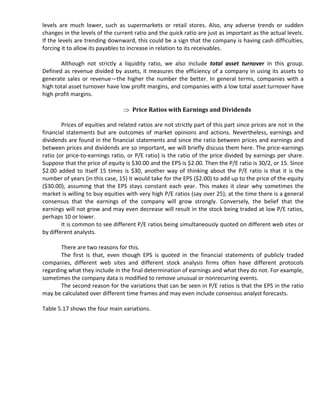
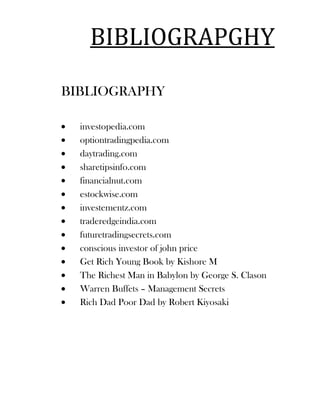
![CASH FLOW FROM OPERATING ACTIVITIES
Income from continuing operations 16.8
Adjustments from continuing operations
Depreciation 9
other operating activities 3
Changes in certain assets and liabilities
Decrease (Increase) in accounts receivables -8
Decrease (Increase) in inventories 5
Increase (Decrease) in accounts payable 8
Increase (Decrease) in accrued liabilities -6
Net cash provided by operating activities (A) 27.8
CASH FLOW FROM INVESTING ACTIVITIES
Purchase of fixed assets -11
Proceeds from sale of fixed assets 7.5
Investment in subsidiaries -3
Interest Received 1.5
Dividend Received 1
Other investing activities -6
Net cash provided by investing activities (B) -10
CASH FLOW FROM FINANCING ACTIVITIES
Increase (Decrease) in short term borrowings -3
Payment of long term debt -8
Dividends Paid -4.86
Purchase of company stock 0
Payment of capital lease obligations -3.5
Proceeds from issuance of long term debt 3.5
Net cash provided by financing activities [C] -15.86
NET INCREASE (DECREASE IN CASH) [A+B+C] 1.94
CASH AT BEGINNING OF YEAR 10
CASH AT END OF YEAR 11.94
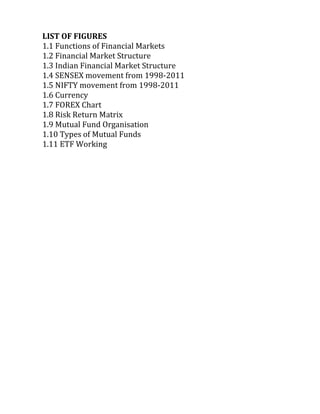
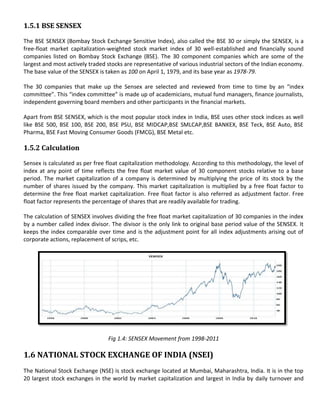
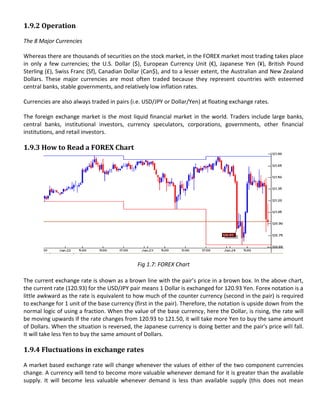
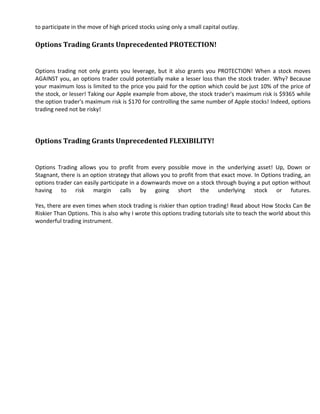
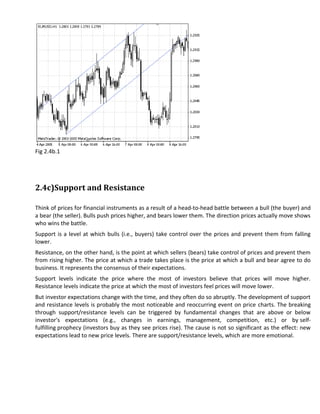
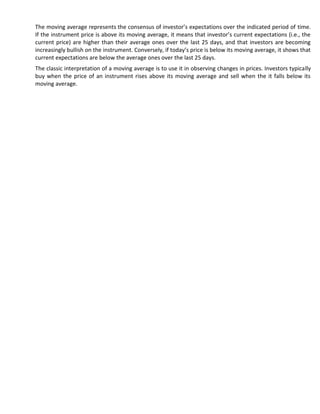
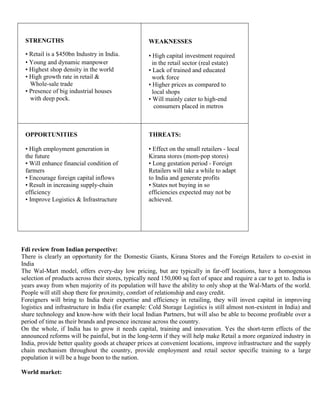
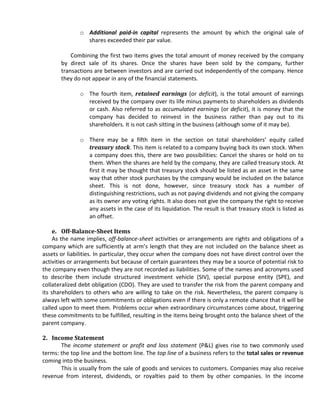
Similarly, if there has been an increase in accounts payable over the past year, then the
amount of the increase is added to the net profit since the company was able to increase the amount
of deferred payments to its suppliers for the purchase of inventory or services. In the opposite
direction, if there was a decrease in payables, the amount of this decrease is subtracted.
The next step is to adjust the cash position for any changes in inventory: If there is an increase
in inventory, the difference is subtracted because more cash was required in the purchase of
inventory than was included in the net profit. Explaining it differently, extra cash has been used to
purchase inventory that has not yet been sold. In the opposite direction, if there was a decrease in
inventory, the amount of the decrease is added to the net profit. The result of these adjustments is
the cash paid to suppliers.](https://image.slidesharecdn.com/tradinginstockexchange-121111054501-phpapp02/85/Trading-in-stock-exchange-68-320.jpg)
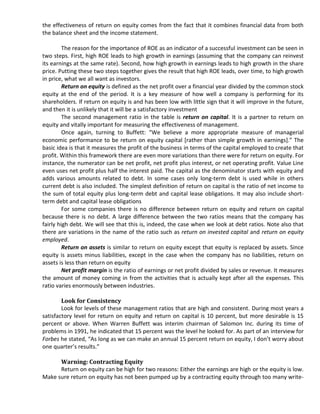
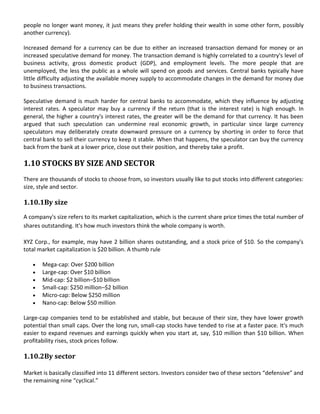
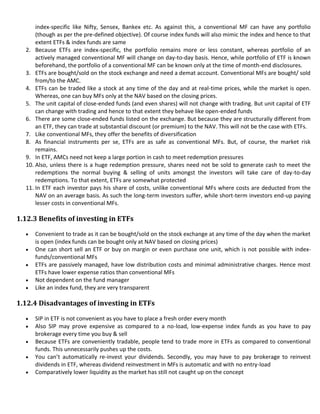
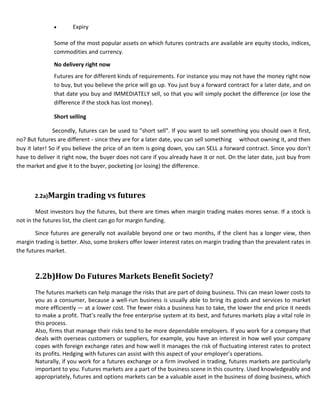
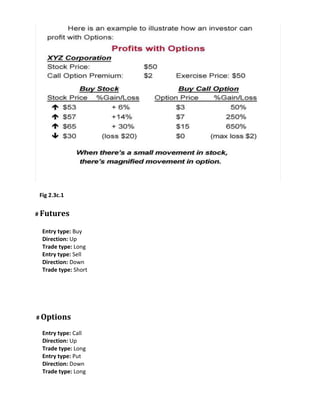
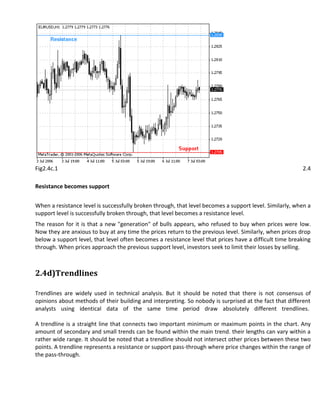
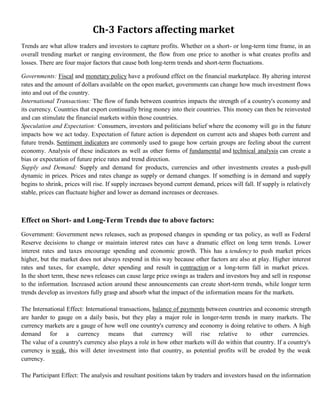
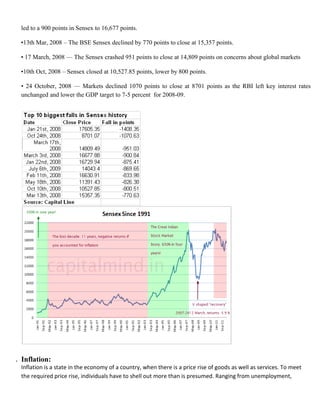
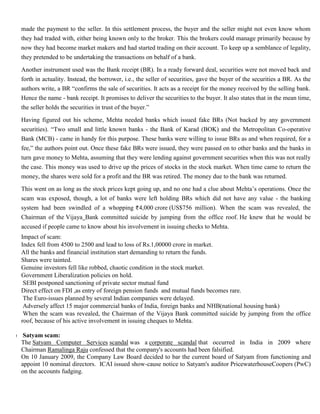
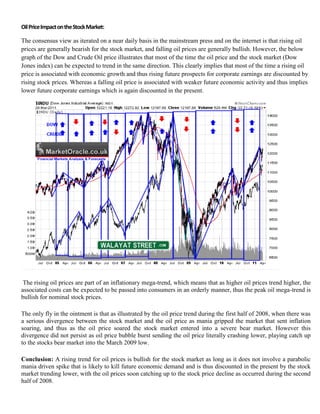
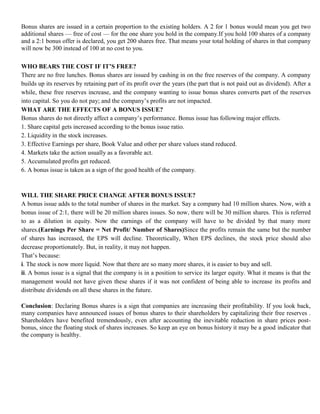
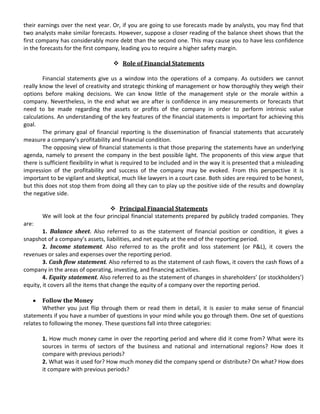
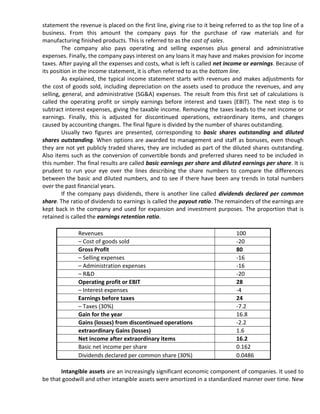
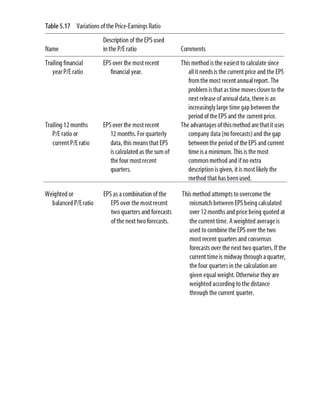
![If a company has a lot of debt, sometimes it will tend to put more attention on the debt ratio
in its reports than on the debt-to-equity ratio. This is because the debt ratio is always below 100
percent and so it looks more benign. The debt-to-equity ratio is a better indicator of the debt level of
a company, so use it as a starting point when evaluating the debt position of a company.
Warren Buffett Talking about Debt
Warren Buffett has a clear opinion about the dangers of high levels of debt for Berkshire
Hathaway or when considering companies to invest in. Here are few examples taken from annual
reports of Berkshire Hathaway. “Good business or investment decisions will eventually produce quite
satisfactory economic results, with no aid from leverage.” (1986) “A small chance of distress or
disgrace [because of high debt] cannot, in our view, be offset by a large chance of extra returns.”
(1988) “The roads of business are riddled with potholes *because of debt+; a plan that requires
dodging them all is a plan for disaster.” (1990) “Debt is a four-letter word around Berkshire.” (2001)
“We use debt sparingly and, when we do borrow, we attempt to structure our loans on a long-term
fixed-rate basis. We will reject interesting opportunities rather than over-leverage our balance sheet.
The financial calculus that Charlie and I employ would never permit our trading a good night’s sleep
for a shot at a few extra percentage points of return.” (2008)
The last debt ratio we consider is the financial leverage multiplier , defined as total assets
divided by total equity. Since assets are equal to equity plus liabilities, the ratio of assets divided by
equity equals 1.0 plus liabilities divided by equity. This means that if the financial leverage multiplier is
1.0, the company has no liabilities; the further it is above 1.0, the greater the liabilities compared to
the equity. It is called a multiplier instead of a ratio since it measures the multiplying effect of extra
liabilities.
The final ratio in this section is called the interest coverage ratio. It measures the ability of the
company to pay its interest bill and is defined as earnings from continuing operations before interest
and taxes over a financial year (commonly called EBIT) divided by the interest expense over the same
period. The higher the ratio, the bigger the safety margin the company has in being able to pay the
interest on its loans. It is also called times interest earned. Anything below 2.0 should be watched
carefully, while below 1.0 means that the company is not earning enough to pay its interest bill.
Examine How the Debt Is Being Used
The level of debt is important, but perhaps more important is what the debt is being used for.
Look for any spikes in the debt-to-equity ratio over past years. If there are any, try to ascertain what
the extra debt is being used for. Buying companies that have little relationship with the core business
is a warning sign. Alternatively, buying companies that augment the existing business may be a sign
that management wants to be more active in growing the business and is not content with internal
organic growth. Notice whether the business has taken on extra debt in the past but has managed to
reduce it to reasonable levels over the next two or three years. This is a sign of the ability of
management to make sensible acquisitions and then integrate them quickly into the overall business.
Warning: Zero Net Debt
Be alert when companies state that they have zero net debt. It does not mean that the
company has no debt. Net debt means total debt less cash and other similar liquid assets, so zero net
debt simply means that it could, in principle, pay all its debts. However, most companies need
reserves in cash and cash equivalents to be able to operate, so it is not feasible to use all of them to
pay off debt.](https://image.slidesharecdn.com/tradinginstockexchange-121111054501-phpapp02/85/Trading-in-stock-exchange-73-320.jpg)

The document provides an overview of investments and financial markets in India. It discusses key concepts like the stock exchange, SEBI, BSE, NSEI, MCX, NCDEX and their roles. It also describes various stock market indices like BSE SENSEX, NIFTY 50. The document is a report submitted by students for their MBA coursework covering basics of investments, trading, technical analysis and factors affecting the stock market.