Business Economics - Unit-2 for IMBA, Osmania University
Tradebarriers
1. Perspectives on Economic Education Research 9(1) 67-74
Journal homepage: www.isu.edu/peer/
A Classroom Experiment on International Free Trade1
Denise Hazletta
a
Department of Economics, Whitman College, 345 Boyer Avenue, Walla Walla, WA 99362, United States
Abstract
The double oral auction classroom experiment described here demonstrates how a trade barrier
hurts some people while helping others, and how removing the barrier affects society overall.
The experiment requires no computerization, takes about 40 minutes to run, and can be used in
classes of 20 to 70 students. In the follow-up discussion or laboratory report assignment,
students work with the experimental data to derive supply and demand curves, find competitive
equilibria, and calculate equilibrium consumer and producer surplus, with and without the trade
barrier. Students then compare their experimental results with these theoretical predictions.
The experiment can be used in a principles, intermediate microeconomics, or international
economics course.
Key Words: classroom experiment, international trade
JEL Codes: A2, F1
1
The author thanks an anonymous referee and Gambhir Kunwar for helpful comments on an earlier version.
2. Hazlett/Perspectives on Economic Education Research 9(1) 67-74
68
1. Introduction
This classroom experiment begins with buyers and sellers divided between two double-oral-
auction markets for the same hypothetical good, called widgets. Each market represents a separate
country. For the first few trading periods, a barrier prevents any trade between the two countries. Each
market thus reaches its own distinct equilibrium. In Country X, relatively high consumption values and
production costs result in higher prices for widgets than in Country Y.
As students complete their trades, the instructor records each transaction on the blackboard for
everyone to see. The instructor uses separate parts of the board for each country, so that students
clearly see the difference in prices between the two markets. After running enough periods for the
markets to reach their respective equilibria, the instructor announces that the two countries have
negotiated a free trade agreement. Now, buyers and sellers can trade with people from the other
country. Equilibrium prices under free trade lie between the prices that prevailed in the separate
markets.
The experiment demonstrates that the law of one price holds under free trade, but not under
restricted trade. The experiment also shows how a free trade agreement can increase the total gains
from trade, yet leave some traders worse off. From the perspective of Country X, free trade leads to a
lower price, leaving its buyers better off and its sellers worse off. From the perspective of Country Y,
free trade makes the price rise, leaving its sellers better off and its buyers worse off. Students thus gain
the individual perspective on free trade of a particular interest group. After the experiment ends,
students calculate total consumer and producer surplus under restricted trade and under free trade.
They see that removing the trade barrier raises total gains from trade, even as it reduces the gains for
some individuals.2
The application of supply and demand analysis and the comparison of gains from trade for a single
good, with and without a trade barrier, differentiate this experiment from those in the existing
classroom experiments literature. For instance, Lawson and Green (2009) present an experiment in
which students estimate how much better off they find themselves after they are allowed to trade items
such as lip gloss and candy that the instructor has allocated to them. Anderson et al. (2008) present an
experiment in which each student makes a labor allocation choice for an entire country, given that
country’s production possibilities frontier, and given Leontief preferences over the two goods the
country can produce. The removal of a trade barrier encourages each country to specialize in
production.
2. Preparing for the experiment
Table 1 shows an example of the private information slips the instructor passes out to establish
each student’s role in the experiment. Appendix A contains the instructions the instructor passes out
and reads aloud before the experiment. Table 2 shows production costs and consumption values for a
class of 20. Producers can sell at most one widget each period, and buyers can buy at most one.
2
This experiment is based on one the author designed and described in an Addison-Wesley instructor’s manual entitled
Economic Experiments in the Classroom (1999).
3. Hazlett/Perspectives on Economic Education Research 9(1) 67-74
69
Table 1: Buyer and Seller Private Information Slips
You live in Country X.
You are Buyer 1. A widget is worth $10 to you.
You live in Country X.
You are Seller A. A widget costs you $6 to produce.
You live in Country Y.
You are Buyer 12. A widget is worth $6 to you.
You live in Country Y.
You are Seller J. A widget costs you $2 to produce.
Table 2: Buyers’ Consumption Values and Sellers’ Production Costs for a Class of 20
Country X Country Y
Buyer ID Value
($)
Seller ID Cost ($) Buyer ID Value
($)
Seller ID Cost ($)
1 10 A 6 12 6 J 2
2 7 B 4 13 4 K 1
3 9 C 6 14 4 L 2
4 11 D 5 15 6 M 3
5 7 N 3
6 8 O 2
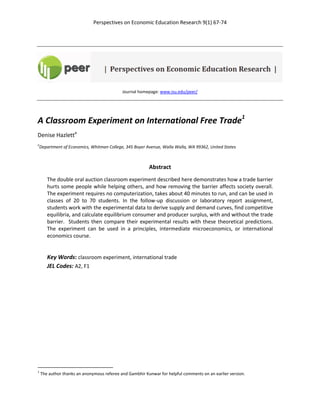
Figures 1-3 display the information in Table 2. Figure 1 shows a graph of the supply and demand
curves in Country X under restricted trade. Similarly, Figure 2 shows a graph of the supply and demand
curves in Country Y under restricted trade.3
In Country X, equilibrium prices range between $7 and $8,
with an equilibrium quantity of four. In Country Y, equilibrium prices range between $2 and $3, with a
quantity of four. Figure 3 shows a graph of the supply and demand curves for the combined market
under free trade. In the equilibrium under free trade, prices range between $5 and $6, with a quantity
of eight.
Consider the equilibrium during the first part of the experiment, while the trade barrier remains in
place. Buyers 2 and 5 in Country X cannot find someone to sell to them in their own country, despite
having high consumption values compared to the buyers in Country Y. Likewise, Sellers M and N in
Country Y cannot find someone to buy from them in their own country, despite having low production
costs compared to the sellers in Country X. After the trade barrier falls, each of these people can trade.
Of course, not everyone benefits from the removal of the trade barrier. In particular, the highest-cost
sellers (Sellers A and C) and the lowest-valued buyers (Buyers 13 and 14) are priced out of the market
under free trade, whereas they could trade when the barrier was in place. In effect, free trade replaces
the lowest-valued buyers with higher-valued buyers, and it replaces the highest-cost sellers with lower-
cost sellers. Total gains from trade rise as a result. Under free trade, gains from trade total $41, versus
$29 ($17 in Country X plus $12 in Country Y) under restricted trade.
3
These graphs are step functions because traders cannot buy or sell fractions of a widget. The graphs were drawn using a
program written by Murphy (2004).
4. Hazlett/Perspectives on Economic Education Research 9(1) 67-74
70
Figure 1: Supply and Demand in Country X
Figure 2: Supply and Demand in Country Y
5. Hazlett/Perspectives on Economic Education Research 9(1) 67-74
71
Figure 3: Supply and Demand under Free Trade
Note that the buyers’ values and sellers’ costs in Table 2 ensure that each student can trade in
equilibrium during at least one part of the experiment. The unequal number of buyers and sellers in
each country comes from not including any traders who would be priced out of the market in both parts
of the experiment. So, Table 2 does not include any very-high-cost sellers from Country X, nor any very-
low-value buyers from Y. Such people would remain unable to trade throughout the entire experiment,
an undesirable role for a student to hold!
3. Results
The individual markets in Countries X and Y reach equilibrium within four or five periods. During
these periods, students tend to watch the prices recorded for the other country, as well as their own.
They will likely anticipate the removal of the trade barrier. Those students who expect to benefit from
the removal (i.e., the buyers in Country X and the sellers in Country Y) eagerly await it. Those who
expect to suffer (i.e., the sellers in Country X and the buyers in Country Y) would rather keep the barrier
in place. Once the trade barrier falls, it takes about three periods for the market to reach the new
equilibrium.
4. Follow up
A quick show of hands following the experiment indicates which traders benefited from free trade
and which lost out. The instructor would ask each group to identify themselves (i.e., whether they
represent buyers or sellers, and from which country). Students thus immediately see the effect of free
trade on particular interest groups. After the instructor gives students the data from Table 2 on buyers’
values and sellers’ costs, students can draw the supply and demand graphs as in Figures 1-3. With these
graphs drawn, they can determine the price and quantity predicted by theory for each set of markets.
They next calculate the theoretical consumer and producer surpluses under both restricted trade and
free trade. Students then use these theoretical predictions to consider how introducing free trade could
affect society as a whole, and individual groups within society. Given data on the actual transactions in
6. Hazlett/Perspectives on Economic Education Research 9(1) 67-74
72
the experiment, students can compare their experimental results with the theoretical predictions. The
following questions can serve as the basis for a debriefing discussion or written report.
5. Questions for the writing assignment and/or discussion
1. Consider the first part of the experiment, when the trade barrier between the countries was in place.
Graph the demand and supply curves for widgets in Country X. (Hint: you find the demand curve from
buyers' given values, not from the results of the experiment. Similarly, you find the supply curve from
sellers’ costs, not from the results of the experiment.)
2. What price and quantity does economic theory predict for Country X, given the barrier to trade with
Country Y? How closely did the experimental results come to this prediction?
3. On a separate graph, draw the demand and supply curves for widgets in Country Y, assuming the
trade barrier is still in place. What price and quantity does economic theory predict for Country Y, given
the barrier to trade with Country X? How closely did the experimental results come to this prediction?
4. Assume the trade barrier is still in place. What consumer surplus and producer surplus does theory
predict for Country X? What consumer surplus and producer surplus does theory predict for Country Y?
How closely did the experimental results come to these predictions?
5. Assume now that the trade barrier falls, so that people from both countries can trade with each
other. On another graph, draw the supply and demand curves for the single market composed of all the
buyers and sellers from both countries. What price and quantity does economic theory predict will trade
now? How closely did the experimental results come to this prediction?
6. What consumer surplus and producer surplus does theory predict, given free trade? How do the
consumer and producer surpluses generated under free trade compare to those generated under
restricted trade? Do you think these countries are better or worse off for having free rather than
restricted trade?
7. What might make a country (like X) have a relatively high demand for a particular good like widgets?
8. What might make a country (like Y) have a relatively high supply of a particular good like widgets?
6. Variations emphasizing the political economy of trade barriers
Frequently students with the roles of Sellers in Country X or Buyers in Y (i.e., those harmed by free
trade) will propose, towards the end of the experiment, re-introducing some form of trade barrier.
Sometimes their suggestions get a sympathetic hearing from their fellow countrymen. A student will
typically propose a specific policy, such as Country X imposing a $2 per unit import tax on sellers from Y.
The students from Country X, buyers and sellers, will consider the idea. Students from Y will often give
their opinions too! If the proposal seems to be gathering support within Country X, the buyers and
sellers in X will vote on it. If the majority approves, we implement the proposal. Allowing this sort of
experimenting within the experiment promotes vigorous debate on the economic merits of policy
proposals. Running a period with the student-generated proposal in place produces rich data for the
debriefing. A class can implement several different proposals, for instance a quota first, then an import
tax, and then an export tax. Additional questions for the follow-up discussion or laboratory report
assignment would be: “What were the results of the protectionist measures taken in the last three
periods of the experiment? Were these measures good for the peoples of Countries X and Y? Who
supported these measures, who opposed them, and why?”
7. Hazlett/Perspectives on Economic Education Research 9(1) 67-74
73
7. Conclusions
This classroom experiment gives instructors a flexible tool for hands-on learning during and after
the experiment. Run early in a principles course, the experiment can introduce competitive markets. In
the debriefing, the instructor could lead the class through the analysis for Country X under restricted
trade, demonstrating how to draw the supply and demand curves for Country X, how to find its
competitive equilibrium, how to calculate its predicted consumer and producer surplus, and how to
compare actual results with predicted results. She could then assign as a written report the symmetric
analysis for Country Y, as well as the analysis for the joint market under free trade.
If used later in a principles of microeconomics course or in an intermediate course (i.e., after
students have studied consumer and producer theory), the discussion or writing assignment could also
include more advanced questions, such as why it might be that Country X has greater demand for
widgets than Country Y, and why Country Y has a greater supply. At any course level, the instructor can
use the experiment to start a thoughtful discussion of the advantages and disadvantages of free trade
agreements.
References
Anderson, L.R., E. Blanchard, K. Chaston, C. Holt, L. Razzolini and R. Singleton (2008) “Production and
Gains from Trade,” Perspectives on Economic Education Research 4: 1-15.
Hazlett, D. (1999) “An International Trade Experiment,” in Economic Experiments in the Classroom: An
Instructor’s Manual to Accompany College Economics Textbooks, Boston: Addison-Wesley.
Lawson, R.A. and C. Green. (2009) “The Trade Game,” Journal of Private Enterprise 24: 175-80.
Murphy, J.J. (2004) “A Simple Program to Conduct a Hand-Run Double Auction in the Classroom,”
Journal of Economic Education 35: 212.
8. Hazlett/Perspectives on Economic Education Research 9(1) 67-74
74
Appendix A
Instructions for the international trade experiment
You live in either Country X or Country Y. Each country has a market for the hypothetical good
called widgets. You are either a buyer or seller of widgets. Your private information slip tells you which
country you live in and whether you are a buyer or seller. A trade barrier exists between Country X and
Country Y, so that you may trade only with people from your own country.
The experiment will consist of a series of market periods. In each period a buyer may choose to
buy one widget, and a seller may choose to sell one widget. No one may trade a fraction of a widget, or
more than one widget per period. However, you may opt to trade no widgets at all in a period.
Those of you who are buyers have a value on your private information slip that tells you how
much consuming a widget is worth to you. If you buy a widget, you earn the difference between this
value and the price that you pay. You should negotiate for the lowest possible price, as long as that
price is lower than your value. Never pay a higher price than what a widget is worth to you, or you
would make a loss. If you do not buy a widget, you earn zero that period.
Those of you who are sellers have a cost of production on your private information slip. If you sell
a widget, you earn the difference between the price and your cost. You should negotiate for the highest
possible price, as long as that price is higher than your cost. Never sell a widget for a price lower than
your cost of production, or you would make a loss. If you do not sell a widget, you earn zero for that
period.
Buyers and sellers make trades using a double oral auction market. Buyers and sellers will mingle
on the trading floor designated for their country. Buyers call out offers by saying, for example, “Buy at
$15,” which indicates willingness to buy a widget at a price of $15. Similarly, sellers call out offers by
saying, for example, “Sell at $45.75,” which indicates willingness to sell a widget at a price of $45.75.
Any buyer may accept any seller’s offer, and any seller may accept any buyer’s offer, as long as both
buyer and seller are from the same country. When a buyer and seller have agreed on a price, they come
to the front of the room and report to me the price, the buyer’s ID number, the seller’s ID letter, and the
country they are from. I will record this information on the board for everyone to see. The finished
buyer and seller then sit at the edge of their country’s trading floor and wait for the next period. Once
everyone who wishes to has traded, I will end the period and start a new one, in which everyone again
has the same production costs or consumption values and again may trade at most one widget.