More Related Content
Similar to Top 5 performance problems in .net applications application performance monitoring blog app_dynamics
Similar to Top 5 performance problems in .net applications application performance monitoring blog app_dynamics (20)
Top 5 performance problems in .net applications application performance monitoring blog app_dynamics
- 1. QUICK
LINKS
HELP
APPDYNAMICS
Real-time performance management is
foundational to AppDynamics customers.
Learn how it’s transforming companies li…
https://t.co/AYcQfVdJ8x
22 hours ago
See more from @AppDynamics >
LATEST FROM THE BLOG
Slowdown is the New Outage (SINTO)
Subscribe to the AppDynamics Newsletter
Enter your email address ›
By clicking subscribe, I have read and
understood the Privacy Policy and Terms of
Use.
TRENDING TOPICS
What is AppDynamics?
AIOps
Supported Technologies
Business iQ
Cloud Migration
Gartner Magic Quadrant APM
Copyright © 2009 - 2019 AppDynamics. All Rights Reserved. Privacy Policy Cookie Policy Terms of Use Security
Blog > Product > Top 5 Performance Problems in .NET Applications
Product
Top 5 Performance Problems in .NET Applications
By Steven Haines | Jun 18,2015 | 13 min read
Summary
The last couple articles presented an introduction to Application
Performance Management (APM) and identified the challenges in
effectively implementing an APM strategy. This article builds on these
topics by reviewing five of the top performance problems you might
experience in your .
Subscribe
to the Blog.
Email Address
I agree to terms & conditions.
Subscribe
Product Pricing Solutions Company Careers Partners
Supply Chain Transparency Diversity
Community Support Documentation Resources University Contact Us
Product Updates Trust Center
English (USA)
The last couple articles presented an introduction to Application Performance Management (APM) and identified
the challenges in effectively implementing an APM strategy. This article builds on these topics by reviewing five of
the top performance problems you might experience in your .NET application.
Specifically this article reviews the following:
Synchronization and Locking
Excessive or unnecessary logging
Code dependencies
Underlying database issues
Underlying infrastructure issues
1. Synchronization and Locking
There are times in your application code when you want to ensure that only a single thread can execute a subset of
code at a time. Examples include accessing shared software resources, such as a single threaded rule execution
component, and shared infrastructure resources, such as a file handle or a network connection. The .NET framework
provides different types of synchronization strategies, including locks/monitors, inter-process mutexs, and
specialized locks like the Reader/Writer lock.
Regardless of why you have to synchronize you code or of the mechanism you choose to synchronize your code, you
are left with a problem: there is a portion of your code that can only be executed by one thread at a time. Consider
going to the supermarket that only has a single cashier to check people out: multiple people can enter the store,
browse for products, and add them to their carts, but at some point they will all line up to pay for the food. In this
example, the shopping activity is multithreaded and each person represents a thread. The checkout activity,
however, is single threaded, meaning that every person must line up and pay for their purchases one-at-a-time. This
process is shown in figure 1.
Figure 1 Thread Synchronization
We have seven threads that all need to access a synchronized block of code, so one-by-one they are granted access
to the block of code, perform their function, and then continue on their way.
The process of thread synchronization is summarized in figure 2.
Figure 2 Thread Synchronization Process
A lock is created on a specific object (System.Object derivative), meaning that when a thread attempts to enter the
synchronized block of code it must obtain the lock on the synchronized object. If the lock is available then that
thread is granted permission to execute the synchronized code. In the example in figure 2, when the second thread
arrives, the first thread already has the lock, so the second thread is forced to wait until the first thread completes.
When the first thread completes, it releases the lock, and then the second is granted access.
As you might surmise, thread synchronization can present a big challenge to .NET applications. We design our
applications to be able to support dozens and even hundreds of simultaneous requests, but thread synchronization
can serialize all of the threads processing those requests into a single bottleneck!
The solution is two-fold:
Closely examine the code you are synchronizing to determine if another option is viable
Limit the scope of your synchronized block
There are times when you are accessing a shared resource that must be synchronized but there are many times when
you can restate the problem in such a way that you can avoid synchronization altogether. For example, we were using
a rules process engine that had a single-threaded requirement that was slowing down all requests in our application.
It was obviously a design flaw and so we replaced that library with one that could parallelize its work. You need to ask
yourself if there is a better alternative: if you are writing to a local file system, could you instead send the information
to a service that stores it in a database? Can you make objects immutable so that it does not matter whether or not
multiple threads access them? And so forth…
For those sections of code that absolutely must be synchronized, choose your locks wisely. Your goal is to isolate the
synchronized code block down to the bare minimum requirement for synchronization. It is typically best to define a
specific object to synchronize on, rather than to synchronize on the object containing the synchronized code
because you might inadvertently slow down other interactions with that object. Finally, consider when you can use a
Read/Write lock instead of a standard lock so that you can allow reads to a resource while only synchronizing
changes to the resource.
2. Excessive or Unnecessary Logging
Logging is a powerful tool in your debugging arsenal that allows you to identify abnormalities that might have
occurred at a specific time during the execution of your application. It is important to capture errors when they
occur and gather together as much contextual information as you can. But there is a fine line between succinctly
capturing error conditions and logging excessively.
Two of the most common problems are:
Logging exceptions at multiple levels
Misconfiguring production logging levels
It is important to log exceptions so that you can understand problems that are occurring in your application, but a
common problem is to log exceptions at every layer of your application. For example, you might have a data access
object that catches a database exception and raises its own exception to your service tier. The service tier might
catch that exception and raise its own exception to the web tier. If we log the exception at the data tier, service tier,
and web tier, then we have three stack traces of the same error condition. This incurs additional overhead in writing
to the log file and it bloats the log file with redundant information. But this problem is so common that I assert that if
you examine your own log files that you’ll probably find at least a couple examples of this behavior.
The other big logging problem that we commonly observe in production applications is related to logging levels.
.NET loggers define the following logging levels (named differently between the .NET TraceLevel and log4net, but
categorically similar):
Off
Fatal
Error
Warning
Info
Verbose / Debug
In a production application you should only ever be logging error or fatal level logging statements. In lower
environments it is perfectly fine to capture warning and even informational logging messages, but once your
application is in production, the user load will quickly saturate the logger and bring your application to its knees. If
you inadvertently leave debug level logging on in a production application, it is not uncommon to see response times
two or three times higher than normal!
3. Code Dependencies
Developing applications is a challenging job. Not only are you building the logic to satisfy your business
requirements, but you are also choosing the best libraries and tools to help you. Could you imaging building all of
your own logging management code, all of your own XML and JSON parsing logic, or all of your own serialization
libraries? You could build code to do this, but why should you when teams of open source developers have already
done it for you? Furthermore, if you are integrating with a third party system, should you read through a proprietary
communication protocol specification or should you purchase a vendor library that does it for you?
I’m sure you’ll agree that if someone has already solved a problem for you, it is more efficient to use his or her
solution than to roll your own. If it is an open source project that has been adopted by a large number of companies
then chances are that it should be well tested, well documented, and you should be able to find plenty of examples
about how to use it.
There are dangers to using dependent libraries, however. You need to ask the following questions:
Is the library truly well written and well tested?
Are you using the library in the same manner as the large number of companies that are using it?
Are you using it correctly?
Make sure that you do some research before choosing your external libraries and, if you have any question about a
library’s performance, then run some performance tests. Open source projects are great in that you have full access
to their source code as well as their test suites and build processes. Download their source code, execute their build
process, and look through their test results. If you see a high percentage of test coverage then you can have more
confidence than if you do not find any test cases!
Finally, make sure that you are using dependent libraries correctly. I work in an organization that is strongly opposed
to Object Relational Mapping (ORM) solutions because of performance problems that they have experienced in the
past. But because I have spent more than a decade in performance analysis, I can assure you that ORM tools can
greatly enhance performance if they are used correctly. The problem with ORM tools is that if you do not take the
time to learn how to use them correctly, you can easily shoot yourself in the foot and destroy the performance of
your application. The point is that tools that are meant to help you can actually hurt you if you do not take the time to
learn how to use them correctly.
Before leaving this topic, it is important to note that if you are using a performance management solution, like
AppDynamics, it can not only alert you to problems in your application, but it can alert you to problems in your
dependent code, even if your dependent code is in a compiled binary form. If you find the root cause of a
performance problem in an open source library, you can fix it and contribute an update back to the open source
community. If you find the root cause of a performance problem in a vendor built library, you can greatly reduce the
amount of time that the vendor will need to resolve the problem. If you have ever opened a ticket with a vendor to
fix a performance problem that you cannot clearly articulate, then you have experienced a long and unproductive
wait for a resolution. But if you are able to point them to the exact code inside their library that is causing the
problem, then you have a far greater chance of receiving a fix in a reasonable amount of time.
4. Underlying Database Issues
Almost all applications of substance will ultimately store data in or retrieve data from a database or document store.
As a result, the tuning of your database, your database queries, and your stored procedures is paramount to the
performance of your application.
There is a philosophical division between application architects/developers and database architects/developers.
Application architects tend to feel that all business logic should reside inside the application and the database
should merely provide access to the data. Database architects, on the other hand, tend to feel that pushing business
logic closer to the database improves performance. The answer to this division is probably somewhere in the middle.
As an application architect I tend to favor putting more business logic in the application, but I fully acknowledge that
database architects are far better at understanding the data and the best way of interacting with that data. I think
that it should be a collaborative effort between both groups to derive the best solution. But regardless of where you
fall on this spectrum, be sure that your database architects review your data model, all of your queries, and your
stored procedures. They have a wealth of information to shed on the best way to tune and configure your database
and they have a host of tools that can tune your queries for you. For example, there are tools that will optimize your
SQL for you, following these steps:
Analyze your SQL
Determine the explain plan for your query
Use artificial intelligence to generate alternative SQL statements
Determine the explain plans for all alternatives
Present you with the best query options to accomplish your objective
When I was writing database code I used one of these tools and quantified the results under load and a few tweaks
and optimizations can make a world of difference.
5. Underlying Infrastructure Issues
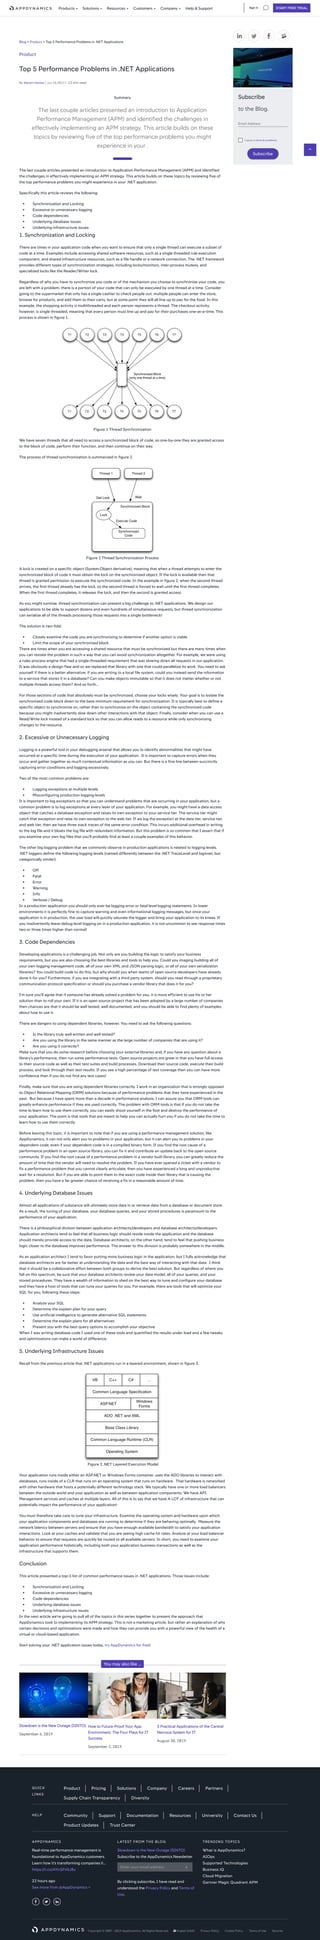
Recall from the previous article that .NET applications run in a layered environment, shown in figure 3.
Figure 3 .NET Layered Execution Model
Your application runs inside either an ASP.NET or Windows Forms container, uses the ADO libraries to interact with
databases, runs inside of a CLR that runs on an operating system that runs on hardware. That hardware is networked
with other hardware that hosts a potentially different technology stack. We typically have one or more load balancers
between the outside world and your application as well as between application components. We have API
Management services and caches at multiple layers. All of this is to say that we have A LOT of infrastructure that can
potentially impact the performance of your application!
You must therefore take care to tune your infrastructure. Examine the operating system and hardware upon which
your application components and databases are running to determine if they are behaving optimally. Measure the
network latency between servers and ensure that you have enough available bandwidth to satisfy your application
interactions. Look at your caches and validate that you are seeing high cache hit rates. Analyze at your load balancer
behavior to ensure that requests are quickly be routed to all available servers. In short, you need to examine your
application performance holistically, including both your application business transactions as well as the
infrastructure that supports them.
Conclusion
This article presented a top-5 list of common performance issues in .NET applications. Those issues include:
Synchronization and Locking
Excessive or unnecessary logging
Code dependencies
Underlying database issues
Underlying infrastructure issues
In the next article we’re going to pull all of the topics in this series together to present the approach that
AppDynamics took to implementing its APM strategy. This is not a marketing article, but rather an explanation of why
certain decisions and optimizations were made and how they can provide you with a powerful view of the health of a
virtual or cloud-based application.
Start solving your .NET application issues today, try AppDynamics for free!
You may also like ...
Slowdown is the New Outage (SINTO)
September 6, 2019
How to Future-Proof Your App
Environment: The Four Plays for IT
Success
September 2, 2019
3 Practical Applications of the Central
Nervous System for IT
August 30, 2019
Products Solutions Resources Customers Company Help & Support START FREE TRIALSign in