SlideShare a Scribd company logo
1 of 23
Download to read offline
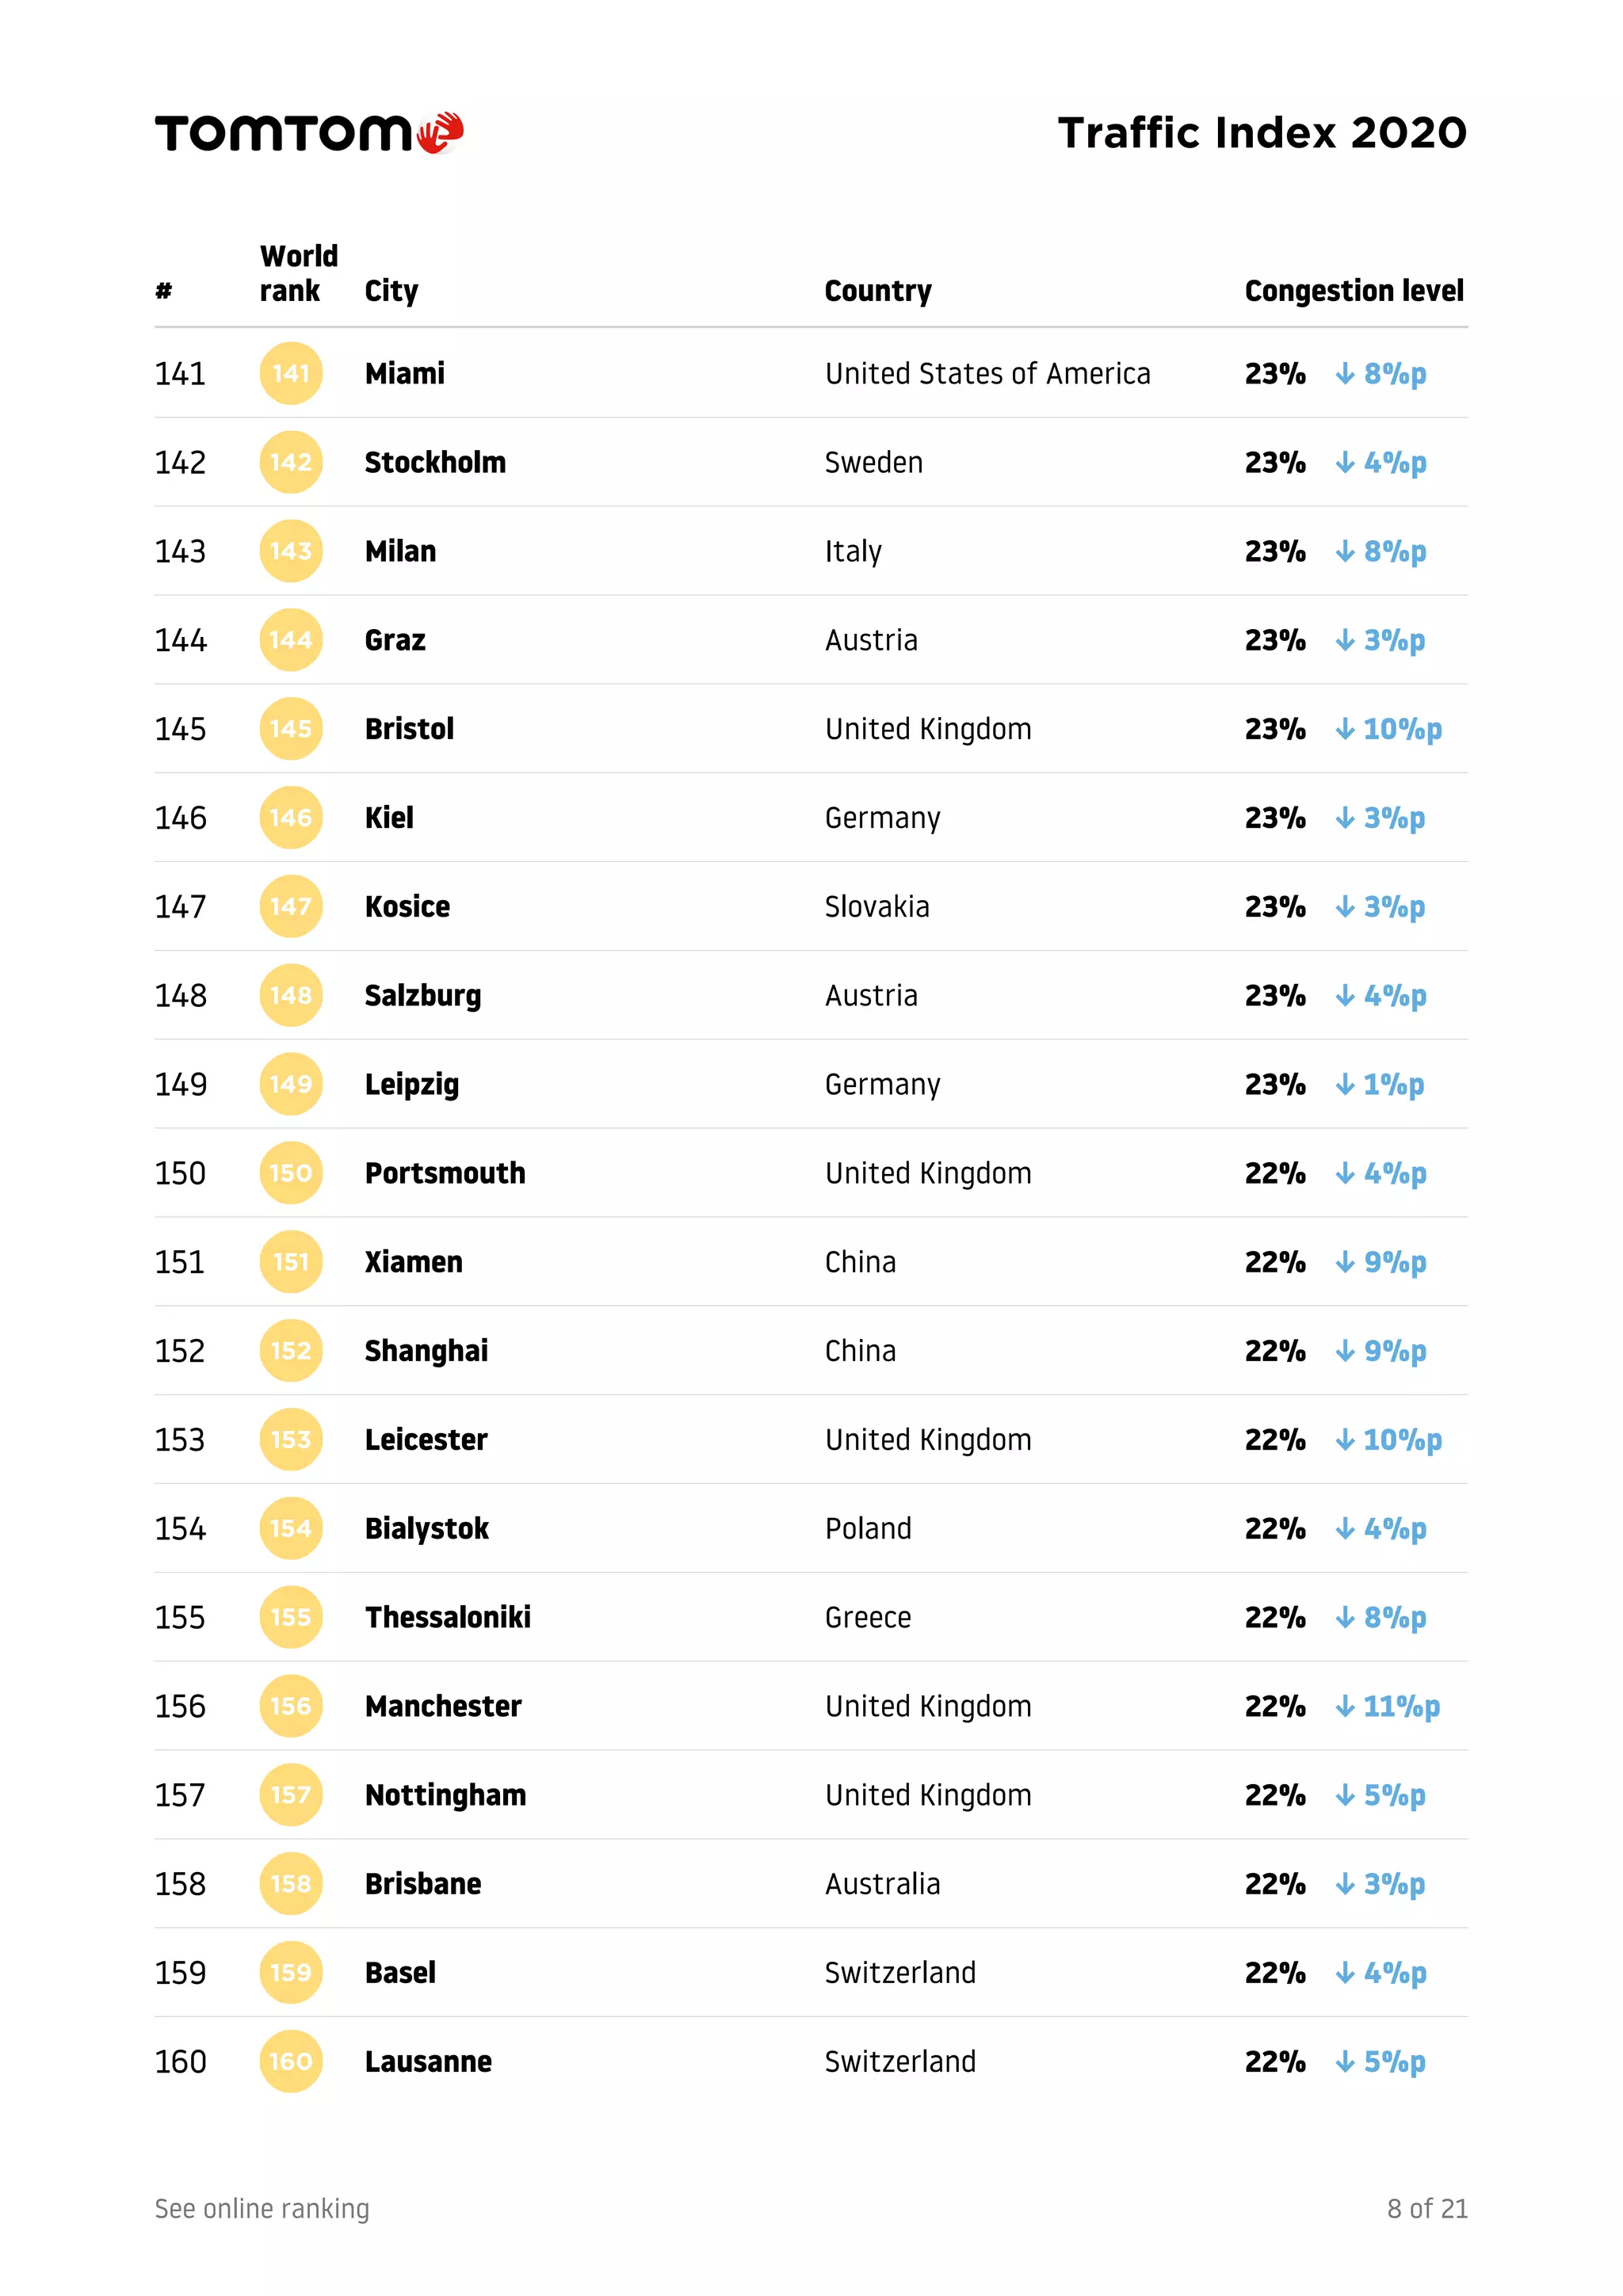
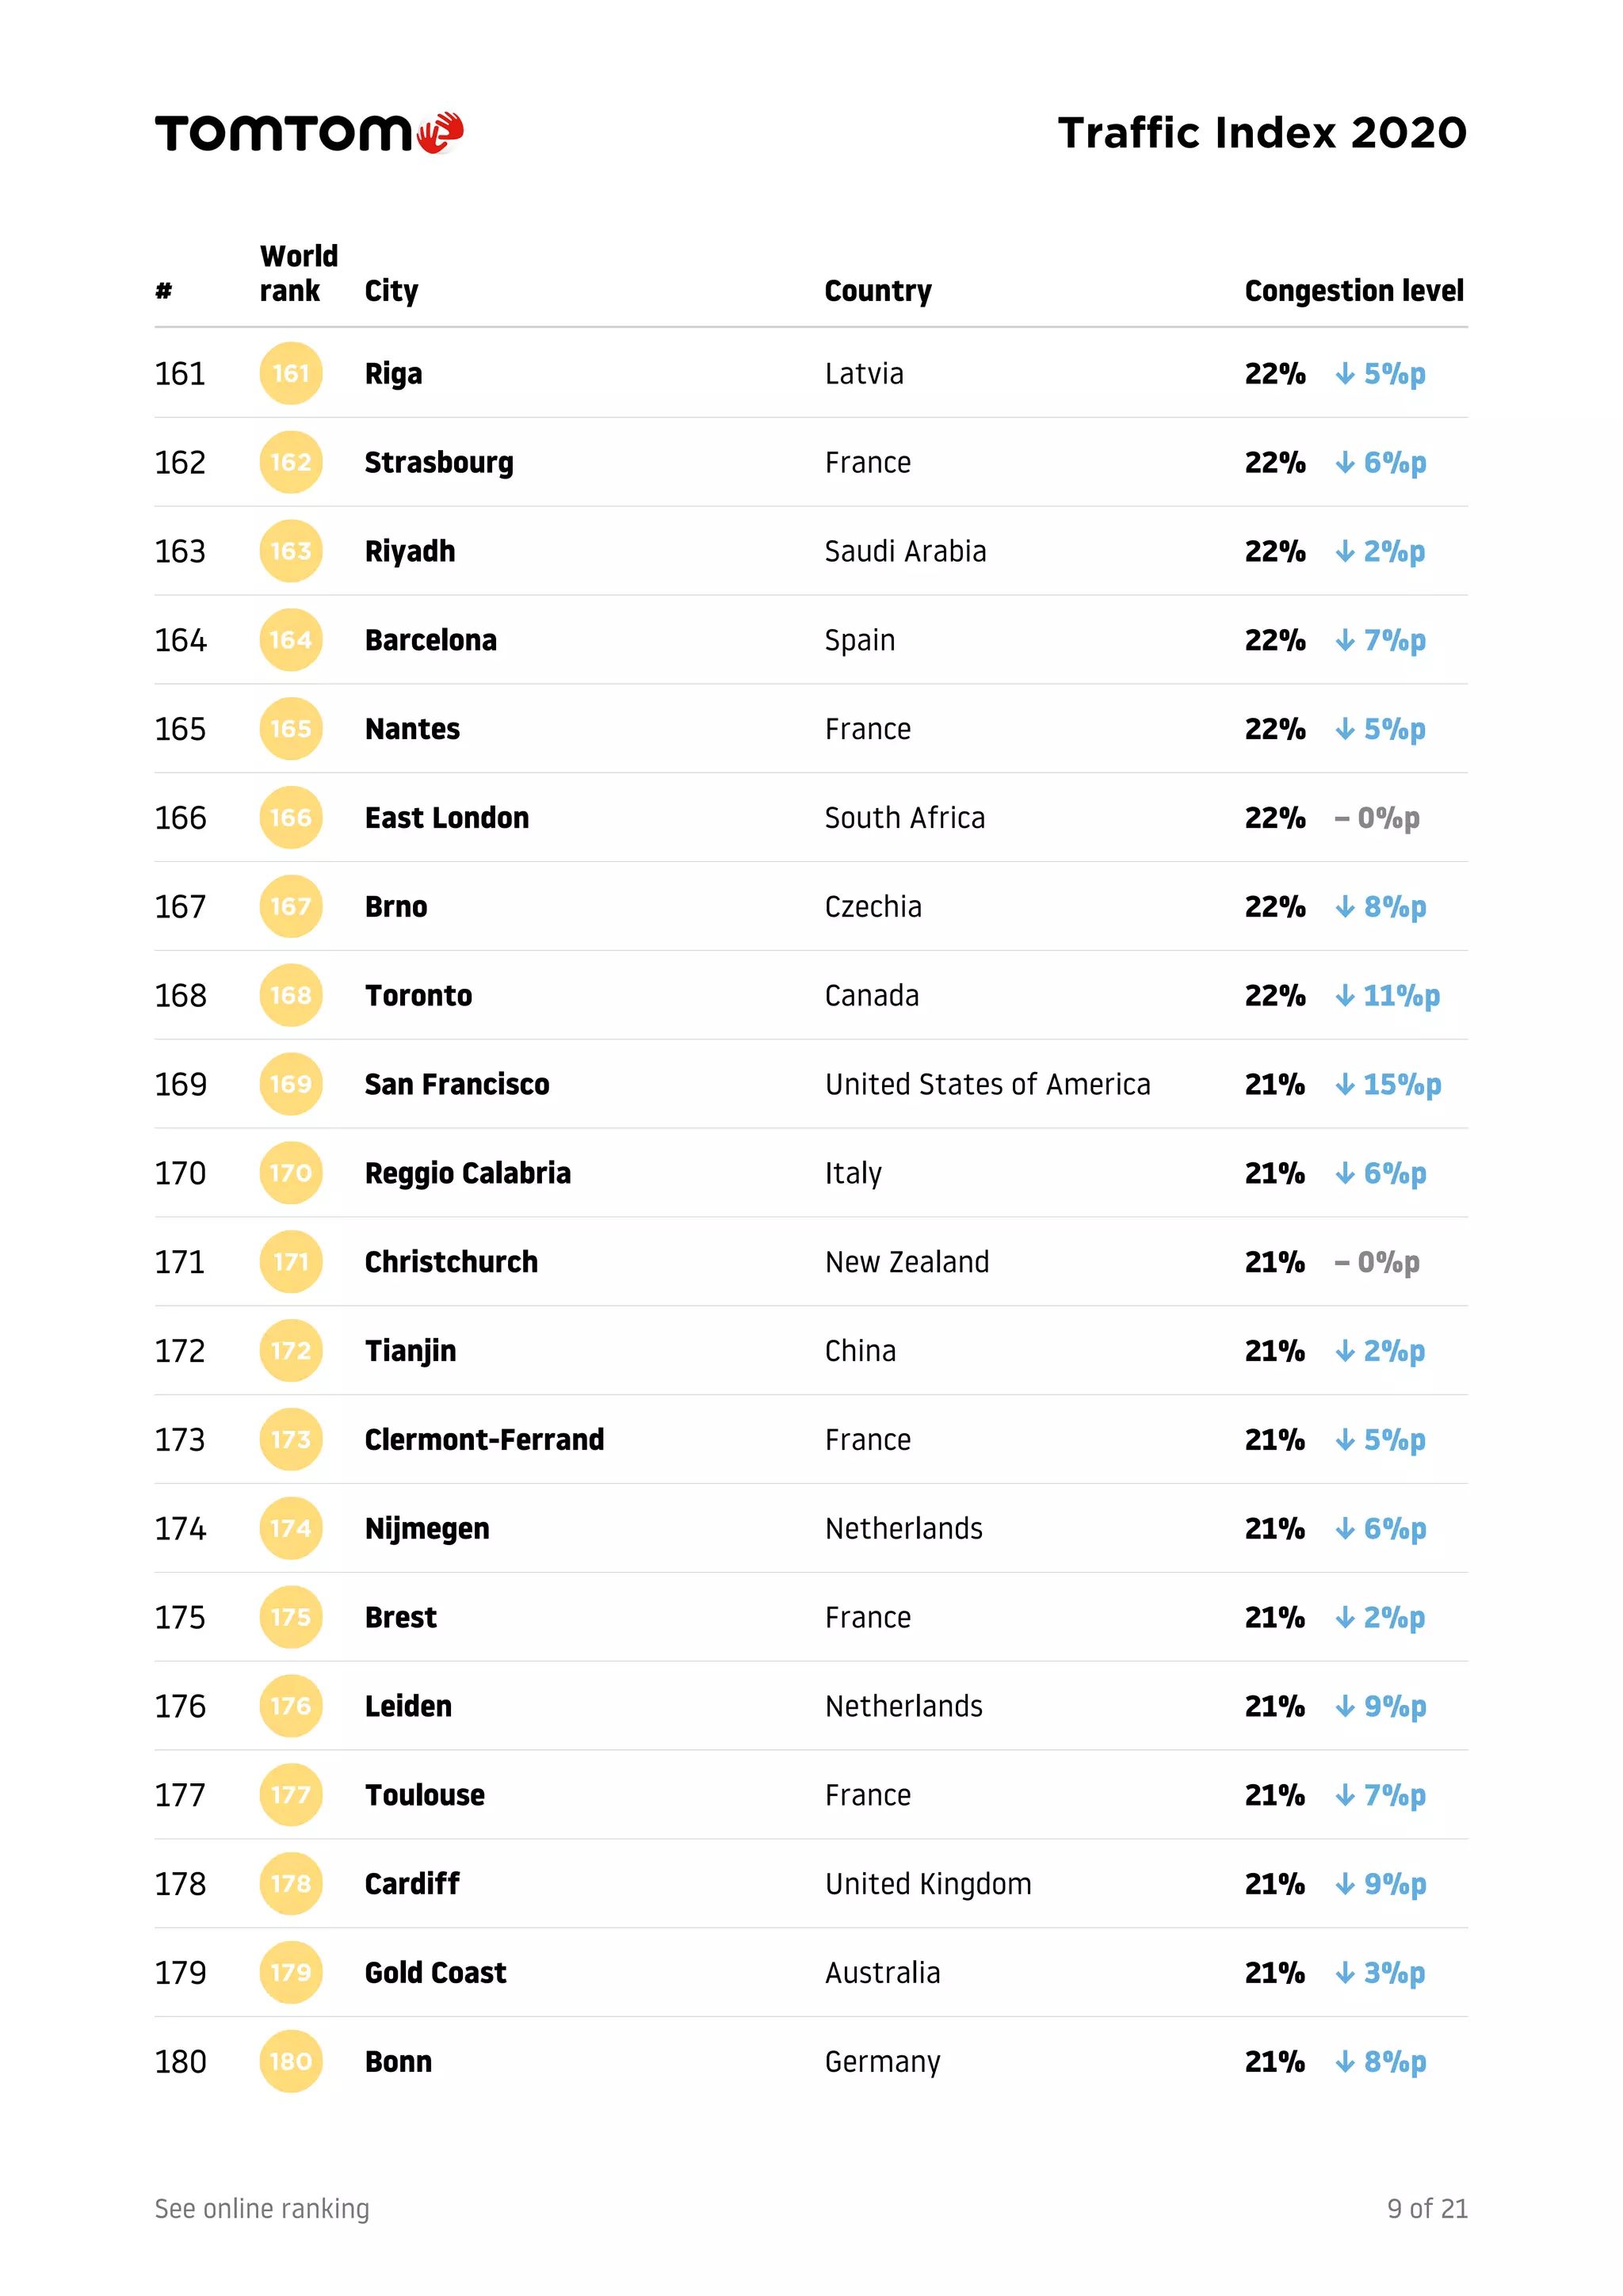
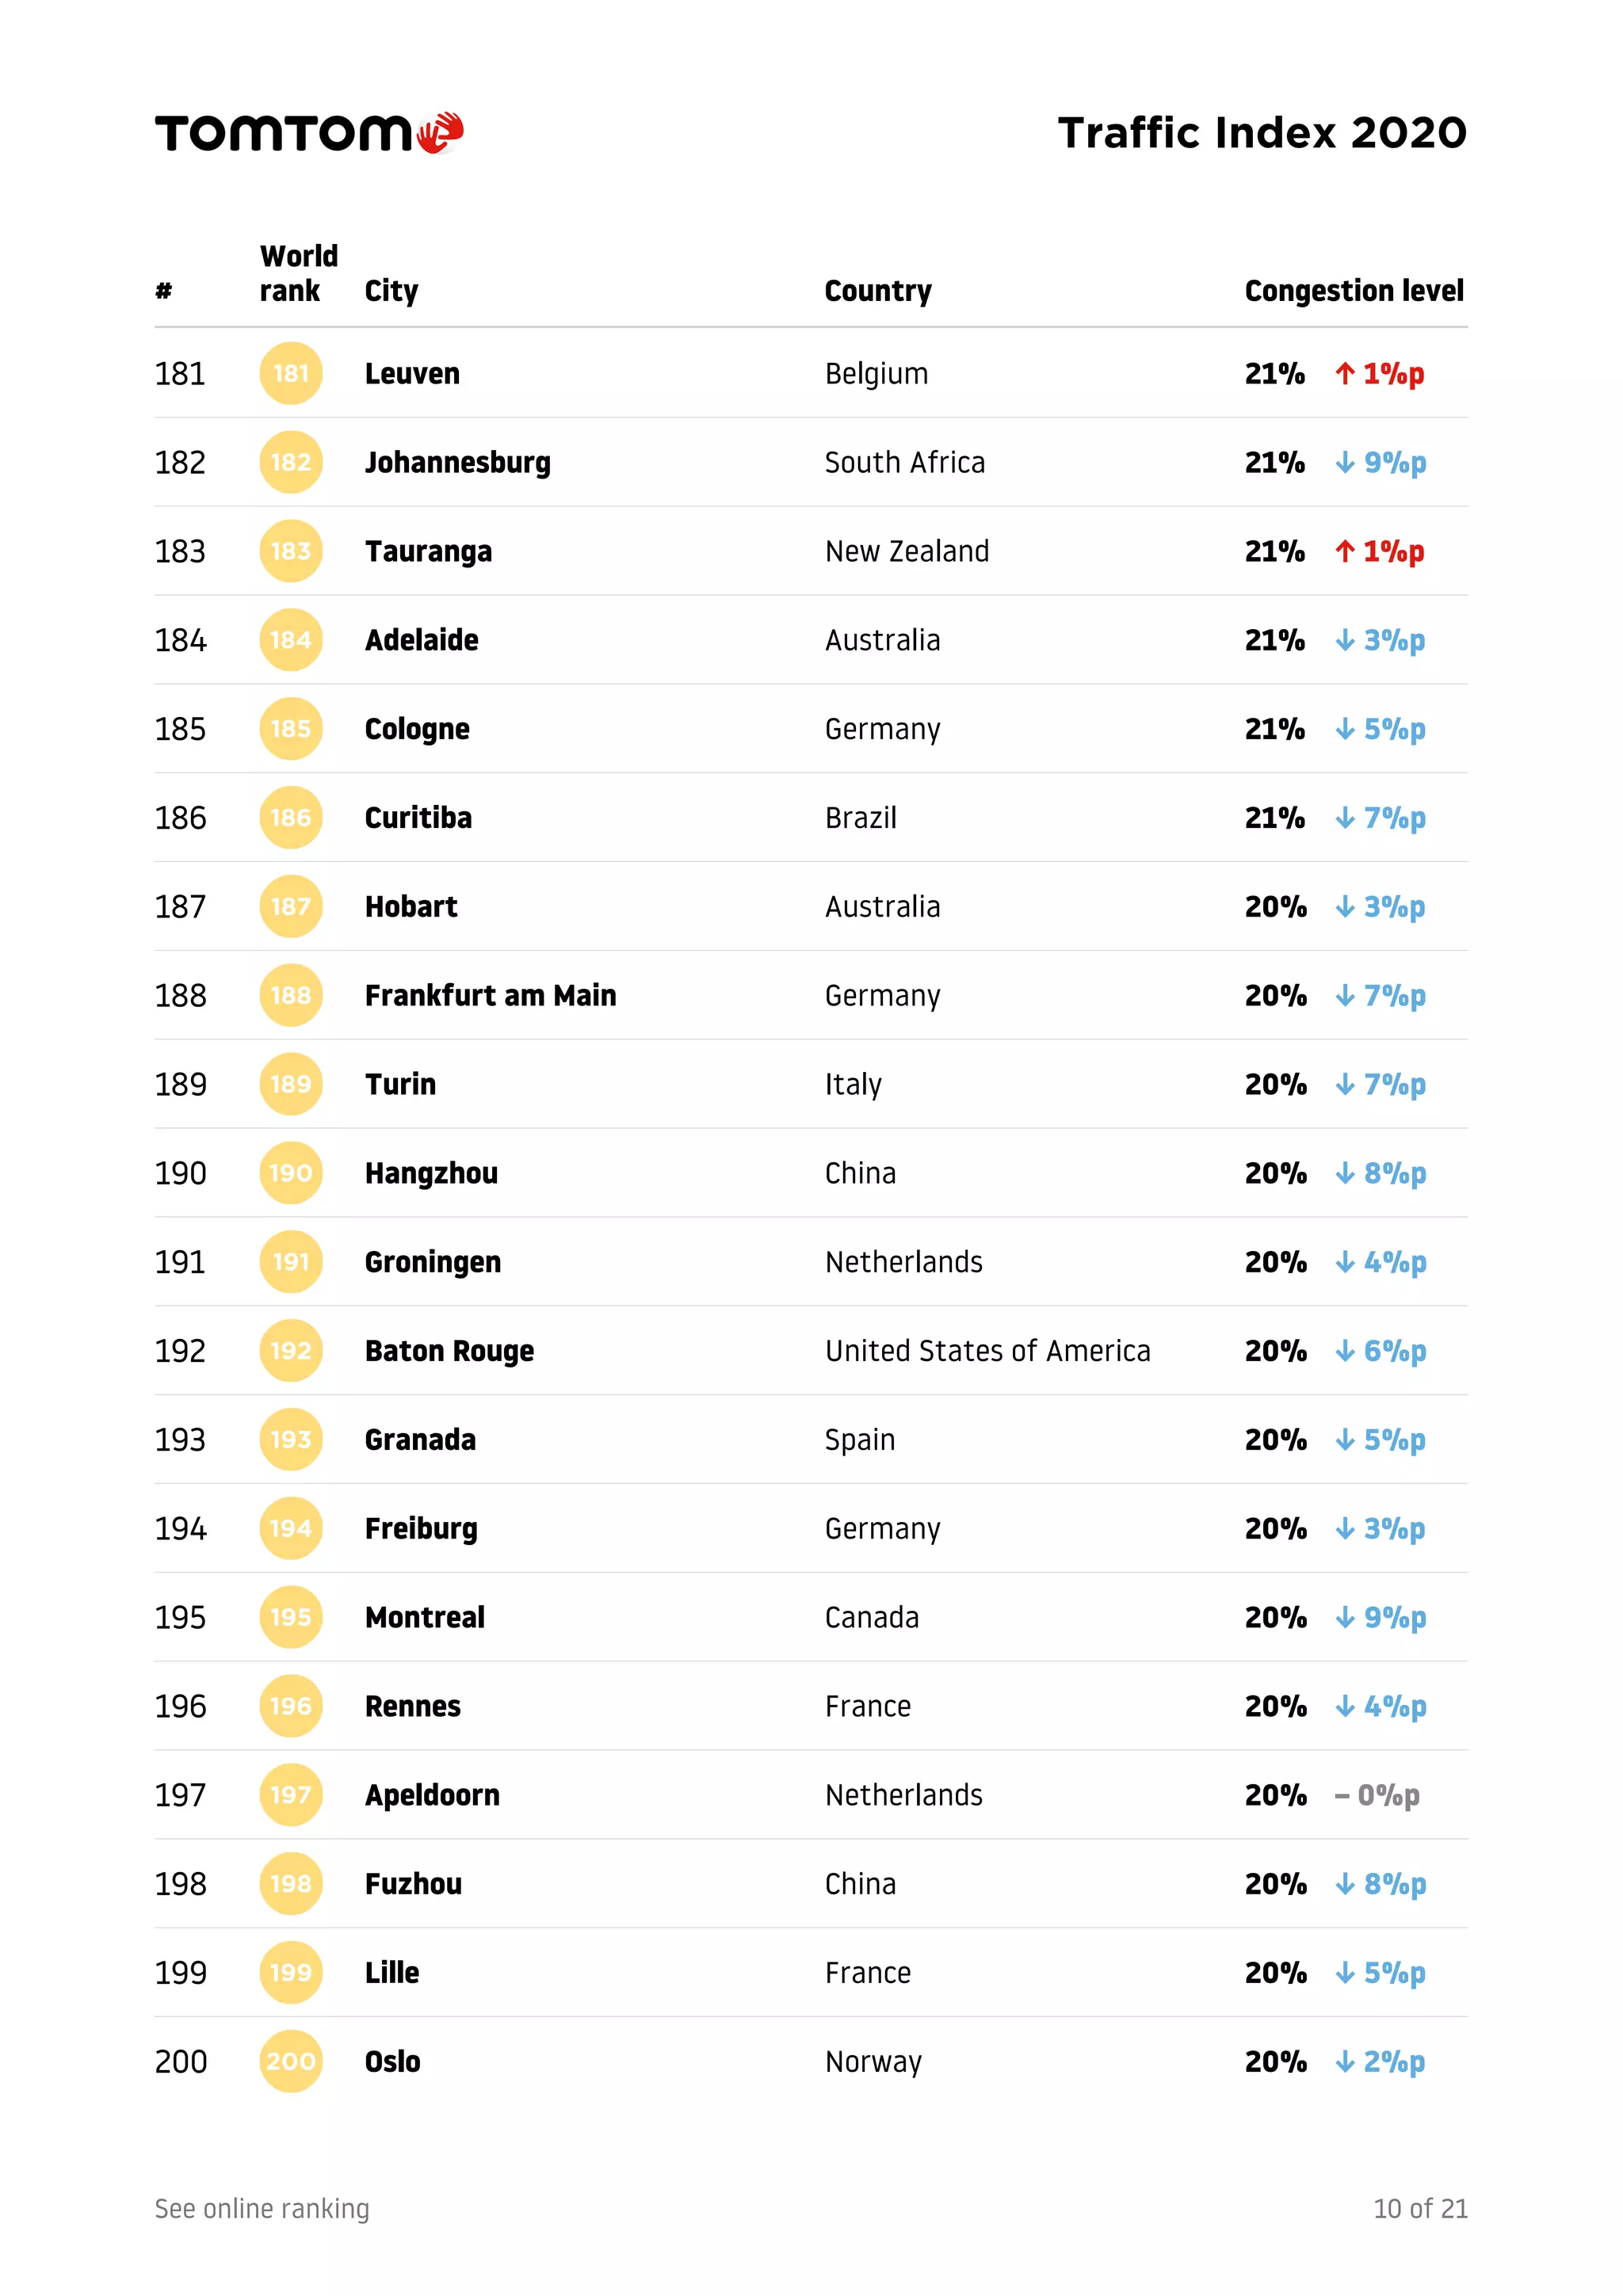
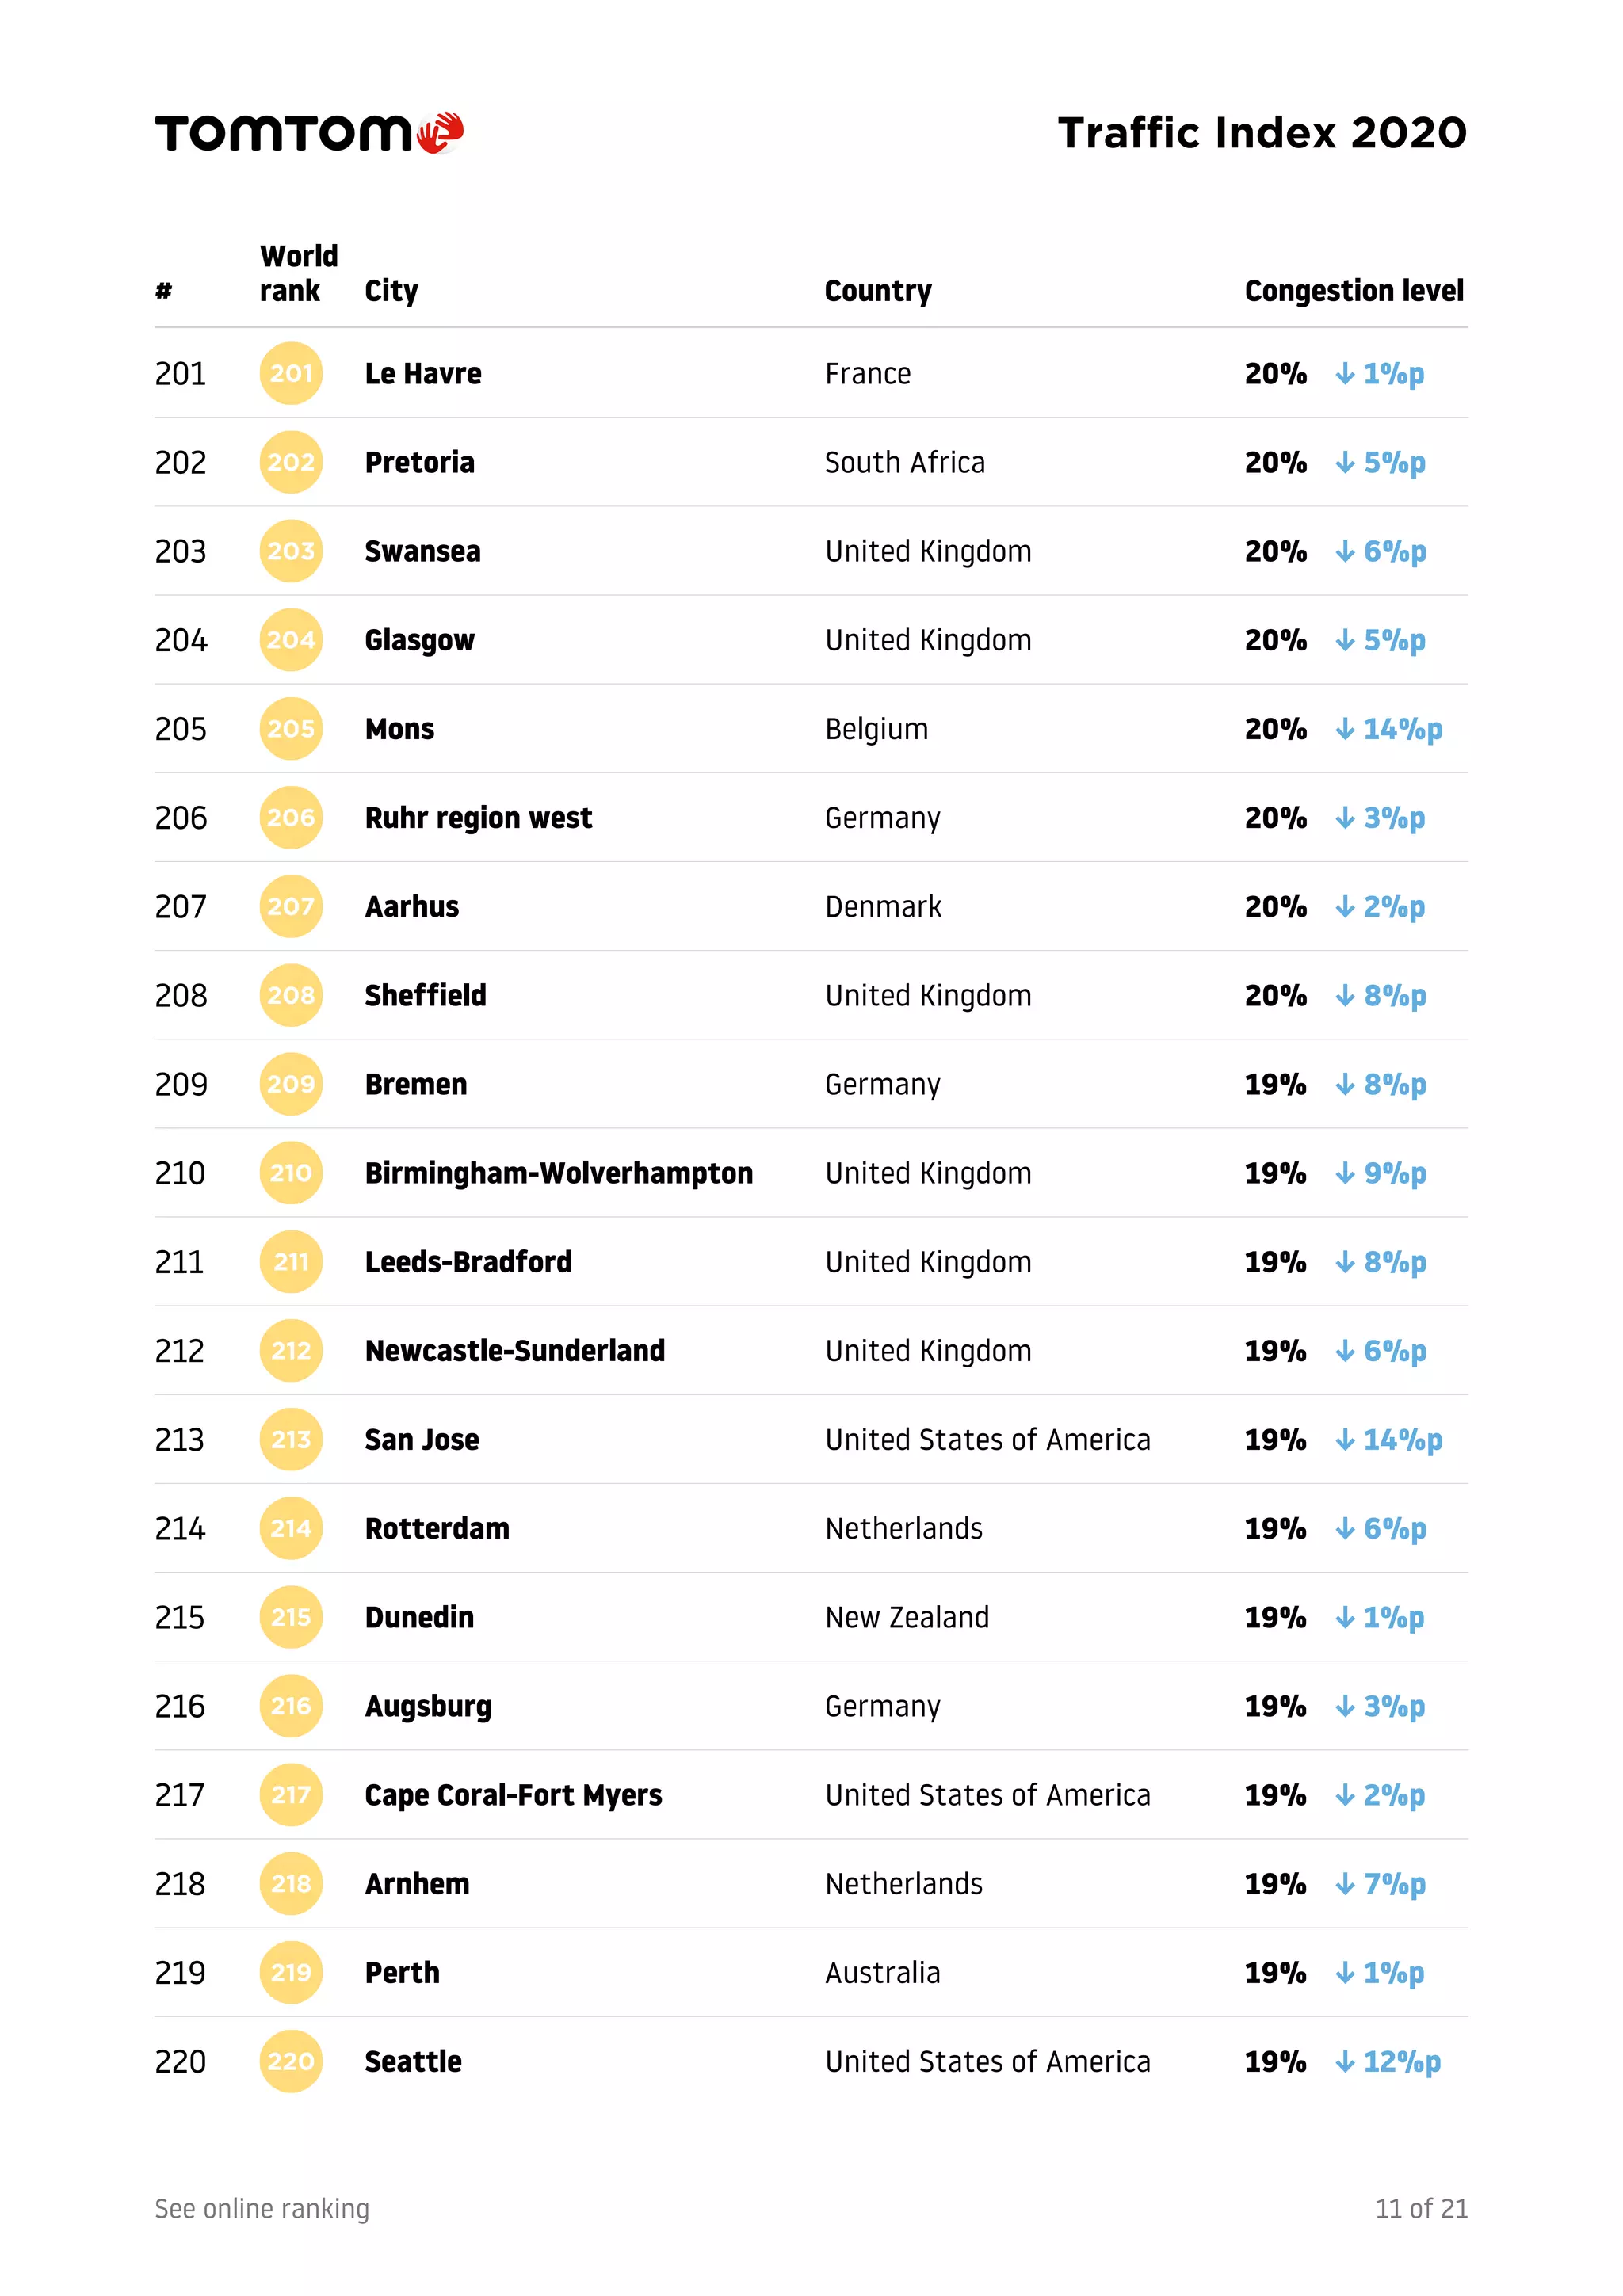
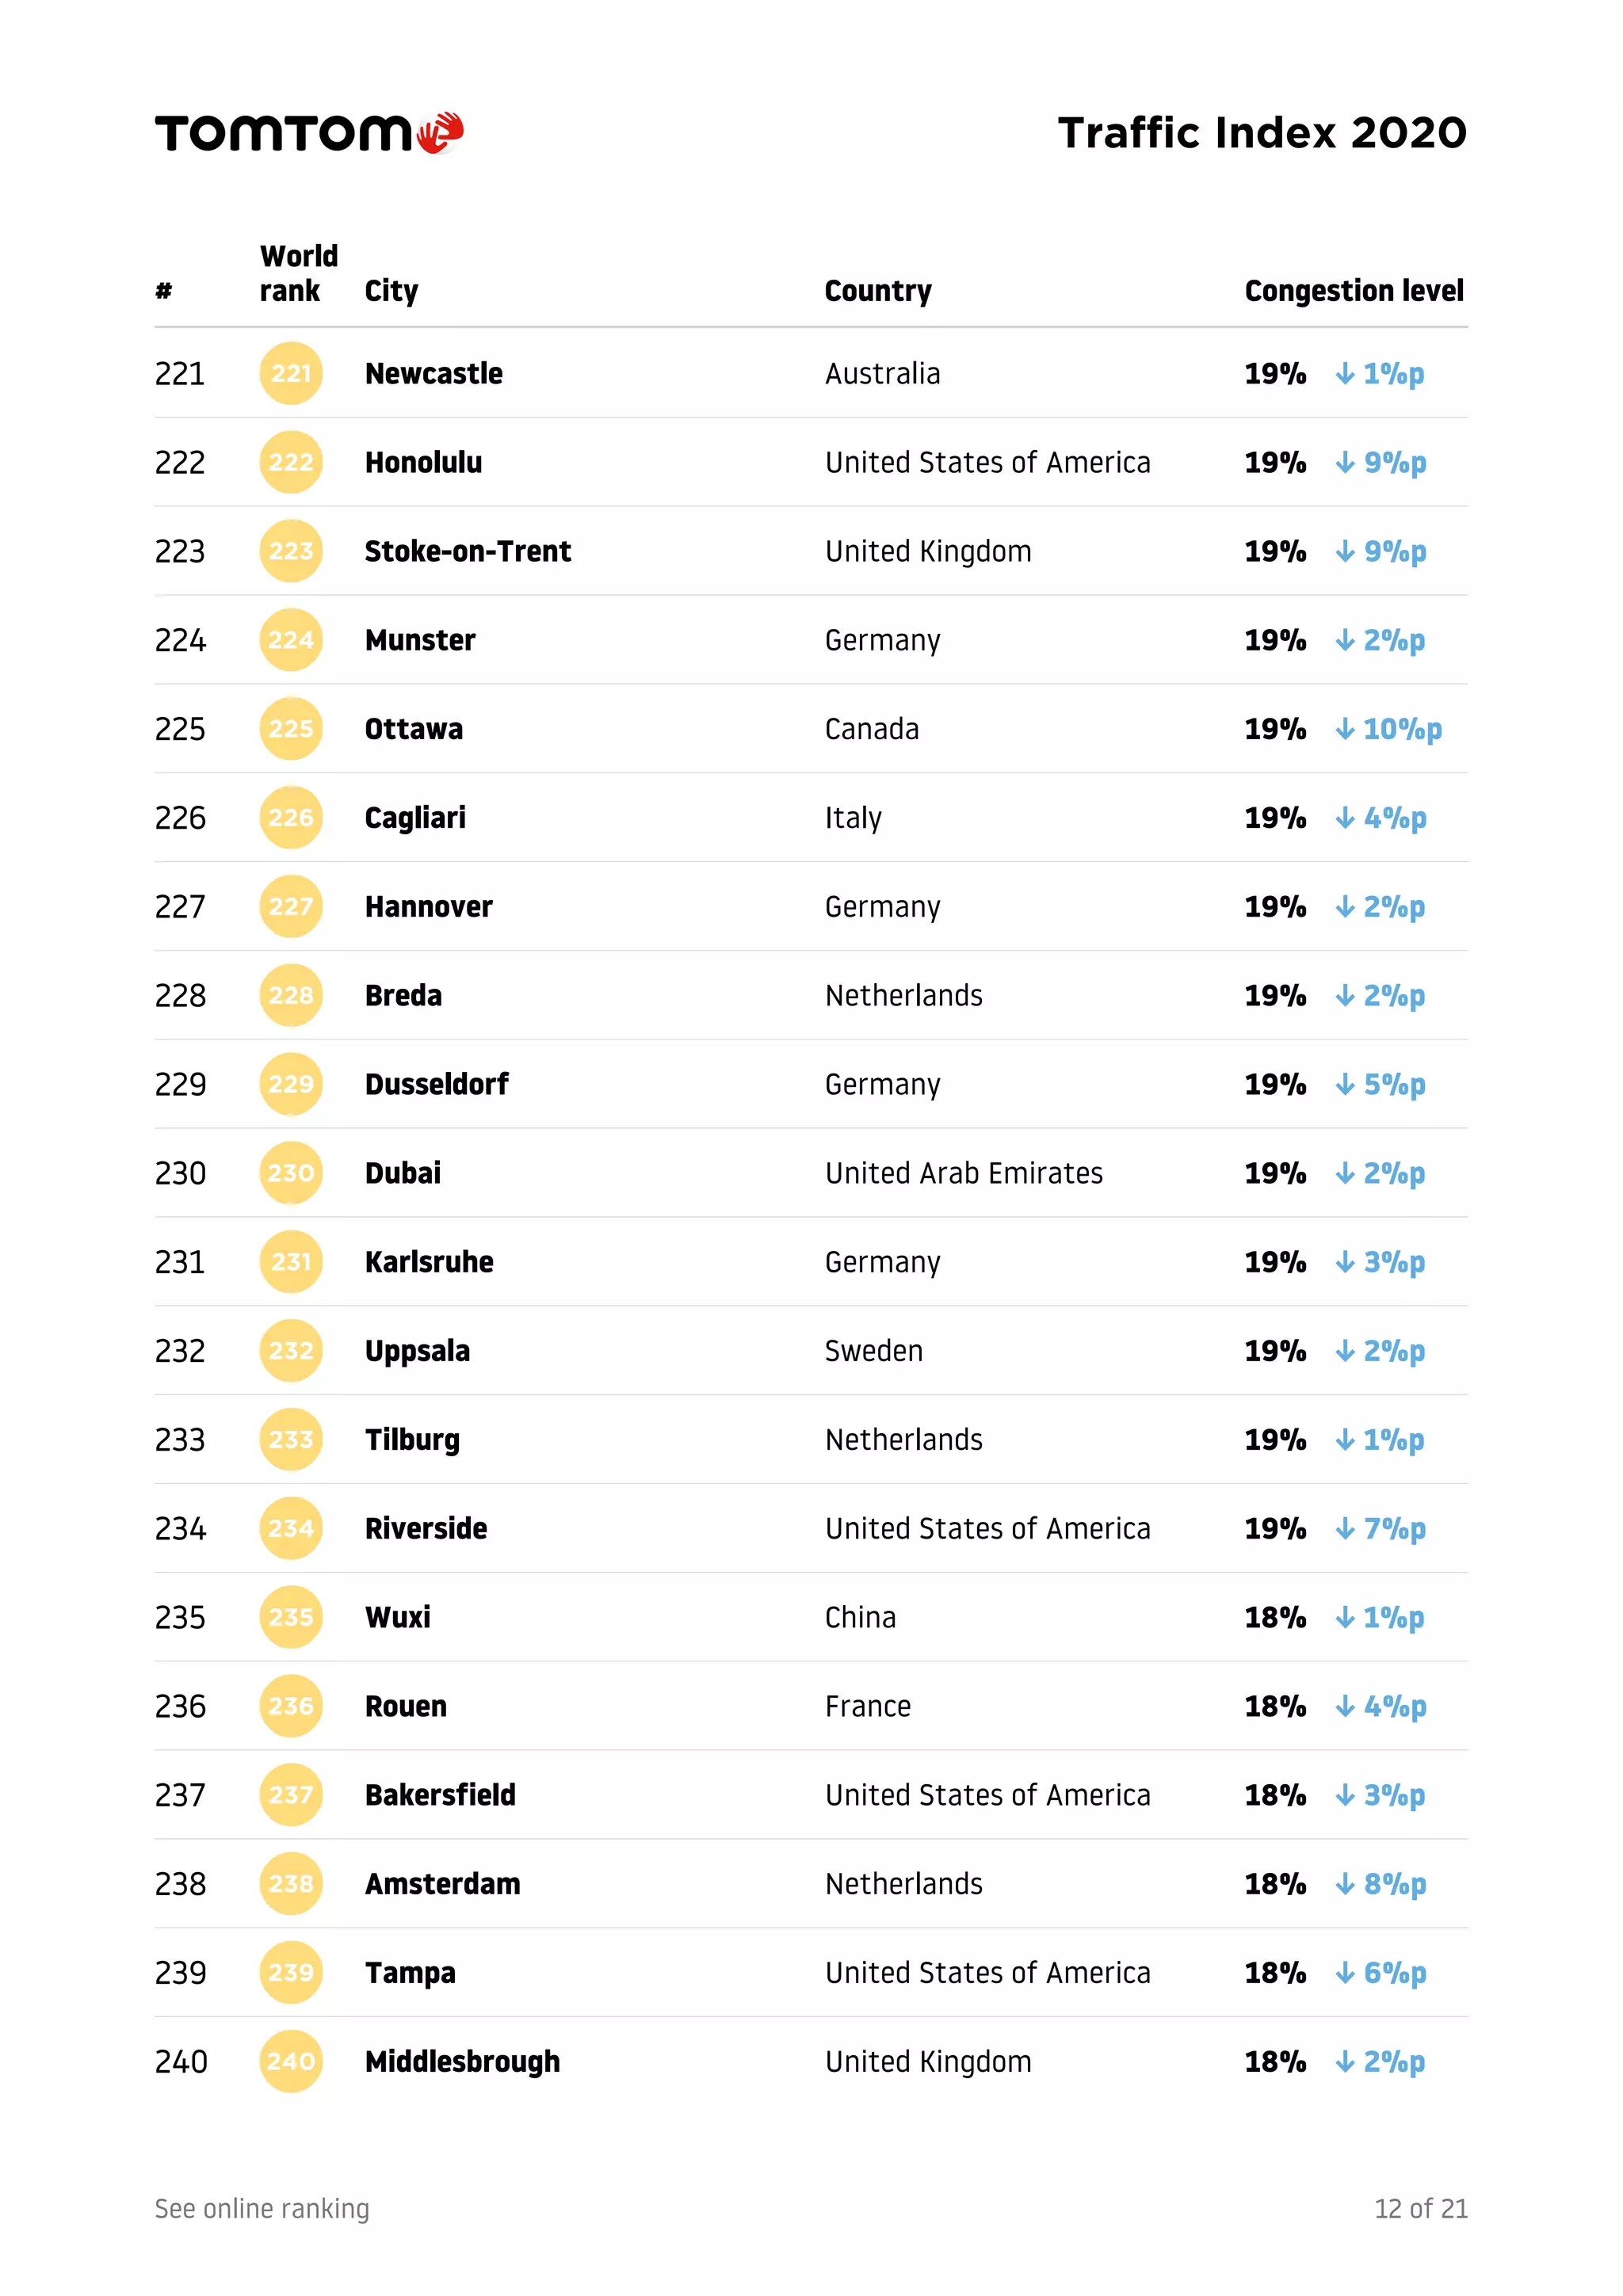
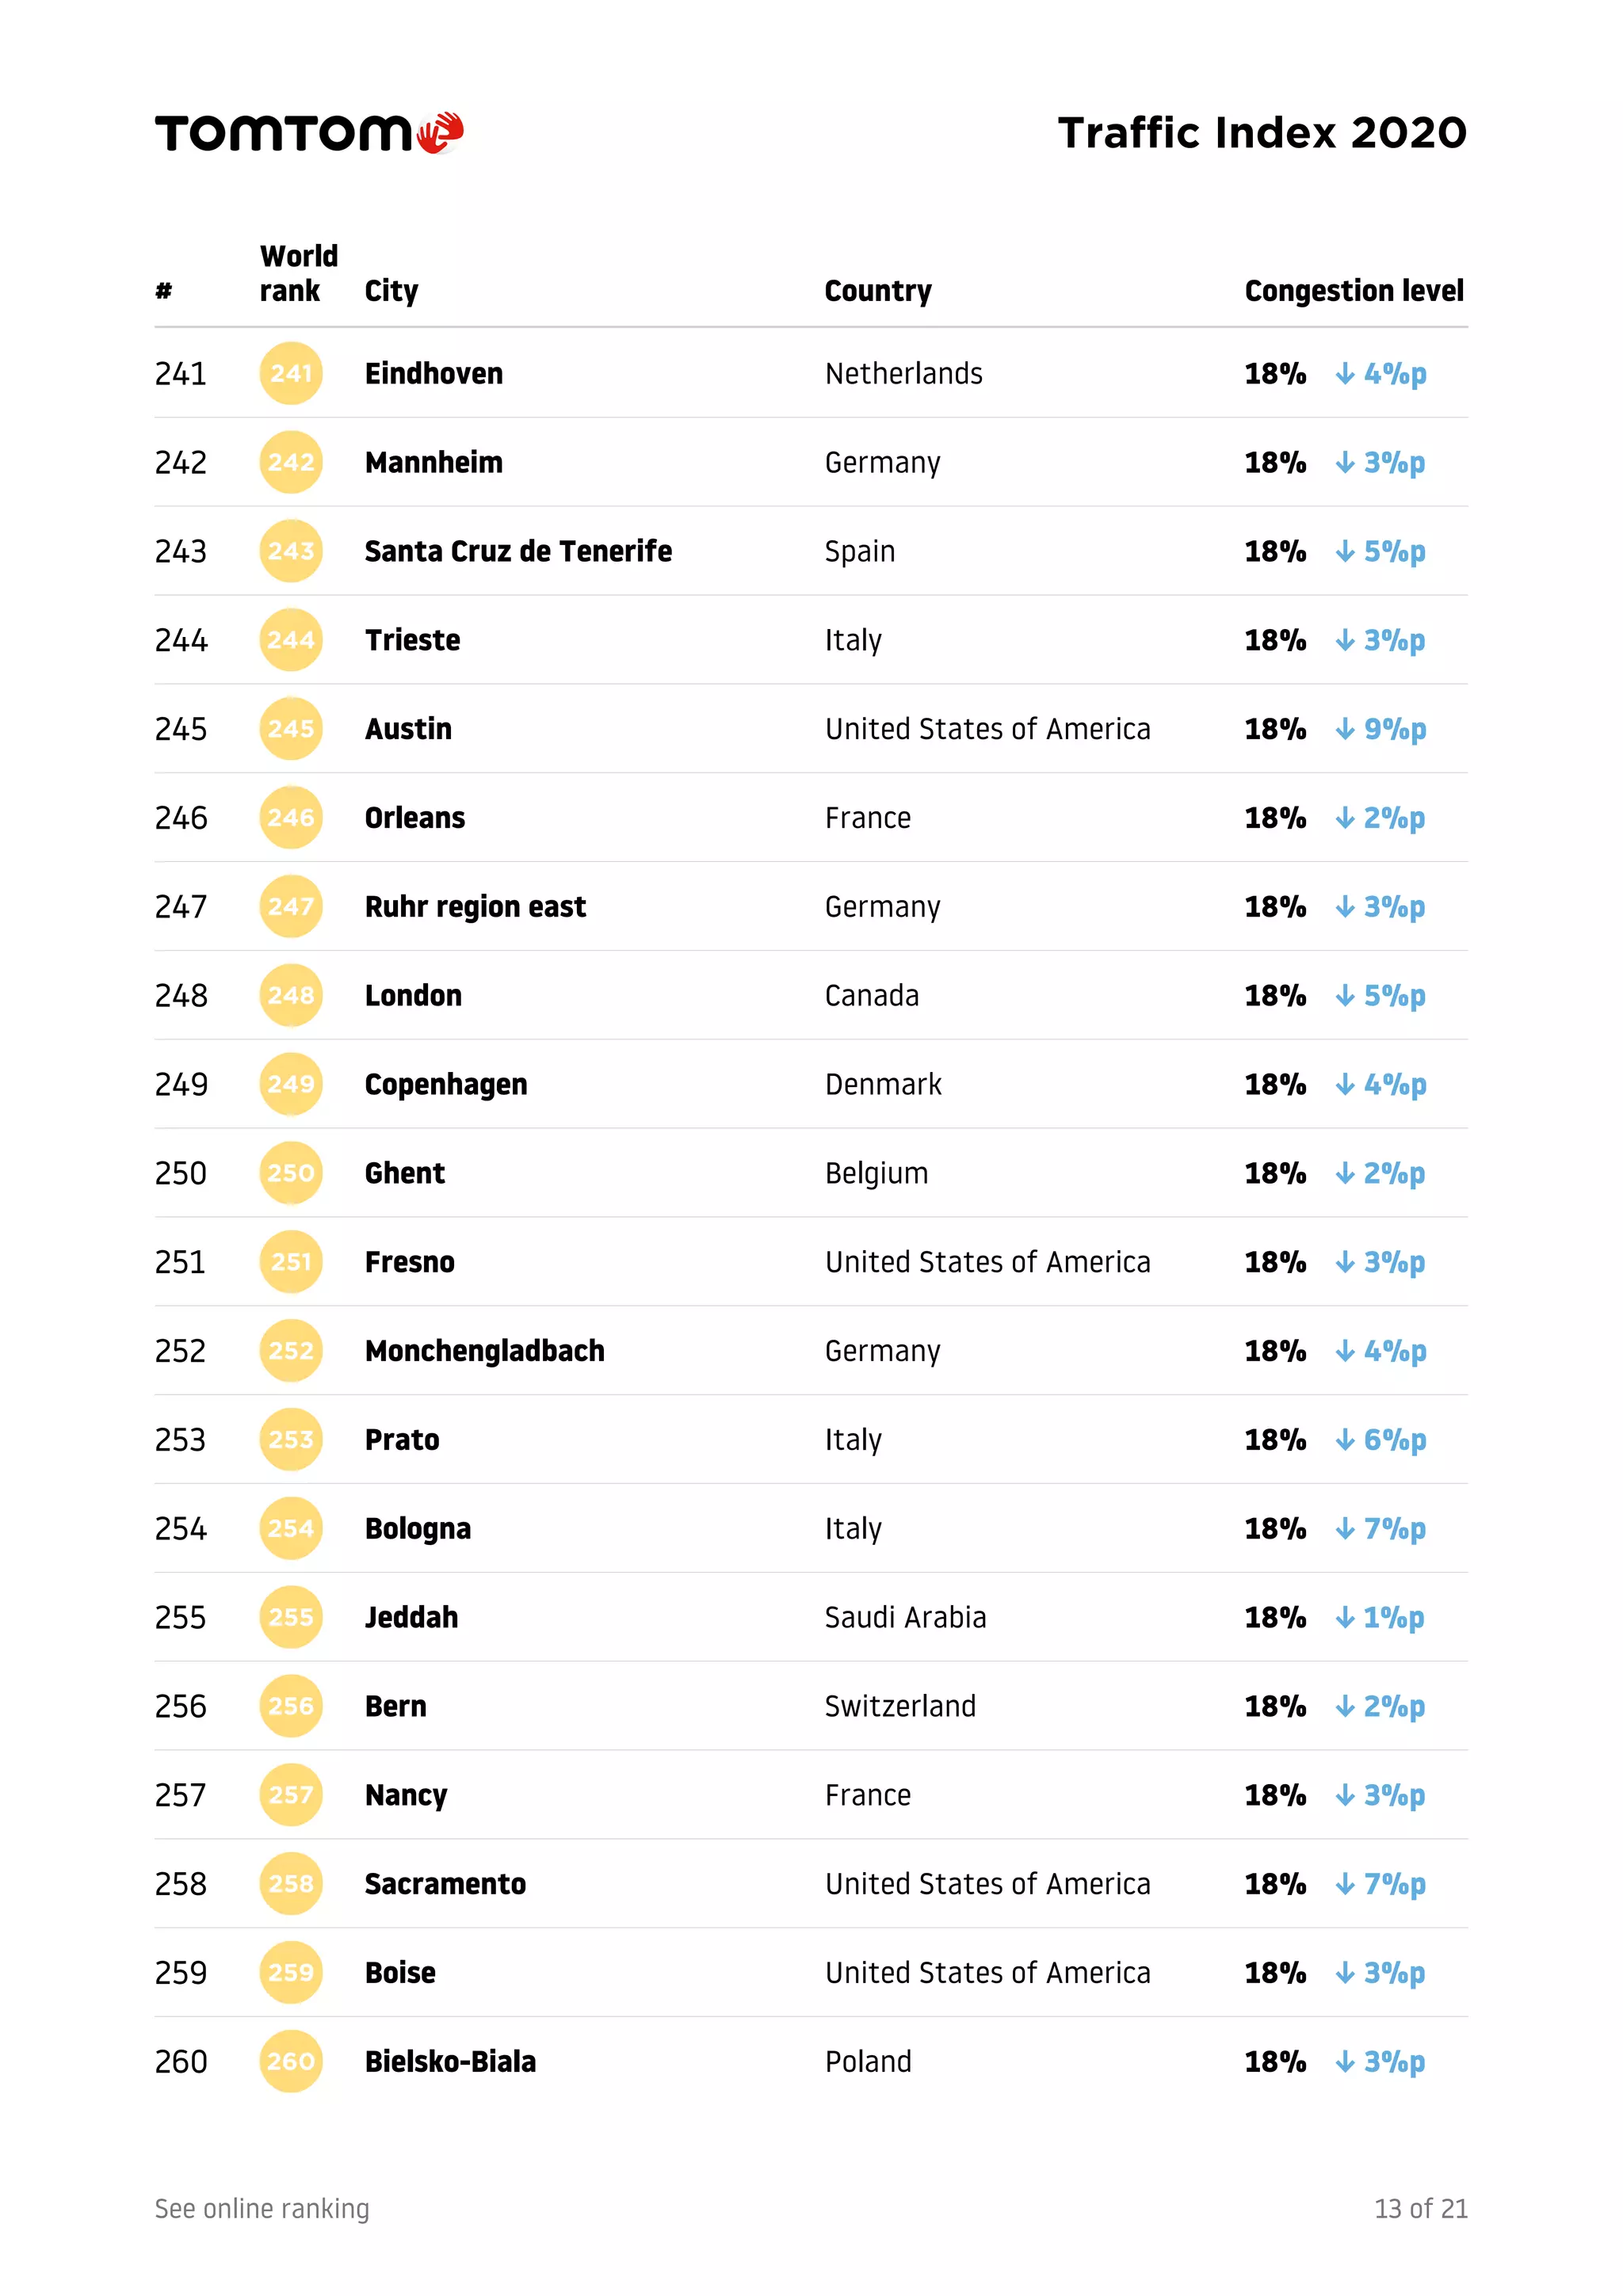
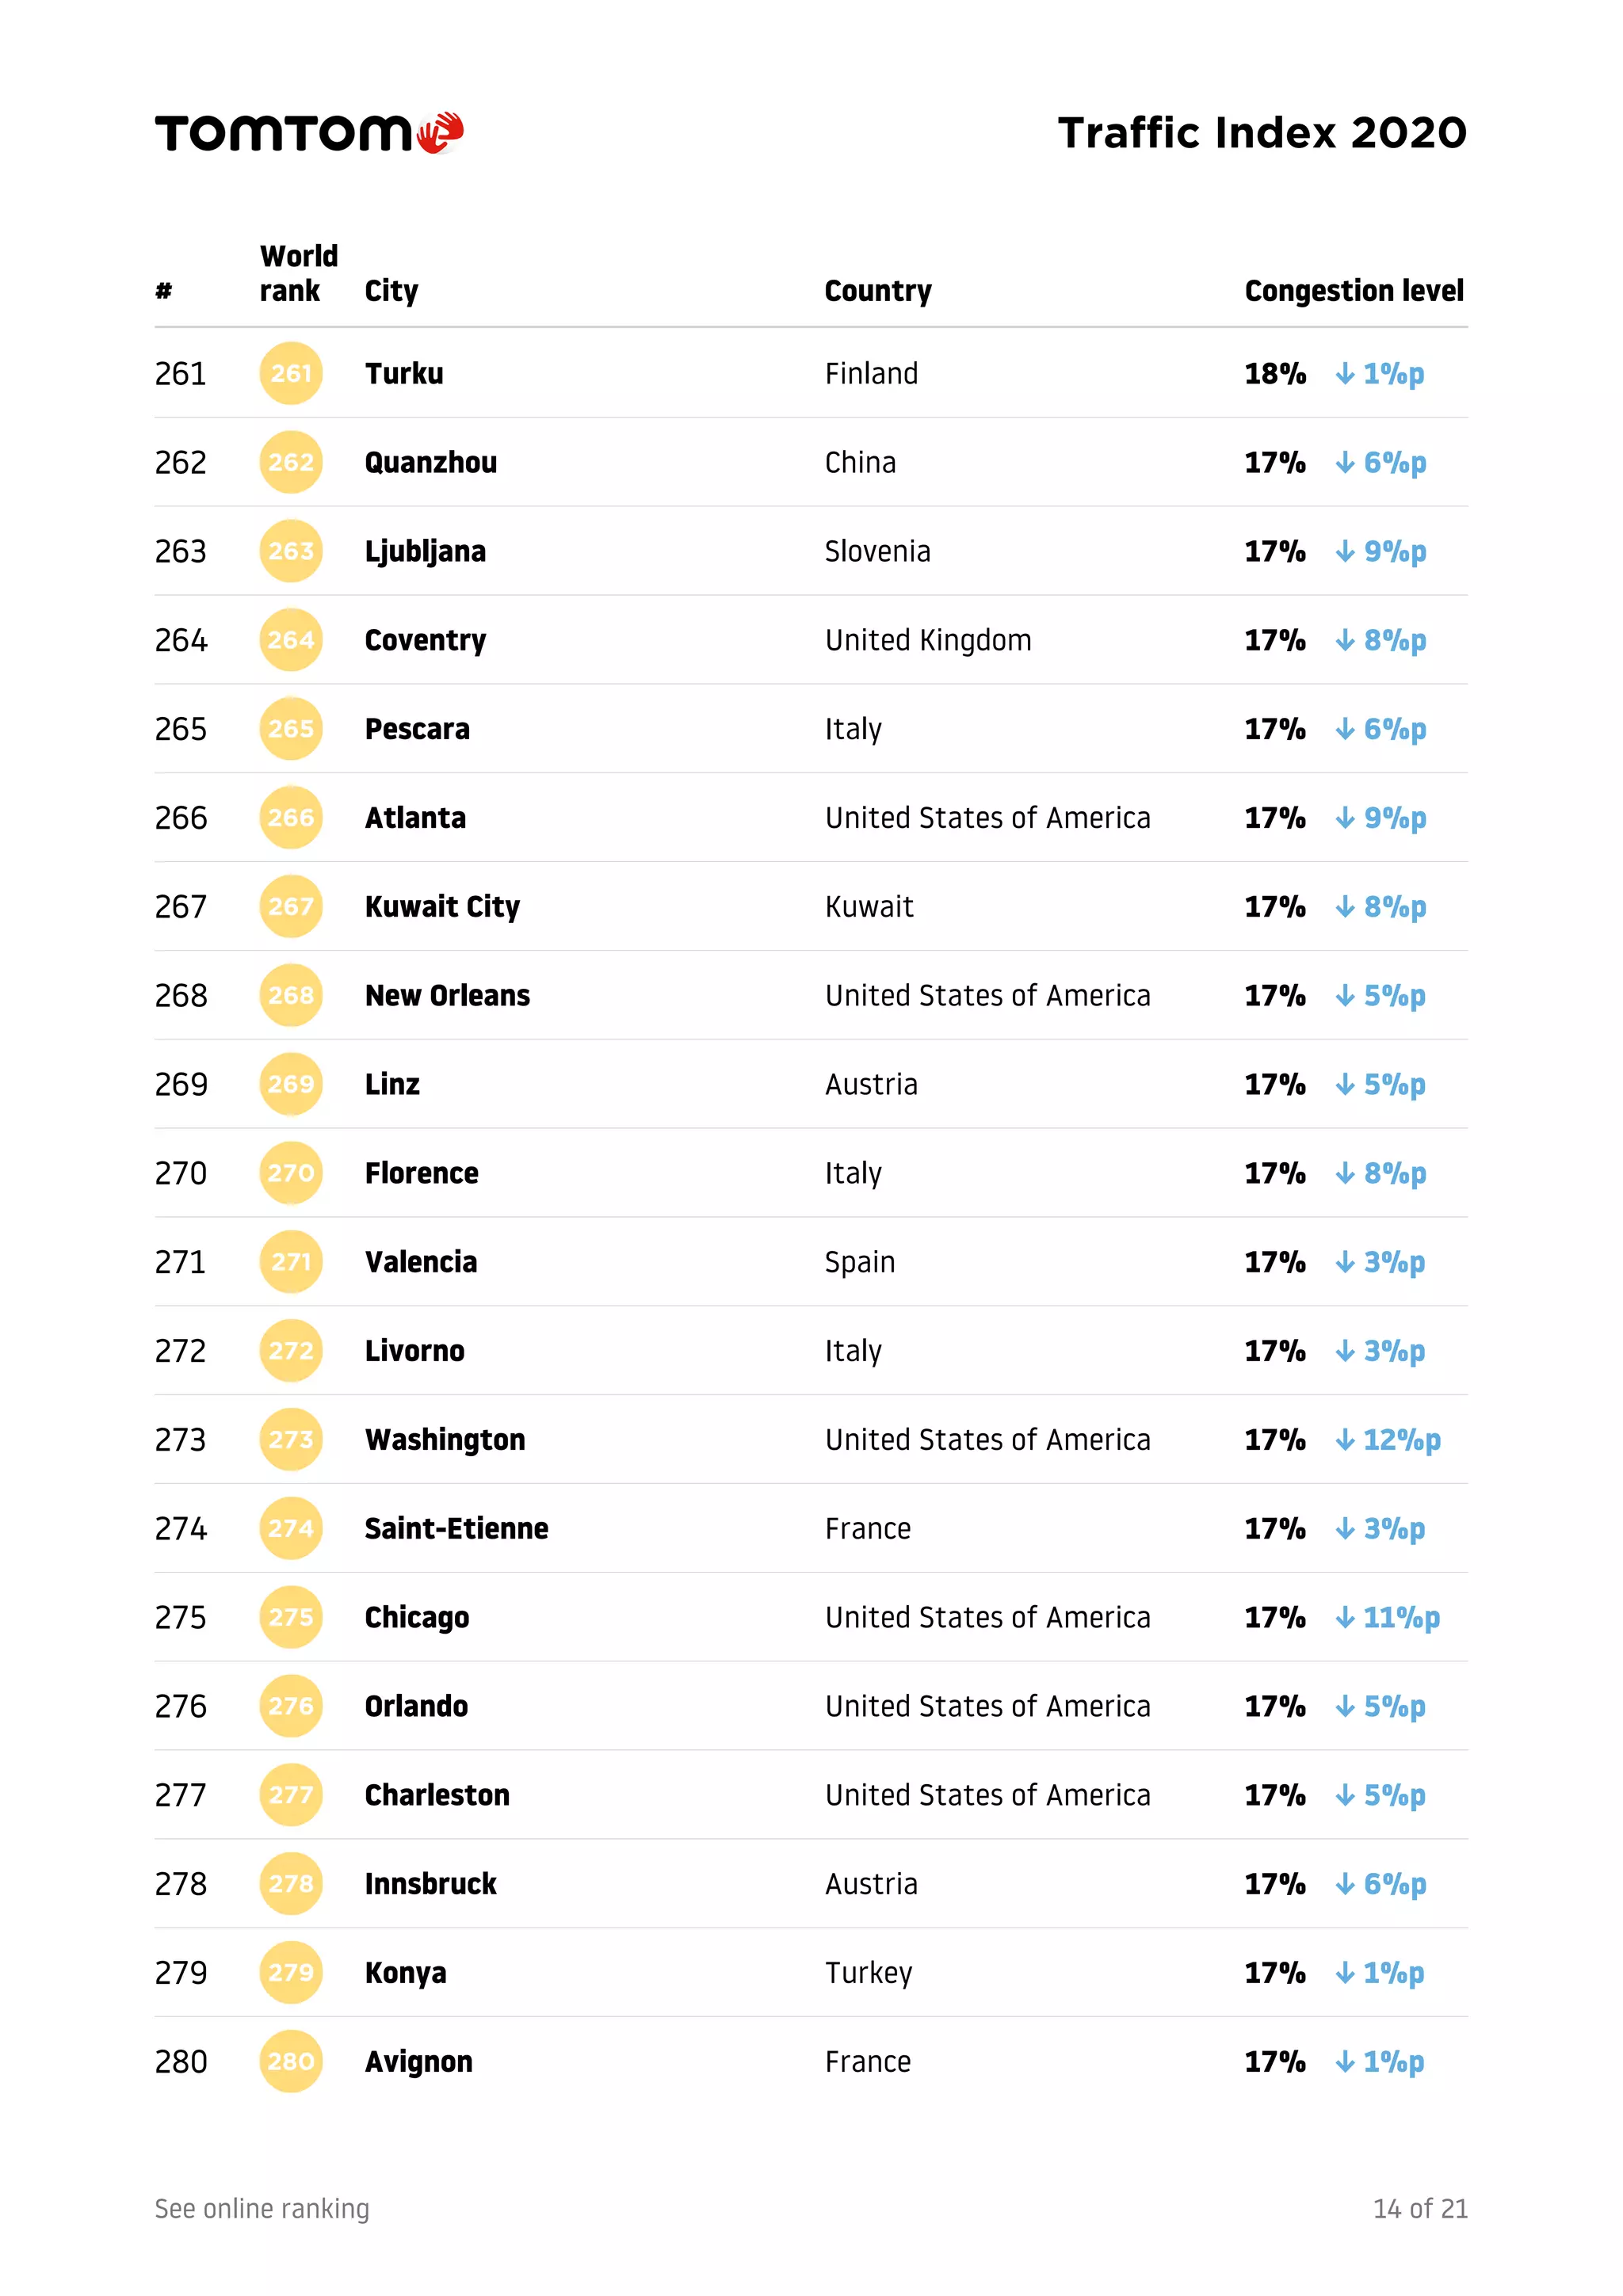
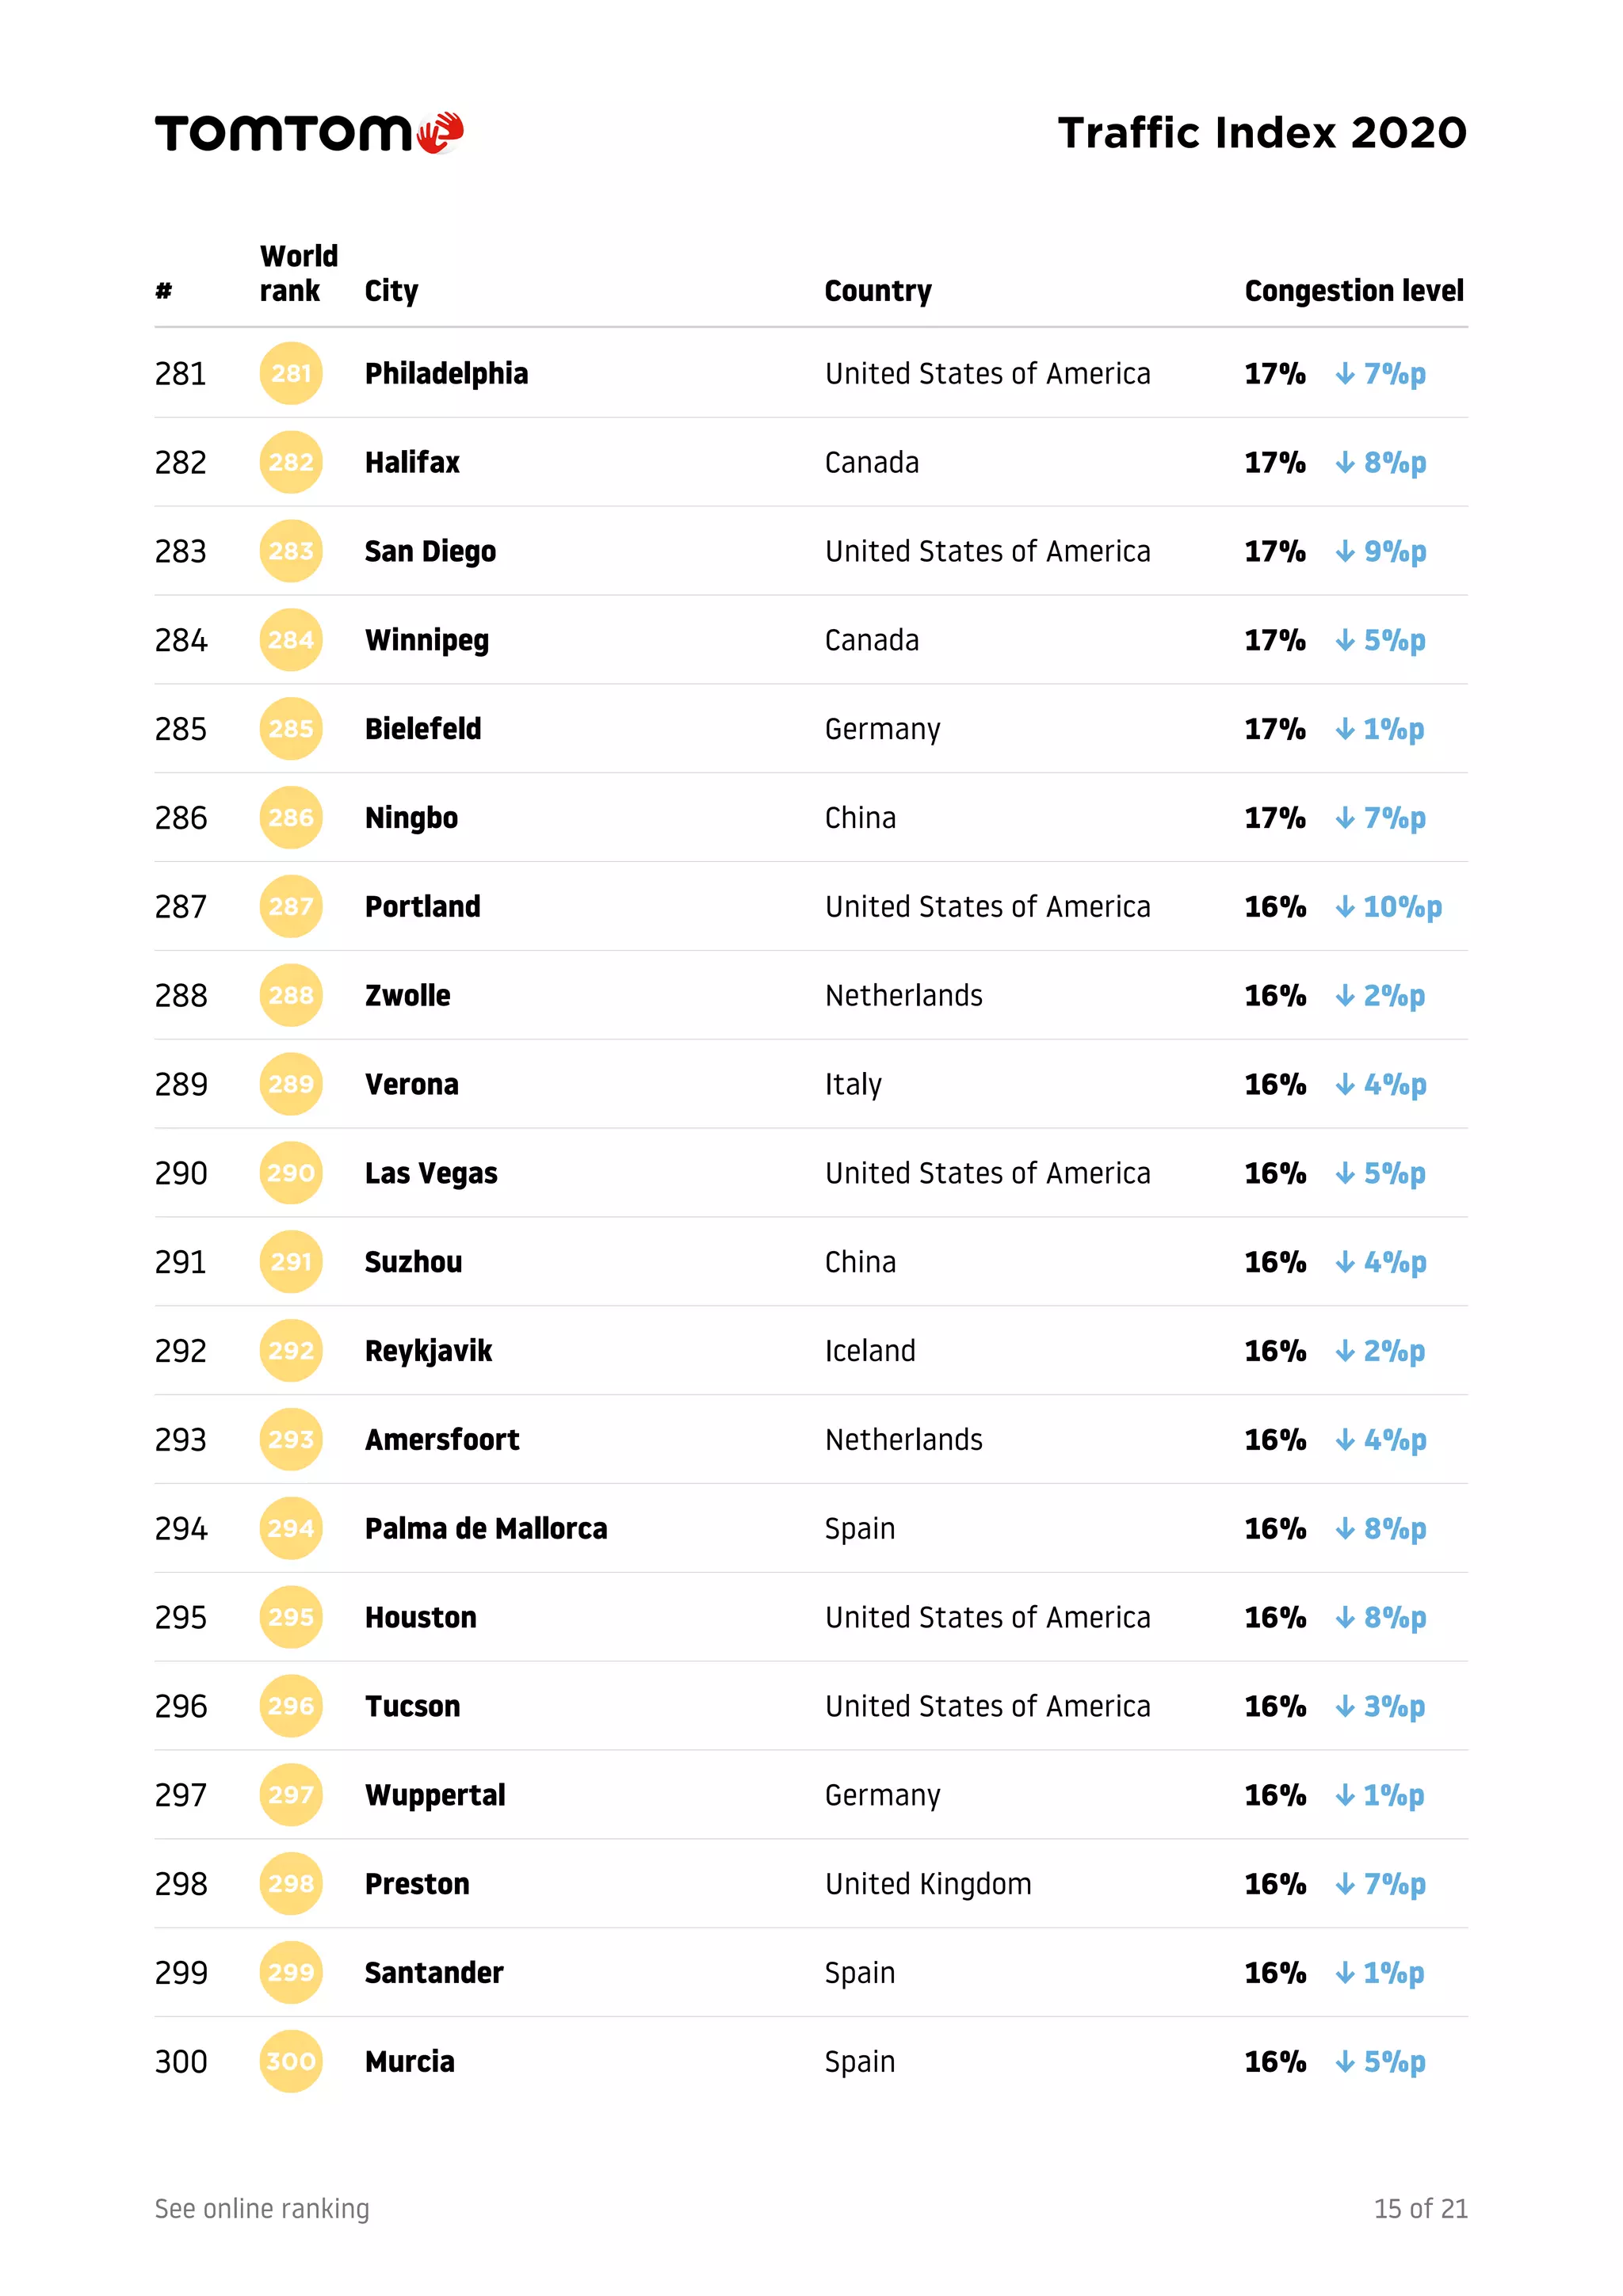
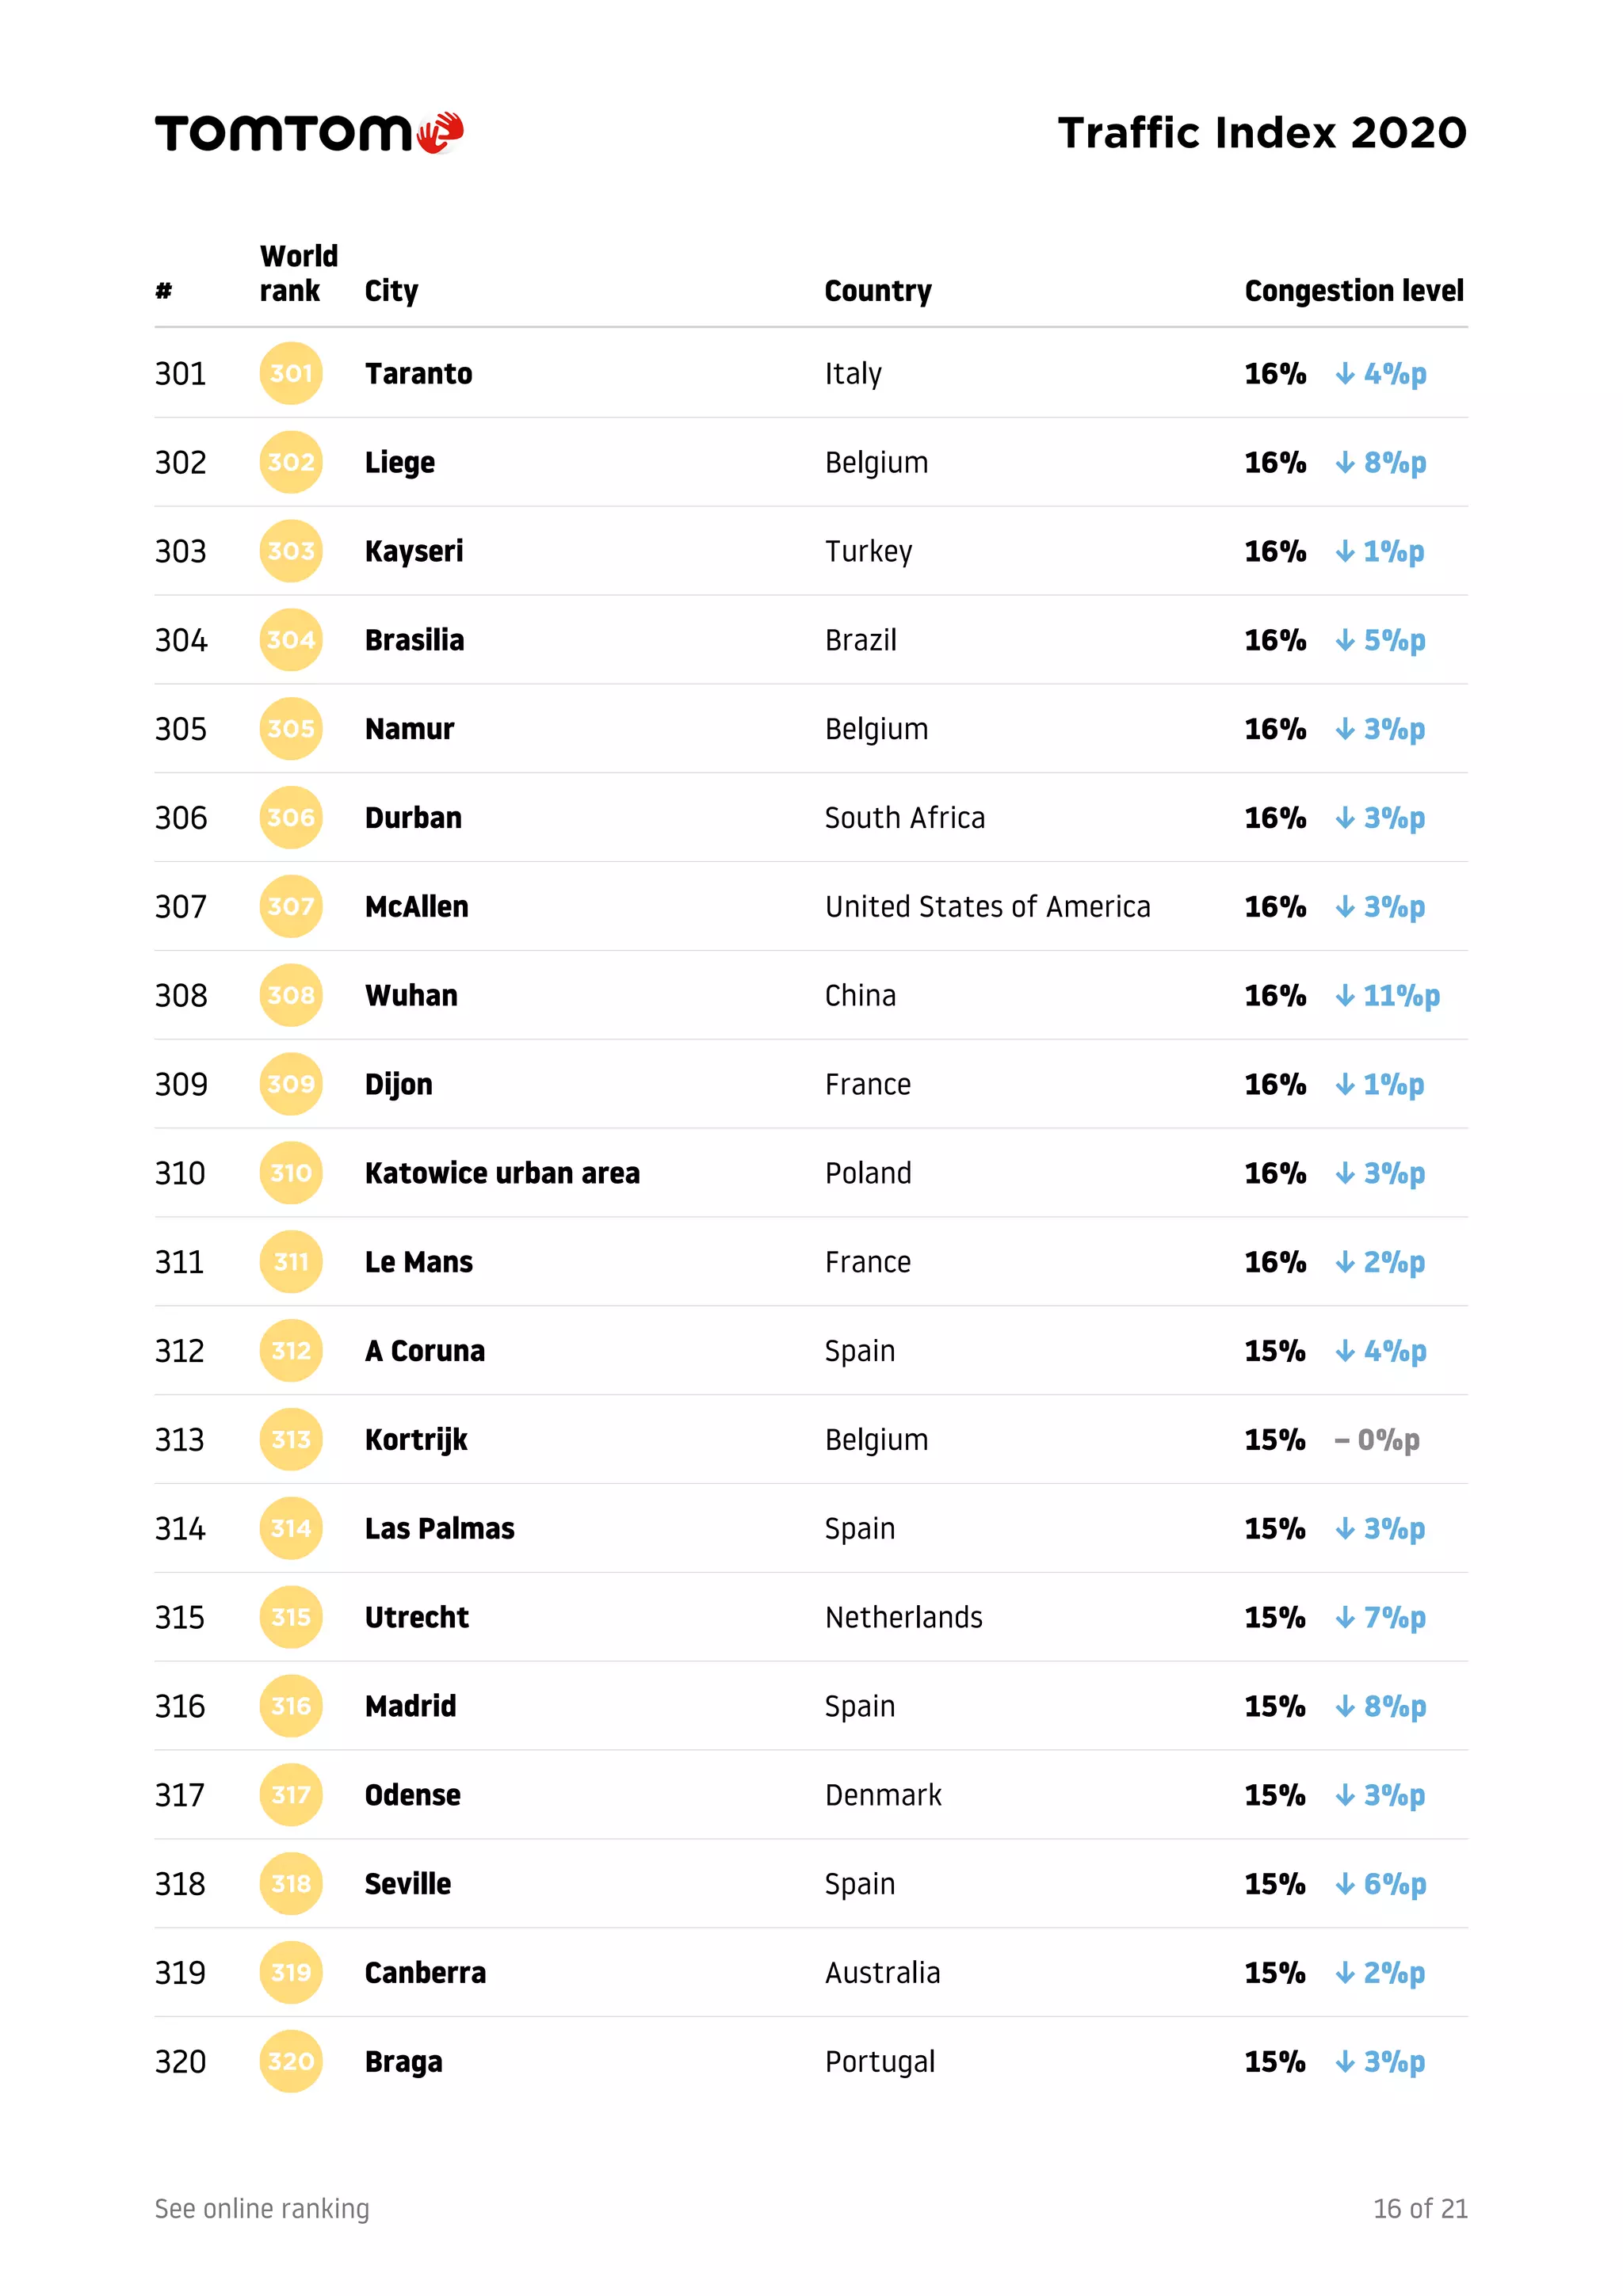
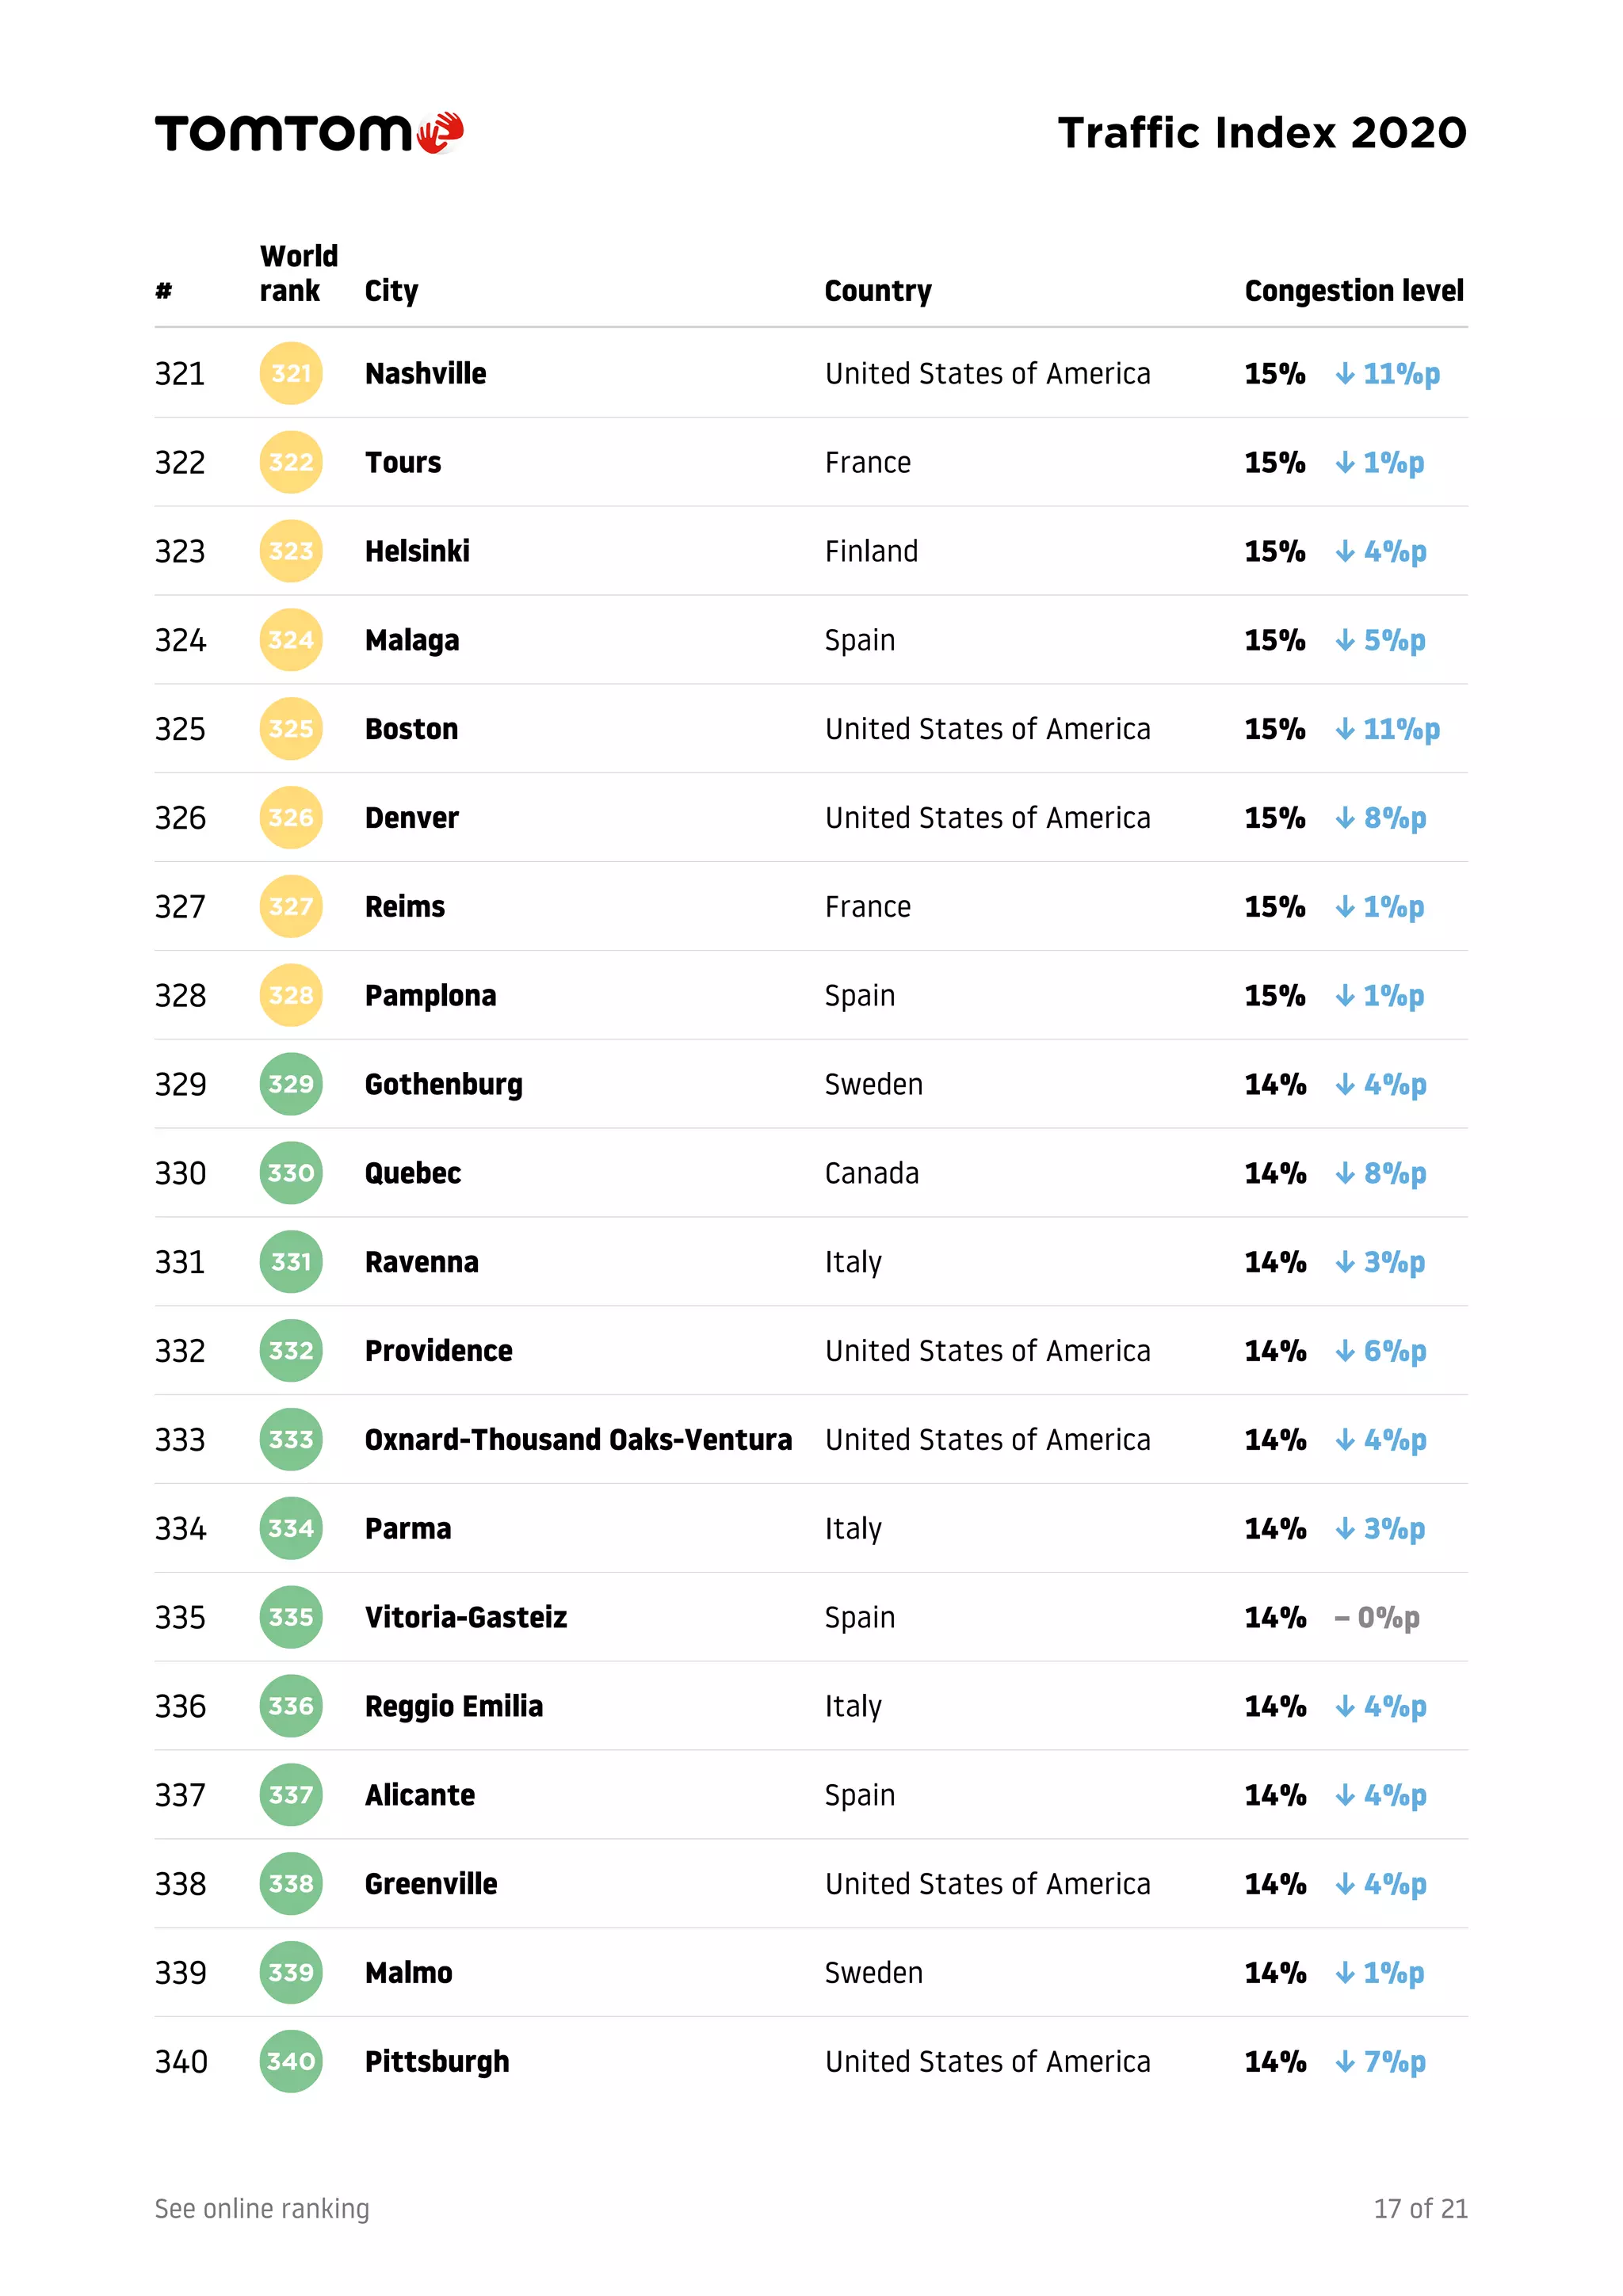
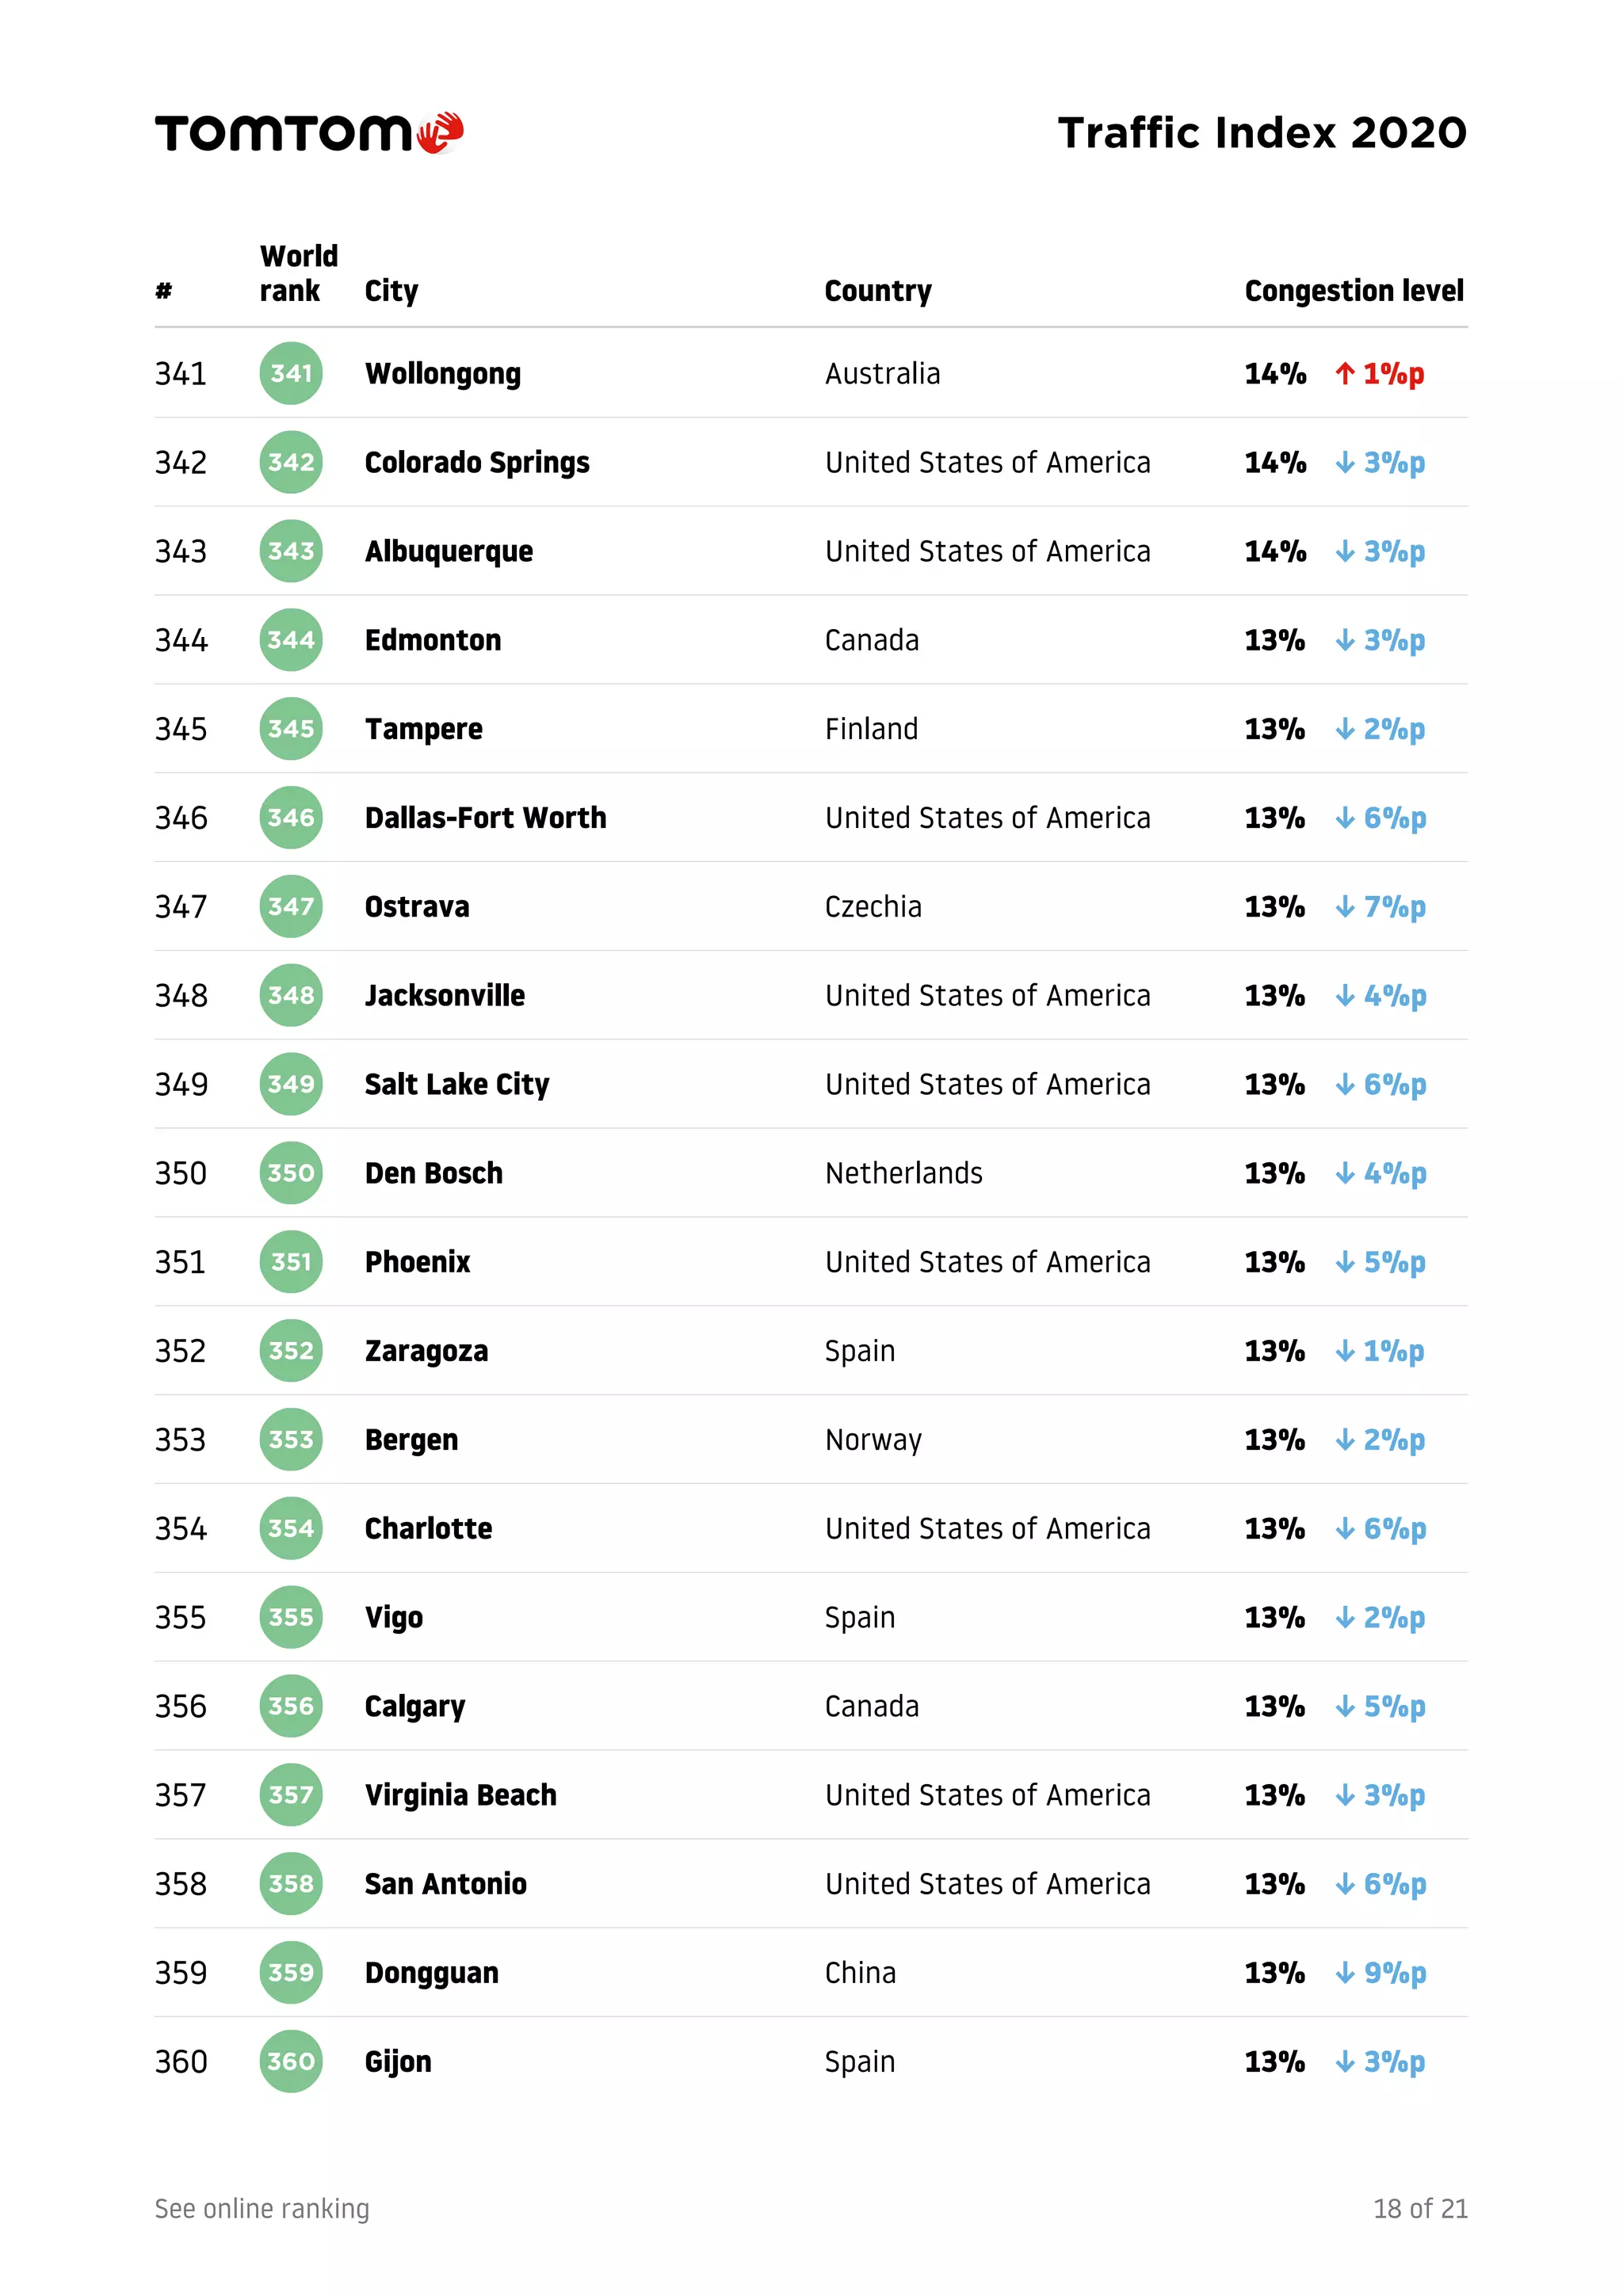
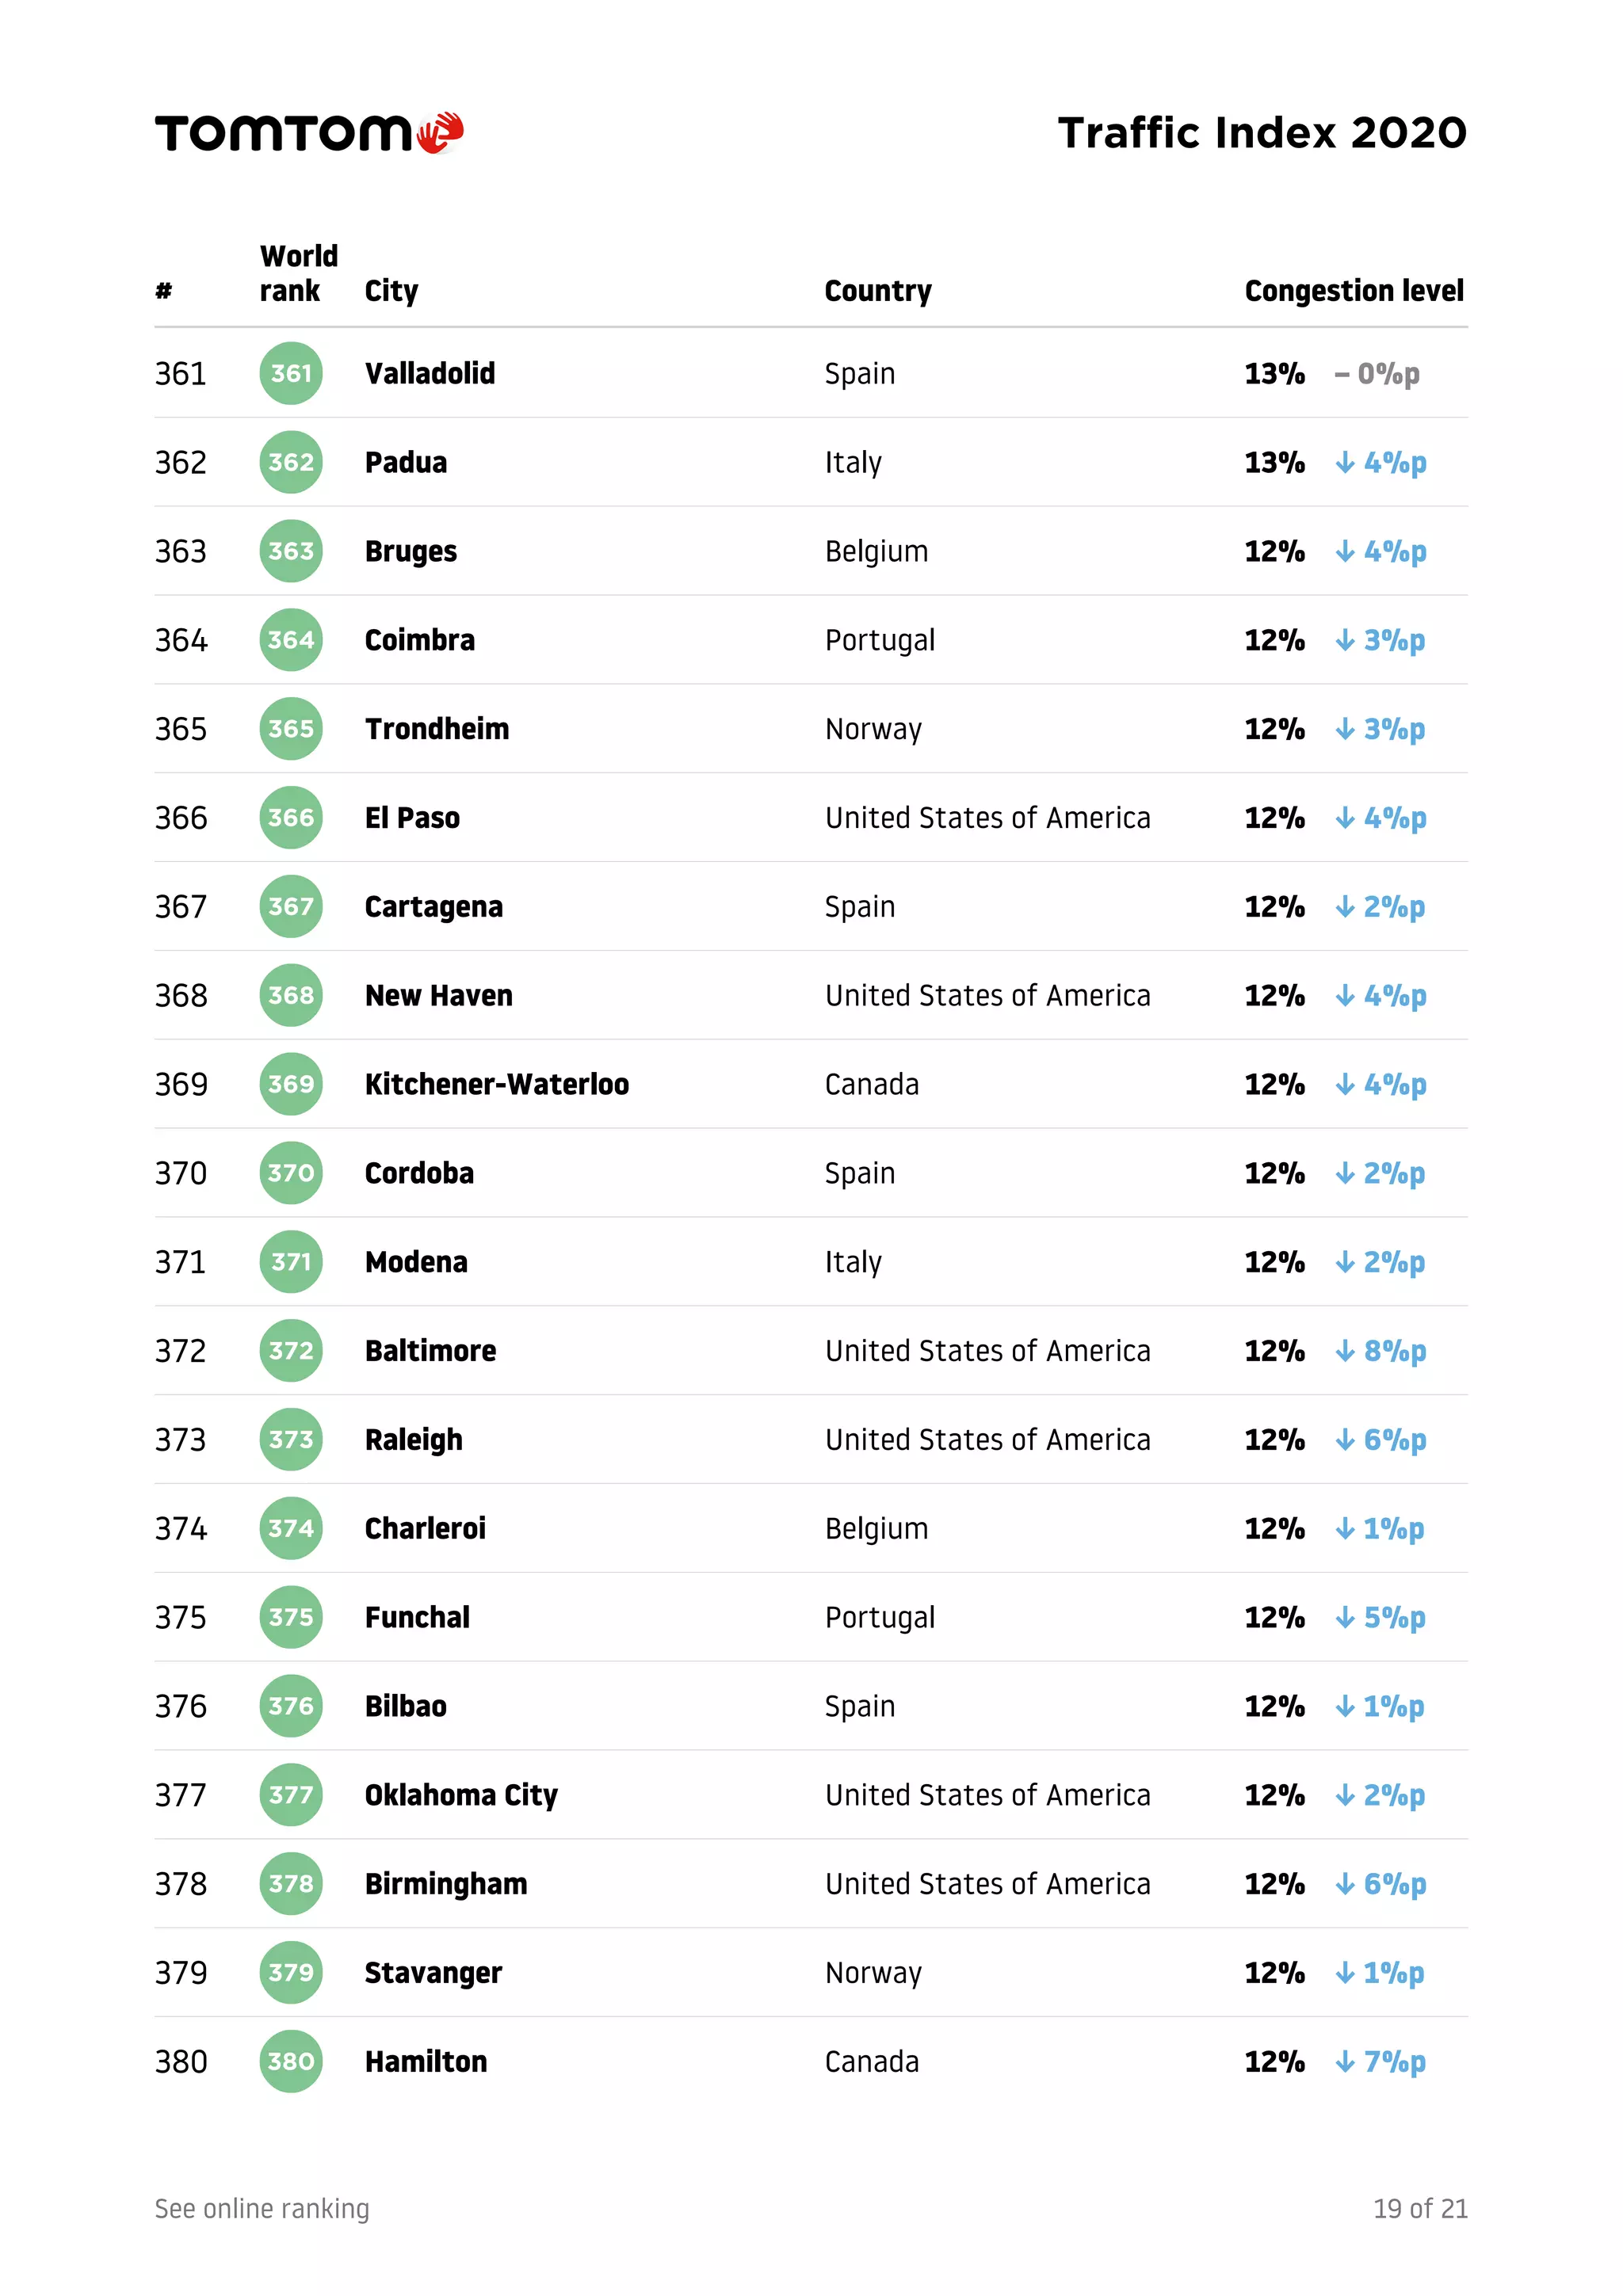
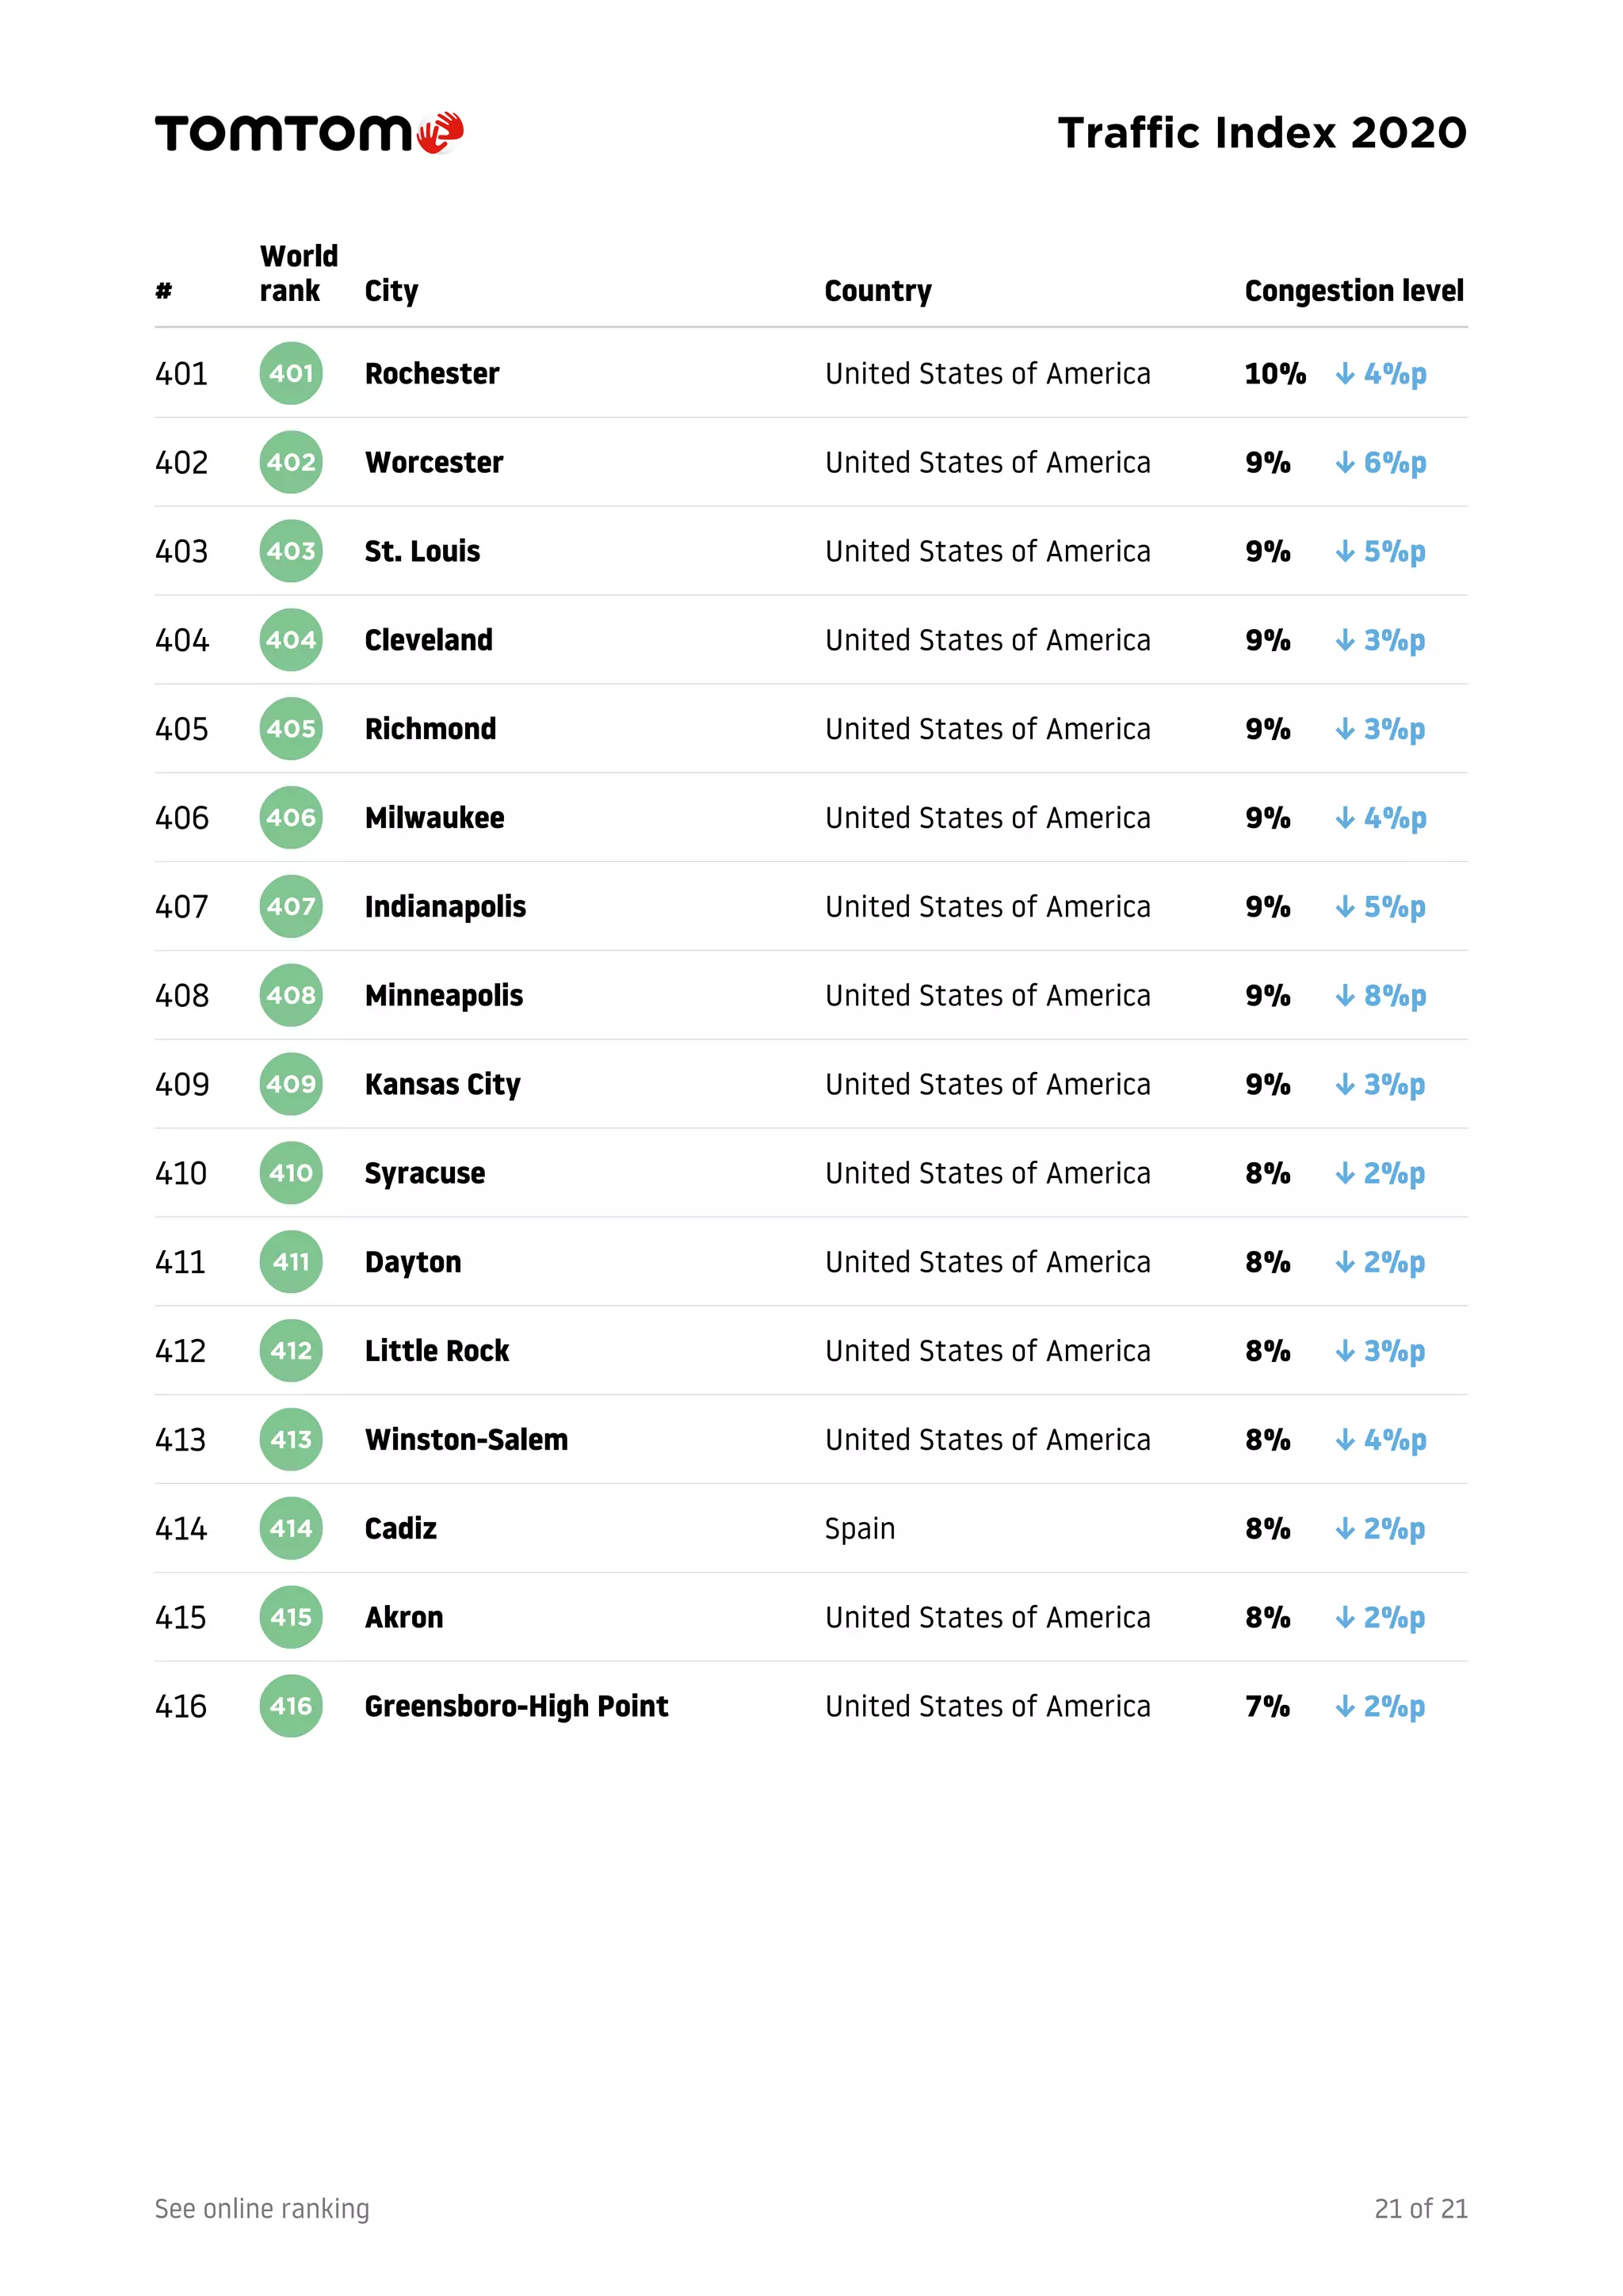
Traffic Index
2020
Created to help you tackle
traffic – as a driver, city
planner, automaker or policy
maker – the TomTom Traffic
Index provides detailed
insights on live and historic
road congestion levels in cities
around the world.
You are permitted to use the contents of this document in online,
offline and social media and other publication channels for
non-commercial purposes with clear reference to TomTom
International BV as its main source. You are not permitted to
modify, compile, adapt or use any part of this document in any way
for commercial purposes without a written agreement from
TomTom International BV.
Traffic Index results
2020
Downloaded from: https://www.tomtom.com/traffic-index/ranking/
416 results FULL
All countries (57)
Argentina, Australia, Austria, Belgium, Brazil, Bulgaria, Canada, Chile, China, Colombia,
Czechia, Denmark, Egypt, Estonia, Finland, France, Germany, Greece, Hong Kong, Hungary,
Iceland, India, Indonesia, Ireland, Israel, Italy, Japan, Kuwait, Latvia, Lithuania, Luxembourg,
Malaysia, Mexico, Netherlands, New Zealand, Norway, Peru, Philippines, Poland, Portugal,
Romania, Russia, Saudi Arabia, Singapore, Slovakia, Slovenia, South Africa, Spain, Sweden,
Switzerland, Taiwan, Thailand, Turkey, Ukraine, United Arab Emirates, United Kingdom,
United States of America
All city sizes (by population)
Megacity
> 8 million
Large
> 800 thousand
Small
< 800 thousand
All congestion levels
> 50%
25% - 50%
15% - 25%
< 15%
Traffic Index 2020
#
World
rank City Country Congestion level
1 of 21See online ranking
1 1 Moscow region (oblast) Russia 54% ↓ 5%p
2 2 Mumbai India 53% ↓ 12%p
3 3 Bogota Colombia 53% ↓ 15%p
4 4 Manila Philippines 53% ↓ 18%p
5 5 Istanbul Turkey 51% ↓ 4%p
6 6 Bengaluru India 51% ↓ 20%p
7 7 Kyiv Ukraine 51% ↓ 2%p
8 8 New Delhi India 47% ↓ 9%p
9 9 Novosibirsk Russia 45% – 0%p
10 10 Bangkok Thailand 44% ↓ 9%p
11 11 Odessa Ukraine 44% ↓ 3%p
12 12 Saint Petersburg Russia 44% ↓ 5%p
13 13 Kharkiv Ukraine 43% – 0%p
14 14 Lodz Poland 42% ↓ 5%p
15 15 Lima Peru 42% ↓ 15%p
16 16 Pune India 42% ↓ 17%p
17 17 Chongqing China 42% ↑ 1%p
18 18 Bucharest Romania 42% ↓ 10%p
19 19 Tokyo Japan 41% ↓ 1%p
20 20 Samara Russia 41% ↓ 3%p
Traffic Index 2020
#
World
rank City Country Congestion level
2 of 21See online ranking
21 21 Dublin Ireland 38% ↓ 10%p
22 22 Dnipro Ukraine 38% ↑ 1%p
23 23 Taipei Taiwan 37% ↑ 2%p
24 24 Recife Brazil 37% ↓ 13%p
25 25 Tel Aviv Israel 37% ↓ 9%p
26 26 Changchun China 37% ↑ 4%p
27 27 Krakow Poland 36% ↓ 9%p
28 28 Yekaterinburg Russia 36% ↓ 5%p
29 29 Mexico City Mexico 36% ↓ 16%p
30 30 Cairo Egypt 36% ↓ 4%p
31 31 Jakarta Indonesia 36% ↓ 17%p
32 32 Wroclaw Poland 35% ↓ 4%p
33 33 Osaka Japan 35% ↓ 1%p
34 34 Taichung Taiwan 35% ↑ 1%p
35 35 Taoyuan Taiwan 34% ↑ 4%p
36 36 Athens Greece 34% ↓ 9%p
37 37 Rostov-on-Don Russia 34% ↓ 2%p
38 38 Nagoya Japan 33% – 0%p
39 39 Kaohsiung Taiwan 32% ↓ 1%p
40 40 Rio de Janeiro Brazil 32% ↓ 14%p
Traffic Index 2020
#
World
rank City Country Congestion level
3 of 21See online ranking
41 41 Tainan Taiwan 32% ↑ 1%p
42 42 Paris France 32% ↓ 7%p
43 43 Edinburgh United Kingdom 32% ↓ 9%p
44 44 Santiago Chile 31% ↓ 13%p
45 45 Poznan Poland 31% ↓ 13%p
46 46 Chelyabinsk Russia 31% ↓ 3%p
47 47 Warsaw Poland 31% ↓ 9%p
48 48 Fortaleza Brazil 31% ↓ 6%p
49 49 London United Kingdom 31% ↓ 7%p
50 50 Omsk Russia 31% ↓ 1%p
51 51 Salvador Brazil 30% ↓ 13%p
52 52 Vancouver Canada 30% ↓ 9%p
53 53 Sofia Bulgaria 30% ↓ 6%p
54 54 Marseille France 30% ↓ 4%p
55 55 Izmir Turkey 30% ↑ 1%p
56 56 Nizhny Novgorod Russia 30% ↓ 2%p
57 57 Hong Kong Hong Kong 30% ↓ 1%p
58 58 Berlin Germany 30% ↓ 2%p
59 59 Sao Paulo Brazil 30% ↓ 15%p
60 60 Palermo Italy 29% ↓ 7%p
Traffic Index 2020
#
World
rank City Country Congestion level
4 of 21See online ranking
61 61 Hamburg Germany 29% ↓ 5%p
62 62 Geneva Switzerland 29% ↓ 4%p
63 63 Auckland New Zealand 29% ↓ 2%p
64 64 Kazan Russia 29% – 0%p
65 65 Brussels Belgium 29% ↓ 9%p
66 66 Gdansk, Gdynia and Sopot Poland 29% ↓ 4%p
67 67 Ankara Turkey 28% ↓ 4%p
68 68 Sydney Australia 28% ↓ 5%p
69 69 Chengdu China 28% ↓ 7%p
70 70 Tomsk Russia 28% ↓ 3%p
71 71 Sapporo Japan 28% ↓ 2%p
72 72 Hull United Kingdom 28% ↓ 6%p
73 73 Brighton and Hove United Kingdom 28% ↓ 7%p
74 74 Belo Horizonte Brazil 28% ↓ 7%p
75 75 Shenyang China 28% – 0%p
76 76 Limerick Ireland 28% ↓ 3%p
77 77 Kuala Lumpur Malaysia 28% ↓ 9%p
78 78 Genoa Italy 27% ↓ 3%p
79 79 Rome Italy 27% ↓ 11%p
80 80 Bydgoszcz Poland 27% ↓ 7%p
Traffic Index 2020
#
World
rank City Country Congestion level
5 of 21See online ranking
81 81 Budapest Hungary 27% ↓ 10%p
82 82 Wellington New Zealand 27% ↓ 1%p
83 83 Singapore Singapore 27% ↓ 5%p
84 84 Szczecin Poland 27% ↓ 3%p
85 85 Los Angeles United States of America 27% ↓ 15%p
86 86 Zhuhai China 27% ↓ 12%p
87 87 Zurich Switzerland 27% ↓ 5%p
88 88 Bratislava Slovakia 27% ↓ 9%p
89 89 Adana Turkey 27% ↑ 1%p
90 90 Bordeaux France 27% ↓ 5%p
91 91 Lublin Poland 26% ↓ 1%p
92 92 Grenoble France 26% ↓ 6%p
93 93 Vilnius Lithuania 26% ↓ 6%p
94 94 Antalya Turkey 26% ↓ 3%p
95 95 Lugano Switzerland 26% ↓ 5%p
96 96 Changsha China 26% ↓ 9%p
97 97 Toulon France 26% ↓ 3%p
98 98 Tallinn Estonia 26% ↓ 5%p
99 99 Vienna Austria 26% ↓ 2%p
100 100 Cork Ireland 26% ↓ 7%p
Traffic Index 2020
#
World
rank City Country Congestion level
6 of 21See online ranking
101 101 Wiesbaden Germany 26% ↓ 6%p
102 102 New York United States of America 26% ↓ 11%p
103 103 Kobe Japan 26% – 0%p
104 104 Belfast United Kingdom 25% ↓ 8%p
105 105 Bursa Turkey 25% – 0%p
106 106 Luxembourg Luxembourg 25% ↓ 11%p
107 107 Nuremberg Germany 25% ↓ 5%p
108 108 Messina Italy 25% ↓ 6%p
109 109 Nice France 25% ↓ 6%p
110 110 Haarlem Netherlands 25% ↓ 2%p
111 111 Stuttgart Germany 25% ↓ 5%p
112 112 Bournemouth United Kingdom 25% ↓ 9%p
113 113 Lyon France 25% ↓ 5%p
114 114 Reading United Kingdom 25% ↓ 7%p
115 115 Naples Italy 25% ↓ 7%p
116 116 Shijiazhuang China 25% ↓ 1%p
117 117 Beijing China 24% ↓ 13%p
118 118 Hamilton New Zealand 24% ↓ 1%p
119 119 Porto Alegre Brazil 24% ↓ 11%p
120 120 Kassel Germany 24% ↓ 4%p
Traffic Index 2020
#
World
rank City Country Congestion level
7 of 21See online ranking
121 121 Southampton United Kingdom 24% ↓ 9%p
122 122 Montpellier France 24% ↓ 2%p
123 123 Buenos Aires Argentina 24% ↓ 11%p
124 124 Antwerp Belgium 24% ↓ 8%p
125 125 Guangzhou China 24% ↓ 16%p
126 126 Porto Portugal 24% ↓ 7%p
127 127 The Hague Netherlands 24% ↓ 4%p
128 128 Gaziantep Turkey 24% ↑ 1%p
129 129 Munich Germany 24% ↓ 6%p
130 130 Liverpool United Kingdom 23% ↓ 5%p
131 131 Shenzhen China 23% ↓ 14%p
132 132 Cape Town South Africa 23% ↓ 9%p
133 133 Dresden Germany 23% ↓ 2%p
134 134 Mersin Turkey 23% – 0%p
135 135 Nanjing China 23% ↓ 7%p
136 136 Catania Italy 23% ↓ 6%p
137 137 Prague Czechia 23% ↓ 6%p
138 138 Melbourne Australia 23% ↓ 7%p
139 139 Lisbon Portugal 23% ↓ 10%p
140 140 Bari Italy 23% ↓ 5%p
Traffic Index 2020
#
World
rank City Country Congestion level
8 of 21See online ranking
141 141 Miami United States of America 23% ↓ 8%p
142 142 Stockholm Sweden 23% ↓ 4%p
143 143 Milan Italy 23% ↓ 8%p
144 144 Graz Austria 23% ↓ 3%p
145 145 Bristol United Kingdom 23% ↓ 10%p
146 146 Kiel Germany 23% ↓ 3%p
147 147 Kosice Slovakia 23% ↓ 3%p
148 148 Salzburg Austria 23% ↓ 4%p
149 149 Leipzig Germany 23% ↓ 1%p
150 150 Portsmouth United Kingdom 22% ↓ 4%p
151 151 Xiamen China 22% ↓ 9%p
152 152 Shanghai China 22% ↓ 9%p
153 153 Leicester United Kingdom 22% ↓ 10%p
154 154 Bialystok Poland 22% ↓ 4%p
155 155 Thessaloniki Greece 22% ↓ 8%p
156 156 Manchester United Kingdom 22% ↓ 11%p
157 157 Nottingham United Kingdom 22% ↓ 5%p
158 158 Brisbane Australia 22% ↓ 3%p
159 159 Basel Switzerland 22% ↓ 4%p
160 160 Lausanne Switzerland 22% ↓ 5%p
Traffic Index 2020
#
World
rank City Country Congestion level
9 of 21See online ranking
161 161 Riga Latvia 22% ↓ 5%p
162 162 Strasbourg France 22% ↓ 6%p
163 163 Riyadh Saudi Arabia 22% ↓ 2%p
164 164 Barcelona Spain 22% ↓ 7%p
165 165 Nantes France 22% ↓ 5%p
166 166 East London South Africa 22% – 0%p
167 167 Brno Czechia 22% ↓ 8%p
168 168 Toronto Canada 22% ↓ 11%p
169 169 San Francisco United States of America 21% ↓ 15%p
170 170 Reggio Calabria Italy 21% ↓ 6%p
171 171 Christchurch New Zealand 21% – 0%p
172 172 Tianjin China 21% ↓ 2%p
173 173 Clermont-Ferrand France 21% ↓ 5%p
174 174 Nijmegen Netherlands 21% ↓ 6%p
175 175 Brest France 21% ↓ 2%p
176 176 Leiden Netherlands 21% ↓ 9%p
177 177 Toulouse France 21% ↓ 7%p
178 178 Cardiff United Kingdom 21% ↓ 9%p
179 179 Gold Coast Australia 21% ↓ 3%p
180 180 Bonn Germany 21% ↓ 8%p
Traffic Index 2020
#
World
rank City Country Congestion level
10 of 21See online ranking
181 181 Leuven Belgium 21% ↑ 1%p
182 182 Johannesburg South Africa 21% ↓ 9%p
183 183 Tauranga New Zealand 21% ↑ 1%p
184 184 Adelaide Australia 21% ↓ 3%p
185 185 Cologne Germany 21% ↓ 5%p
186 186 Curitiba Brazil 21% ↓ 7%p
187 187 Hobart Australia 20% ↓ 3%p
188 188 Frankfurt am Main Germany 20% ↓ 7%p
189 189 Turin Italy 20% ↓ 7%p
190 190 Hangzhou China 20% ↓ 8%p
191 191 Groningen Netherlands 20% ↓ 4%p
192 192 Baton Rouge United States of America 20% ↓ 6%p
193 193 Granada Spain 20% ↓ 5%p
194 194 Freiburg Germany 20% ↓ 3%p
195 195 Montreal Canada 20% ↓ 9%p
196 196 Rennes France 20% ↓ 4%p
197 197 Apeldoorn Netherlands 20% – 0%p
198 198 Fuzhou China 20% ↓ 8%p
199 199 Lille France 20% ↓ 5%p
200 200 Oslo Norway 20% ↓ 2%p
Traffic Index 2020
#
World
rank City Country Congestion level
11 of 21See online ranking
201 201 Le Havre France 20% ↓ 1%p
202 202 Pretoria South Africa 20% ↓ 5%p
203 203 Swansea United Kingdom 20% ↓ 6%p
204 204 Glasgow United Kingdom 20% ↓ 5%p
205 205 Mons Belgium 20% ↓ 14%p
206 206 Ruhr region west Germany 20% ↓ 3%p
207 207 Aarhus Denmark 20% ↓ 2%p
208 208 Sheffield United Kingdom 20% ↓ 8%p
209 209 Bremen Germany 19% ↓ 8%p
210 210 Birmingham-Wolverhampton United Kingdom 19% ↓ 9%p
211 211 Leeds-Bradford United Kingdom 19% ↓ 8%p
212 212 Newcastle-Sunderland United Kingdom 19% ↓ 6%p
213 213 San Jose United States of America 19% ↓ 14%p
214 214 Rotterdam Netherlands 19% ↓ 6%p
215 215 Dunedin New Zealand 19% ↓ 1%p
216 216 Augsburg Germany 19% ↓ 3%p
217 217 Cape Coral-Fort Myers United States of America 19% ↓ 2%p
218 218 Arnhem Netherlands 19% ↓ 7%p
219 219 Perth Australia 19% ↓ 1%p
220 220 Seattle United States of America 19% ↓ 12%p
Traffic Index 2020
#
World
rank City Country Congestion level
12 of 21See online ranking
221 221 Newcastle Australia 19% ↓ 1%p
222 222 Honolulu United States of America 19% ↓ 9%p
223 223 Stoke-on-Trent United Kingdom 19% ↓ 9%p
224 224 Munster Germany 19% ↓ 2%p
225 225 Ottawa Canada 19% ↓ 10%p
226 226 Cagliari Italy 19% ↓ 4%p
227 227 Hannover Germany 19% ↓ 2%p
228 228 Breda Netherlands 19% ↓ 2%p
229 229 Dusseldorf Germany 19% ↓ 5%p
230 230 Dubai United Arab Emirates 19% ↓ 2%p
231 231 Karlsruhe Germany 19% ↓ 3%p
232 232 Uppsala Sweden 19% ↓ 2%p
233 233 Tilburg Netherlands 19% ↓ 1%p
234 234 Riverside United States of America 19% ↓ 7%p
235 235 Wuxi China 18% ↓ 1%p
236 236 Rouen France 18% ↓ 4%p
237 237 Bakersfield United States of America 18% ↓ 3%p
238 238 Amsterdam Netherlands 18% ↓ 8%p
239 239 Tampa United States of America 18% ↓ 6%p
240 240 Middlesbrough United Kingdom 18% ↓ 2%p
Traffic Index 2020
#
World
rank City Country Congestion level
13 of 21See online ranking
241 241 Eindhoven Netherlands 18% ↓ 4%p
242 242 Mannheim Germany 18% ↓ 3%p
243 243 Santa Cruz de Tenerife Spain 18% ↓ 5%p
244 244 Trieste Italy 18% ↓ 3%p
245 245 Austin United States of America 18% ↓ 9%p
246 246 Orleans France 18% ↓ 2%p
247 247 Ruhr region east Germany 18% ↓ 3%p
248 248 London Canada 18% ↓ 5%p
249 249 Copenhagen Denmark 18% ↓ 4%p
250 250 Ghent Belgium 18% ↓ 2%p
251 251 Fresno United States of America 18% ↓ 3%p
252 252 Monchengladbach Germany 18% ↓ 4%p
253 253 Prato Italy 18% ↓ 6%p
254 254 Bologna Italy 18% ↓ 7%p
255 255 Jeddah Saudi Arabia 18% ↓ 1%p
256 256 Bern Switzerland 18% ↓ 2%p
257 257 Nancy France 18% ↓ 3%p
258 258 Sacramento United States of America 18% ↓ 7%p
259 259 Boise United States of America 18% ↓ 3%p
260 260 Bielsko-Biala Poland 18% ↓ 3%p
Traffic Index 2020
#
World
rank City Country Congestion level
14 of 21See online ranking
261 261 Turku Finland 18% ↓ 1%p
262 262 Quanzhou China 17% ↓ 6%p
263 263 Ljubljana Slovenia 17% ↓ 9%p
264 264 Coventry United Kingdom 17% ↓ 8%p
265 265 Pescara Italy 17% ↓ 6%p
266 266 Atlanta United States of America 17% ↓ 9%p
267 267 Kuwait City Kuwait 17% ↓ 8%p
268 268 New Orleans United States of America 17% ↓ 5%p
269 269 Linz Austria 17% ↓ 5%p
270 270 Florence Italy 17% ↓ 8%p
271 271 Valencia Spain 17% ↓ 3%p
272 272 Livorno Italy 17% ↓ 3%p
273 273 Washington United States of America 17% ↓ 12%p
274 274 Saint-Etienne France 17% ↓ 3%p
275 275 Chicago United States of America 17% ↓ 11%p
276 276 Orlando United States of America 17% ↓ 5%p
277 277 Charleston United States of America 17% ↓ 5%p
278 278 Innsbruck Austria 17% ↓ 6%p
279 279 Konya Turkey 17% ↓ 1%p
280 280 Avignon France 17% ↓ 1%p
Traffic Index 2020
#
World
rank City Country Congestion level
15 of 21See online ranking
281 281 Philadelphia United States of America 17% ↓ 7%p
282 282 Halifax Canada 17% ↓ 8%p
283 283 San Diego United States of America 17% ↓ 9%p
284 284 Winnipeg Canada 17% ↓ 5%p
285 285 Bielefeld Germany 17% ↓ 1%p
286 286 Ningbo China 17% ↓ 7%p
287 287 Portland United States of America 16% ↓ 10%p
288 288 Zwolle Netherlands 16% ↓ 2%p
289 289 Verona Italy 16% ↓ 4%p
290 290 Las Vegas United States of America 16% ↓ 5%p
291 291 Suzhou China 16% ↓ 4%p
292 292 Reykjavik Iceland 16% ↓ 2%p
293 293 Amersfoort Netherlands 16% ↓ 4%p
294 294 Palma de Mallorca Spain 16% ↓ 8%p
295 295 Houston United States of America 16% ↓ 8%p
296 296 Tucson United States of America 16% ↓ 3%p
297 297 Wuppertal Germany 16% ↓ 1%p
298 298 Preston United Kingdom 16% ↓ 7%p
299 299 Santander Spain 16% ↓ 1%p
300 300 Murcia Spain 16% ↓ 5%p
Traffic Index 2020
#
World
rank City Country Congestion level
16 of 21See online ranking
301 301 Taranto Italy 16% ↓ 4%p
302 302 Liege Belgium 16% ↓ 8%p
303 303 Kayseri Turkey 16% ↓ 1%p
304 304 Brasilia Brazil 16% ↓ 5%p
305 305 Namur Belgium 16% ↓ 3%p
306 306 Durban South Africa 16% ↓ 3%p
307 307 McAllen United States of America 16% ↓ 3%p
308 308 Wuhan China 16% ↓ 11%p
309 309 Dijon France 16% ↓ 1%p
310 310 Katowice urban area Poland 16% ↓ 3%p
311 311 Le Mans France 16% ↓ 2%p
312 312 A Coruna Spain 15% ↓ 4%p
313 313 Kortrijk Belgium 15% – 0%p
314 314 Las Palmas Spain 15% ↓ 3%p
315 315 Utrecht Netherlands 15% ↓ 7%p
316 316 Madrid Spain 15% ↓ 8%p
317 317 Odense Denmark 15% ↓ 3%p
318 318 Seville Spain 15% ↓ 6%p
319 319 Canberra Australia 15% ↓ 2%p
320 320 Braga Portugal 15% ↓ 3%p
Traffic Index 2020
#
World
rank City Country Congestion level
17 of 21See online ranking
321 321 Nashville United States of America 15% ↓ 11%p
322 322 Tours France 15% ↓ 1%p
323 323 Helsinki Finland 15% ↓ 4%p
324 324 Malaga Spain 15% ↓ 5%p
325 325 Boston United States of America 15% ↓ 11%p
326 326 Denver United States of America 15% ↓ 8%p
327 327 Reims France 15% ↓ 1%p
328 328 Pamplona Spain 15% ↓ 1%p
329 329 Gothenburg Sweden 14% ↓ 4%p
330 330 Quebec Canada 14% ↓ 8%p
331 331 Ravenna Italy 14% ↓ 3%p
332 332 Providence United States of America 14% ↓ 6%p
333 333 Oxnard-Thousand Oaks-Ventura United States of America 14% ↓ 4%p
334 334 Parma Italy 14% ↓ 3%p
335 335 Vitoria-Gasteiz Spain 14% – 0%p
336 336 Reggio Emilia Italy 14% ↓ 4%p
337 337 Alicante Spain 14% ↓ 4%p
338 338 Greenville United States of America 14% ↓ 4%p
339 339 Malmo Sweden 14% ↓ 1%p
340 340 Pittsburgh United States of America 14% ↓ 7%p
Traffic Index 2020
#
World
rank City Country Congestion level
18 of 21See online ranking
341 341 Wollongong Australia 14% ↑ 1%p
342 342 Colorado Springs United States of America 14% ↓ 3%p
343 343 Albuquerque United States of America 14% ↓ 3%p
344 344 Edmonton Canada 13% ↓ 3%p
345 345 Tampere Finland 13% ↓ 2%p
346 346 Dallas-Fort Worth United States of America 13% ↓ 6%p
347 347 Ostrava Czechia 13% ↓ 7%p
348 348 Jacksonville United States of America 13% ↓ 4%p
349 349 Salt Lake City United States of America 13% ↓ 6%p
350 350 Den Bosch Netherlands 13% ↓ 4%p
351 351 Phoenix United States of America 13% ↓ 5%p
352 352 Zaragoza Spain 13% ↓ 1%p
353 353 Bergen Norway 13% ↓ 2%p
354 354 Charlotte United States of America 13% ↓ 6%p
355 355 Vigo Spain 13% ↓ 2%p
356 356 Calgary Canada 13% ↓ 5%p
357 357 Virginia Beach United States of America 13% ↓ 3%p
358 358 San Antonio United States of America 13% ↓ 6%p
359 359 Dongguan China 13% ↓ 9%p
360 360 Gijon Spain 13% ↓ 3%p
Traffic Index 2020
#
World
rank City Country Congestion level
19 of 21See online ranking
361 361 Valladolid Spain 13% – 0%p
362 362 Padua Italy 13% ↓ 4%p
363 363 Bruges Belgium 12% ↓ 4%p
364 364 Coimbra Portugal 12% ↓ 3%p
365 365 Trondheim Norway 12% ↓ 3%p
366 366 El Paso United States of America 12% ↓ 4%p
367 367 Cartagena Spain 12% ↓ 2%p
368 368 New Haven United States of America 12% ↓ 4%p
369 369 Kitchener-Waterloo Canada 12% ↓ 4%p
370 370 Cordoba Spain 12% ↓ 2%p
371 371 Modena Italy 12% ↓ 2%p
372 372 Baltimore United States of America 12% ↓ 8%p
373 373 Raleigh United States of America 12% ↓ 6%p
374 374 Charleroi Belgium 12% ↓ 1%p
375 375 Funchal Portugal 12% ↓ 5%p
376 376 Bilbao Spain 12% ↓ 1%p
377 377 Oklahoma City United States of America 12% ↓ 2%p
378 378 Birmingham United States of America 12% ↓ 6%p
379 379 Stavanger Norway 12% ↓ 1%p
380 380 Hamilton Canada 12% ↓ 7%p
Traffic Index 2020
#
World
rank City Country Congestion level
20 of 21See online ranking
381 381 Cincinnati United States of America 12% ↓ 4%p
382 382 Brescia Italy 11% ↓ 3%p
383 383 Louisville United States of America 11% ↓ 4%p
384 384 Memphis United States of America 11% ↓ 4%p
385 385 San Sebastian Spain 11% ↓ 3%p
386 386 Allentown United States of America 11% ↓ 4%p
387 387 Oviedo Spain 11% ↓ 2%p
388 388 Bloemfontein South Africa 11% ↓ 2%p
389 389 Columbus United States of America 11% ↓ 5%p
390 390 Tulsa United States of America 11% ↓ 2%p
391 391 Detroit United States of America 11% ↓ 5%p
392 392 Hartford United States of America 11% ↓ 6%p
393 393 Buffalo United States of America 10% ↓ 5%p
394 394 Columbia United States of America 10% ↓ 3%p
395 395 Albany United States of America 10% ↓ 6%p
396 396 Omaha-Council Bluffs United States of America 10% ↓ 4%p
397 397 Knoxville United States of America 10% ↓ 2%p
398 398 Grand Rapids United States of America 10% ↓ 6%p
399 399 Abu Dhabi United Arab Emirates 10% – 0%p
400 400 Almere Netherlands 10% – 0%p
Traffic Index 2020
#
World
rank City Country Congestion level
21 of 21See online ranking
401 401 Rochester United States of America 10% ↓ 4%p
402 402 Worcester United States of America 9% ↓ 6%p
403 403 St. Louis United States of America 9% ↓ 5%p
404 404 Cleveland United States of America 9% ↓ 3%p
405 405 Richmond United States of America 9% ↓ 3%p
406 406 Milwaukee United States of America 9% ↓ 4%p
407 407 Indianapolis United States of America 9% ↓ 5%p
408 408 Minneapolis United States of America 9% ↓ 8%p
409 409 Kansas City United States of America 9% ↓ 3%p
410 410 Syracuse United States of America 8% ↓ 2%p
411 411 Dayton United States of America 8% ↓ 2%p
412 412 Little Rock United States of America 8% ↓ 3%p
413 413 Winston-Salem United States of America 8% ↓ 4%p
414 414 Cadiz Spain 8% ↓ 2%p
415 415 Akron United States of America 8% ↓ 2%p
416 416 Greensboro-High Point United States of America 7% ↓ 2%p

More Related Content

Similar to TomTom traffic index

AdEx Benchmark 2016 Study
AdEx Benchmark 2016 StudyAdEx Benchmark 2016 Study
AdEx Benchmark 2016 StudyIAB Europe
 
NOAH Newsletter - Edition: September 2015
NOAH Newsletter - Edition: September 2015 NOAH Newsletter - Edition: September 2015
NOAH Newsletter - Edition: September 2015 NOAH Advisors
 
international construction cost survey (us$ version)
international construction cost survey (us$ version)international construction cost survey (us$ version)
international construction cost survey (us$ version)Merklim
 
GDP and Economic Growth Analysis
GDP and Economic Growth AnalysisGDP and Economic Growth Analysis
GDP and Economic Growth AnalysisMohamadreza Mashouf
 
Country profiles 2017
Country profiles 2017Country profiles 2017
Country profiles 2017Arthur Thomas
 
Identifikasi industri
Identifikasi industriIdentifikasi industri
Identifikasi industrirolly purnomo
 
CNNIC OPM 2017: Global IPv6 Trends in 2017
CNNIC OPM 2017: Global IPv6 Trends in 2017CNNIC OPM 2017: Global IPv6 Trends in 2017
CNNIC OPM 2017: Global IPv6 Trends in 2017APNIC
 
State of IPv6 in 2018: IETF 101
State of IPv6 in 2018: IETF 101State of IPv6 in 2018: IETF 101
State of IPv6 in 2018: IETF 101APNIC
 
The online advertising landscape in Europe 2013
The online advertising landscape in Europe 2013The online advertising landscape in Europe 2013
The online advertising landscape in Europe 2013IAB Europe
 
NOAH Newsletter - Edition: November 2015
NOAH Newsletter - Edition: November 2015 NOAH Newsletter - Edition: November 2015
NOAH Newsletter - Edition: November 2015 NOAH Advisors
 
Nils Flaatten's Presentation at Cap40 Business Wednesday
Nils Flaatten's Presentation at Cap40 Business WednesdayNils Flaatten's Presentation at Cap40 Business Wednesday
Nils Flaatten's Presentation at Cap40 Business WednesdayCap40
 
Goldbach Group | IAB Europe AdEx Benchmark 2013 Report
Goldbach Group | IAB Europe AdEx Benchmark 2013 ReportGoldbach Group | IAB Europe AdEx Benchmark 2013 Report
Goldbach Group | IAB Europe AdEx Benchmark 2013 ReportGoldbach Group AG
 
Gemius webit istanbul_06_11
Gemius webit istanbul_06_11Gemius webit istanbul_06_11
Gemius webit istanbul_06_11Gemius
 
30th TWNIC OPM and 2018 TWNOG: IPv6 in Taiwan, the Asia Pacific and worldwide
30th TWNIC OPM and 2018 TWNOG: IPv6 in Taiwan, the Asia Pacific and worldwide30th TWNIC OPM and 2018 TWNOG: IPv6 in Taiwan, the Asia Pacific and worldwide
30th TWNIC OPM and 2018 TWNOG: IPv6 in Taiwan, the Asia Pacific and worldwideAPNIC
 
Global ad trends_2014
Global ad trends_2014Global ad trends_2014
Global ad trends_2014AdCMO
 
STR Global Client Breakfast Briefing (October 2013) - Global Hotel Constructi...
STR Global Client Breakfast Briefing (October 2013) - Global Hotel Constructi...STR Global Client Breakfast Briefing (October 2013) - Global Hotel Constructi...
STR Global Client Breakfast Briefing (October 2013) - Global Hotel Constructi...James April Yap
 

Similar to TomTom traffic index (20)

AdEx Benchmark 2016 Study
AdEx Benchmark 2016 StudyAdEx Benchmark 2016 Study
AdEx Benchmark 2016 Study
 
NOAH Newsletter - Edition: September 2015
NOAH Newsletter - Edition: September 2015 NOAH Newsletter - Edition: September 2015
NOAH Newsletter - Edition: September 2015
 
international construction cost survey (us$ version)
international construction cost survey (us$ version)international construction cost survey (us$ version)
international construction cost survey (us$ version)
 
WENA S&D GIP 1-15 May 2014
WENA S&D GIP 1-15 May 2014WENA S&D GIP 1-15 May 2014
WENA S&D GIP 1-15 May 2014
 
GDP and Economic Growth Analysis
GDP and Economic Growth AnalysisGDP and Economic Growth Analysis
GDP and Economic Growth Analysis
 
Country profiles 2017
Country profiles 2017Country profiles 2017
Country profiles 2017
 
Identifikasi industri
Identifikasi industriIdentifikasi industri
Identifikasi industri
 
CNNIC OPM 2017: Global IPv6 Trends in 2017
CNNIC OPM 2017: Global IPv6 Trends in 2017CNNIC OPM 2017: Global IPv6 Trends in 2017
CNNIC OPM 2017: Global IPv6 Trends in 2017
 
Payments in Poland Jan. 2015
Payments in Poland Jan. 2015Payments in Poland Jan. 2015
Payments in Poland Jan. 2015
 
State of IPv6 in 2018: IETF 101
State of IPv6 in 2018: IETF 101State of IPv6 in 2018: IETF 101
State of IPv6 in 2018: IETF 101
 
The online advertising landscape in Europe 2013
The online advertising landscape in Europe 2013The online advertising landscape in Europe 2013
The online advertising landscape in Europe 2013
 
NOAH Newsletter - Edition: November 2015
NOAH Newsletter - Edition: November 2015 NOAH Newsletter - Edition: November 2015
NOAH Newsletter - Edition: November 2015
 
Nils Flaatten's Presentation at Cap40 Business Wednesday
Nils Flaatten's Presentation at Cap40 Business WednesdayNils Flaatten's Presentation at Cap40 Business Wednesday
Nils Flaatten's Presentation at Cap40 Business Wednesday
 
Goldbach Group | IAB Europe AdEx Benchmark 2013 Report
Goldbach Group | IAB Europe AdEx Benchmark 2013 ReportGoldbach Group | IAB Europe AdEx Benchmark 2013 Report
Goldbach Group | IAB Europe AdEx Benchmark 2013 Report
 
Gemius webit istanbul_06_11
Gemius webit istanbul_06_11Gemius webit istanbul_06_11
Gemius webit istanbul_06_11
 
том том
том томтом том
том том
 
30th TWNIC OPM and 2018 TWNOG: IPv6 in Taiwan, the Asia Pacific and worldwide
30th TWNIC OPM and 2018 TWNOG: IPv6 in Taiwan, the Asia Pacific and worldwide30th TWNIC OPM and 2018 TWNOG: IPv6 in Taiwan, the Asia Pacific and worldwide
30th TWNIC OPM and 2018 TWNOG: IPv6 in Taiwan, the Asia Pacific and worldwide
 
Global ad trends_2014
Global ad trends_2014Global ad trends_2014
Global ad trends_2014
 
Gemius webit istanbul_06_11
Gemius webit istanbul_06_11Gemius webit istanbul_06_11
Gemius webit istanbul_06_11
 
STR Global Client Breakfast Briefing (October 2013) - Global Hotel Constructi...
STR Global Client Breakfast Briefing (October 2013) - Global Hotel Constructi...STR Global Client Breakfast Briefing (October 2013) - Global Hotel Constructi...
STR Global Client Breakfast Briefing (October 2013) - Global Hotel Constructi...
 

More from Paperjam_redaction

Rapport annuel de Encevo Group pour l'année 2023
Rapport annuel de Encevo Group pour l'année 2023Rapport annuel de Encevo Group pour l'année 2023
Rapport annuel de Encevo Group pour l'année 2023Paperjam_redaction
 
Limites de revenus aides individuelles logement.pdf
Limites de revenus aides individuelles logement.pdfLimites de revenus aides individuelles logement.pdf
Limites de revenus aides individuelles logement.pdfPaperjam_redaction
 
rapport-compte-gnral-2022-vf.pdf
rapport-compte-gnral-2022-vf.pdfrapport-compte-gnral-2022-vf.pdf
rapport-compte-gnral-2022-vf.pdfPaperjam_redaction
 
Lere-de-lIA_Opportunites-et-defis_Fondation-IDEA-asbl_VD.pdf
Lere-de-lIA_Opportunites-et-defis_Fondation-IDEA-asbl_VD.pdfLere-de-lIA_Opportunites-et-defis_Fondation-IDEA-asbl_VD.pdf
Lere-de-lIA_Opportunites-et-defis_Fondation-IDEA-asbl_VD.pdfPaperjam_redaction
 
Bank account in Luxembourg - Contacts FinTechs_October 2023_v5.pdf
Bank account in Luxembourg - Contacts FinTechs_October 2023_v5.pdfBank account in Luxembourg - Contacts FinTechs_October 2023_v5.pdf
Bank account in Luxembourg - Contacts FinTechs_October 2023_v5.pdfPaperjam_redaction
 
Bank account in Luxembourg - Contacts AIFs_October 2023_final_v2.pdf
Bank account in Luxembourg - Contacts AIFs_October 2023_final_v2.pdfBank account in Luxembourg - Contacts AIFs_October 2023_final_v2.pdf
Bank account in Luxembourg - Contacts AIFs_October 2023_final_v2.pdfPaperjam_redaction
 
Patents-trade-marks-and-startup-finance-study.pdf
Patents-trade-marks-and-startup-finance-study.pdfPatents-trade-marks-and-startup-finance-study.pdf
Patents-trade-marks-and-startup-finance-study.pdfPaperjam_redaction
 
Rapport d'analyse 8 - subvention de loyer.pdf
Rapport d'analyse 8 - subvention de loyer.pdfRapport d'analyse 8 - subvention de loyer.pdf
Rapport d'analyse 8 - subvention de loyer.pdfPaperjam_redaction
 
European innovation scoreboard 2022-KI0922386ENN (1).pdf
European innovation scoreboard 2022-KI0922386ENN (1).pdfEuropean innovation scoreboard 2022-KI0922386ENN (1).pdf
European innovation scoreboard 2022-KI0922386ENN (1).pdfPaperjam_redaction
 
Affiche Mouvement Social L01B Metz Thionville Luxembourg du mardi 26 septembr...
Affiche Mouvement Social L01B Metz Thionville Luxembourg du mardi 26 septembr...Affiche Mouvement Social L01B Metz Thionville Luxembourg du mardi 26 septembr...
Affiche Mouvement Social L01B Metz Thionville Luxembourg du mardi 26 septembr...Paperjam_redaction
 
IMD World Talent Report 2023.pdf
IMD World Talent Report 2023.pdfIMD World Talent Report 2023.pdf
IMD World Talent Report 2023.pdfPaperjam_redaction
 
Conférence Luxembourg Stratégie - Programme - 26.09.23[19].pdf
Conférence Luxembourg Stratégie - Programme - 26.09.23[19].pdfConférence Luxembourg Stratégie - Programme - 26.09.23[19].pdf
Conférence Luxembourg Stratégie - Programme - 26.09.23[19].pdfPaperjam_redaction
 
RÈGLEMENT (UE) 2023/1115 DU PARLEMENT EUROPÉEN ET DU CONSEIL du 31 mai 2023
RÈGLEMENT (UE) 2023/1115 DU PARLEMENT EUROPÉEN ET DU CONSEIL du 31 mai 2023RÈGLEMENT (UE) 2023/1115 DU PARLEMENT EUROPÉEN ET DU CONSEIL du 31 mai 2023
RÈGLEMENT (UE) 2023/1115 DU PARLEMENT EUROPÉEN ET DU CONSEIL du 31 mai 2023Paperjam_redaction
 

More from Paperjam_redaction (20)

Rapport annuel de Encevo Group pour l'année 2023
Rapport annuel de Encevo Group pour l'année 2023Rapport annuel de Encevo Group pour l'année 2023
Rapport annuel de Encevo Group pour l'année 2023
 
Limites de revenus aides individuelles logement.pdf
Limites de revenus aides individuelles logement.pdfLimites de revenus aides individuelles logement.pdf
Limites de revenus aides individuelles logement.pdf
 
rapport-compte-gnral-2022-vf.pdf
rapport-compte-gnral-2022-vf.pdfrapport-compte-gnral-2022-vf.pdf
rapport-compte-gnral-2022-vf.pdf
 
ADC2023.pdf
ADC2023.pdfADC2023.pdf
ADC2023.pdf
 
Lere-de-lIA_Opportunites-et-defis_Fondation-IDEA-asbl_VD.pdf
Lere-de-lIA_Opportunites-et-defis_Fondation-IDEA-asbl_VD.pdfLere-de-lIA_Opportunites-et-defis_Fondation-IDEA-asbl_VD.pdf
Lere-de-lIA_Opportunites-et-defis_Fondation-IDEA-asbl_VD.pdf
 
Bank account in Luxembourg - Contacts FinTechs_October 2023_v5.pdf
Bank account in Luxembourg - Contacts FinTechs_October 2023_v5.pdfBank account in Luxembourg - Contacts FinTechs_October 2023_v5.pdf
Bank account in Luxembourg - Contacts FinTechs_October 2023_v5.pdf
 
Bank account in Luxembourg - Contacts AIFs_October 2023_final_v2.pdf
Bank account in Luxembourg - Contacts AIFs_October 2023_final_v2.pdfBank account in Luxembourg - Contacts AIFs_October 2023_final_v2.pdf
Bank account in Luxembourg - Contacts AIFs_October 2023_final_v2.pdf
 
Patents-trade-marks-and-startup-finance-study.pdf
Patents-trade-marks-and-startup-finance-study.pdfPatents-trade-marks-and-startup-finance-study.pdf
Patents-trade-marks-and-startup-finance-study.pdf
 
Bulletin du Statec
Bulletin du StatecBulletin du Statec
Bulletin du Statec
 
Rapport d'analyse 8 - subvention de loyer.pdf
Rapport d'analyse 8 - subvention de loyer.pdfRapport d'analyse 8 - subvention de loyer.pdf
Rapport d'analyse 8 - subvention de loyer.pdf
 
Note 34.pdf
Note 34.pdfNote 34.pdf
Note 34.pdf
 
Note 35.pdf
Note 35.pdfNote 35.pdf
Note 35.pdf
 
European innovation scoreboard 2022-KI0922386ENN (1).pdf
European innovation scoreboard 2022-KI0922386ENN (1).pdfEuropean innovation scoreboard 2022-KI0922386ENN (1).pdf
European innovation scoreboard 2022-KI0922386ENN (1).pdf
 
Lettre d'intention LU-BE.pdf
Lettre d'intention LU-BE.pdfLettre d'intention LU-BE.pdf
Lettre d'intention LU-BE.pdf
 
Affiche Mouvement Social L01B Metz Thionville Luxembourg du mardi 26 septembr...
Affiche Mouvement Social L01B Metz Thionville Luxembourg du mardi 26 septembr...Affiche Mouvement Social L01B Metz Thionville Luxembourg du mardi 26 septembr...
Affiche Mouvement Social L01B Metz Thionville Luxembourg du mardi 26 septembr...
 
IMD World Talent Report 2023.pdf
IMD World Talent Report 2023.pdfIMD World Talent Report 2023.pdf
IMD World Talent Report 2023.pdf
 
Conférence Luxembourg Stratégie - Programme - 26.09.23[19].pdf
Conférence Luxembourg Stratégie - Programme - 26.09.23[19].pdfConférence Luxembourg Stratégie - Programme - 26.09.23[19].pdf
Conférence Luxembourg Stratégie - Programme - 26.09.23[19].pdf
 
RÈGLEMENT (UE) 2023/1115 DU PARLEMENT EUROPÉEN ET DU CONSEIL du 31 mai 2023
RÈGLEMENT (UE) 2023/1115 DU PARLEMENT EUROPÉEN ET DU CONSEIL du 31 mai 2023RÈGLEMENT (UE) 2023/1115 DU PARLEMENT EUROPÉEN ET DU CONSEIL du 31 mai 2023
RÈGLEMENT (UE) 2023/1115 DU PARLEMENT EUROPÉEN ET DU CONSEIL du 31 mai 2023
 
Asti.pdf
Asti.pdfAsti.pdf
Asti.pdf
 
2023-26-inf-fr.docx.pdf
2023-26-inf-fr.docx.pdf2023-26-inf-fr.docx.pdf
2023-26-inf-fr.docx.pdf
 

Recently uploaded

一比一定制加拿大新喀里多尼亚学院毕业证(UofL毕业证书)学位证书
一比一定制加拿大新喀里多尼亚学院毕业证(UofL毕业证书)学位证书一比一定制加拿大新喀里多尼亚学院毕业证(UofL毕业证书)学位证书
一比一定制加拿大新喀里多尼亚学院毕业证(UofL毕业证书)学位证书egfdgfd
 
Auto Glass Repair in Redwood City What to Do When Disaster Strikes.pdf
Auto Glass Repair in Redwood City What to Do When Disaster Strikes.pdfAuto Glass Repair in Redwood City What to Do When Disaster Strikes.pdf
Auto Glass Repair in Redwood City What to Do When Disaster Strikes.pdfDuran's Auto Glass
 
EV Charging Resources and Technical Assistance for Rural Communities and Trib...
EV Charging Resources and Technical Assistance for Rural Communities and Trib...EV Charging Resources and Technical Assistance for Rural Communities and Trib...
EV Charging Resources and Technical Assistance for Rural Communities and Trib...Forth
 
Access to Rural Charging by David Skakel
Access to Rural Charging by David SkakelAccess to Rural Charging by David Skakel
Access to Rural Charging by David SkakelForth
 
What Might Be Behind Your Mercedes' Inoperative Cruise Control
What Might Be Behind Your Mercedes' Inoperative Cruise ControlWhat Might Be Behind Your Mercedes' Inoperative Cruise Control
What Might Be Behind Your Mercedes' Inoperative Cruise ControlM Service Inc
 
What Causes The BMW X7 Power Supply Warning To Illuminate
What Causes The BMW X7 Power Supply Warning To IlluminateWhat Causes The BMW X7 Power Supply Warning To Illuminate
What Causes The BMW X7 Power Supply Warning To IlluminateMedway Imports
 
mechanical vibrations pebbles.pptbbbbbbbbx
mechanical vibrations pebbles.pptbbbbbbbbxmechanical vibrations pebbles.pptbbbbbbbbx
mechanical vibrations pebbles.pptbbbbbbbbxjoshuaclack73
 
What Could Cause Your Audi To Keep Cutting Out
What Could Cause Your Audi To Keep Cutting OutWhat Could Cause Your Audi To Keep Cutting Out
What Could Cause Your Audi To Keep Cutting OutEuroautomotive
 
出售伯明翰大学毕业证研究生文凭证书原版质量
出售伯明翰大学毕业证研究生文凭证书原版质量出售伯明翰大学毕业证研究生文凭证书原版质量
出售伯明翰大学毕业证研究生文凭证书原版质量kthcah
 
一比一原版曼彻斯特城市大学毕业证成绩单原件一模一样
一比一原版曼彻斯特城市大学毕业证成绩单原件一模一样一比一原版曼彻斯特城市大学毕业证成绩单原件一模一样
一比一原版曼彻斯特城市大学毕业证成绩单原件一模一样fsdfdsgf
 
原版定做(ncl学位证书)英国纽卡斯尔大学毕业证文凭学历证书-国外学历学位认证
原版定做(ncl学位证书)英国纽卡斯尔大学毕业证文凭学历证书-国外学历学位认证原版定做(ncl学位证书)英国纽卡斯尔大学毕业证文凭学历证书-国外学历学位认证
原版定做(ncl学位证书)英国纽卡斯尔大学毕业证文凭学历证书-国外学历学位认证eehzz
 
一比一原版(Auburn毕业证书)奥本大学毕业证原件一模一样
一比一原版(Auburn毕业证书)奥本大学毕业证原件一模一样一比一原版(Auburn毕业证书)奥本大学毕业证原件一模一样
一比一原版(Auburn毕业证书)奥本大学毕业证原件一模一样AS
 
Benefits of Load Planning in Fleet Management
Benefits of Load Planning in Fleet ManagementBenefits of Load Planning in Fleet Management
Benefits of Load Planning in Fleet Managementjennifermiller8137
 
5 Signs Your VW Key Fob Battery Needs Replacement
5 Signs Your VW Key Fob Battery Needs Replacement5 Signs Your VW Key Fob Battery Needs Replacement
5 Signs Your VW Key Fob Battery Needs ReplacementSanta Barbara Autowerks
 
Preparing for Transportation Electrification: The Electric Coop Perspective
Preparing for Transportation Electrification: The Electric Coop PerspectivePreparing for Transportation Electrification: The Electric Coop Perspective
Preparing for Transportation Electrification: The Electric Coop PerspectiveForth
 
一比一原版(McMaste毕业证书)加拿大麦克马斯特大学毕业证成绩单原件一模一样
一比一原版(McMaste毕业证书)加拿大麦克马斯特大学毕业证成绩单原件一模一样一比一原版(McMaste毕业证书)加拿大麦克马斯特大学毕业证成绩单原件一模一样
一比一原版(McMaste毕业证书)加拿大麦克马斯特大学毕业证成绩单原件一模一样AD
 
原版定制英国格鲁斯特大学毕业证原件一模一样
原版定制英国格鲁斯特大学毕业证原件一模一样原版定制英国格鲁斯特大学毕业证原件一模一样
原版定制英国格鲁斯特大学毕业证原件一模一样AS
 
一比一原版英国哈珀亚当斯大学毕业证如何办理
一比一原版英国哈珀亚当斯大学毕业证如何办理一比一原版英国哈珀亚当斯大学毕业证如何办理
一比一原版英国哈珀亚当斯大学毕业证如何办理AS
 
Why Won't My Mercedes Key Fob Function After A Battery Swap
Why Won't My Mercedes Key Fob Function After A Battery SwapWhy Won't My Mercedes Key Fob Function After A Battery Swap
Why Won't My Mercedes Key Fob Function After A Battery SwapDreamcars Auto Repair
 
Why Is The Glow Plug Light Flashing In My VW & What Does It Indicate
Why Is The Glow Plug Light Flashing In My VW & What Does It IndicateWhy Is The Glow Plug Light Flashing In My VW & What Does It Indicate
Why Is The Glow Plug Light Flashing In My VW & What Does It IndicateWoodinville Sports Cars
 

Recently uploaded (20)

一比一定制加拿大新喀里多尼亚学院毕业证(UofL毕业证书)学位证书
一比一定制加拿大新喀里多尼亚学院毕业证(UofL毕业证书)学位证书一比一定制加拿大新喀里多尼亚学院毕业证(UofL毕业证书)学位证书
一比一定制加拿大新喀里多尼亚学院毕业证(UofL毕业证书)学位证书
 
Auto Glass Repair in Redwood City What to Do When Disaster Strikes.pdf
Auto Glass Repair in Redwood City What to Do When Disaster Strikes.pdfAuto Glass Repair in Redwood City What to Do When Disaster Strikes.pdf
Auto Glass Repair in Redwood City What to Do When Disaster Strikes.pdf
 
EV Charging Resources and Technical Assistance for Rural Communities and Trib...
EV Charging Resources and Technical Assistance for Rural Communities and Trib...EV Charging Resources and Technical Assistance for Rural Communities and Trib...
EV Charging Resources and Technical Assistance for Rural Communities and Trib...
 
Access to Rural Charging by David Skakel
Access to Rural Charging by David SkakelAccess to Rural Charging by David Skakel
Access to Rural Charging by David Skakel
 
What Might Be Behind Your Mercedes' Inoperative Cruise Control
What Might Be Behind Your Mercedes' Inoperative Cruise ControlWhat Might Be Behind Your Mercedes' Inoperative Cruise Control
What Might Be Behind Your Mercedes' Inoperative Cruise Control
 
What Causes The BMW X7 Power Supply Warning To Illuminate
What Causes The BMW X7 Power Supply Warning To IlluminateWhat Causes The BMW X7 Power Supply Warning To Illuminate
What Causes The BMW X7 Power Supply Warning To Illuminate
 
mechanical vibrations pebbles.pptbbbbbbbbx
mechanical vibrations pebbles.pptbbbbbbbbxmechanical vibrations pebbles.pptbbbbbbbbx
mechanical vibrations pebbles.pptbbbbbbbbx
 
What Could Cause Your Audi To Keep Cutting Out
What Could Cause Your Audi To Keep Cutting OutWhat Could Cause Your Audi To Keep Cutting Out
What Could Cause Your Audi To Keep Cutting Out
 
出售伯明翰大学毕业证研究生文凭证书原版质量
出售伯明翰大学毕业证研究生文凭证书原版质量出售伯明翰大学毕业证研究生文凭证书原版质量
出售伯明翰大学毕业证研究生文凭证书原版质量
 
一比一原版曼彻斯特城市大学毕业证成绩单原件一模一样
一比一原版曼彻斯特城市大学毕业证成绩单原件一模一样一比一原版曼彻斯特城市大学毕业证成绩单原件一模一样
一比一原版曼彻斯特城市大学毕业证成绩单原件一模一样
 
原版定做(ncl学位证书)英国纽卡斯尔大学毕业证文凭学历证书-国外学历学位认证
原版定做(ncl学位证书)英国纽卡斯尔大学毕业证文凭学历证书-国外学历学位认证原版定做(ncl学位证书)英国纽卡斯尔大学毕业证文凭学历证书-国外学历学位认证
原版定做(ncl学位证书)英国纽卡斯尔大学毕业证文凭学历证书-国外学历学位认证
 
一比一原版(Auburn毕业证书)奥本大学毕业证原件一模一样
一比一原版(Auburn毕业证书)奥本大学毕业证原件一模一样一比一原版(Auburn毕业证书)奥本大学毕业证原件一模一样
一比一原版(Auburn毕业证书)奥本大学毕业证原件一模一样
 
Benefits of Load Planning in Fleet Management
Benefits of Load Planning in Fleet ManagementBenefits of Load Planning in Fleet Management
Benefits of Load Planning in Fleet Management
 
5 Signs Your VW Key Fob Battery Needs Replacement
5 Signs Your VW Key Fob Battery Needs Replacement5 Signs Your VW Key Fob Battery Needs Replacement
5 Signs Your VW Key Fob Battery Needs Replacement
 
Preparing for Transportation Electrification: The Electric Coop Perspective
Preparing for Transportation Electrification: The Electric Coop PerspectivePreparing for Transportation Electrification: The Electric Coop Perspective
Preparing for Transportation Electrification: The Electric Coop Perspective
 
一比一原版(McMaste毕业证书)加拿大麦克马斯特大学毕业证成绩单原件一模一样
一比一原版(McMaste毕业证书)加拿大麦克马斯特大学毕业证成绩单原件一模一样一比一原版(McMaste毕业证书)加拿大麦克马斯特大学毕业证成绩单原件一模一样
一比一原版(McMaste毕业证书)加拿大麦克马斯特大学毕业证成绩单原件一模一样
 
原版定制英国格鲁斯特大学毕业证原件一模一样
原版定制英国格鲁斯特大学毕业证原件一模一样原版定制英国格鲁斯特大学毕业证原件一模一样
原版定制英国格鲁斯特大学毕业证原件一模一样
 
一比一原版英国哈珀亚当斯大学毕业证如何办理
一比一原版英国哈珀亚当斯大学毕业证如何办理一比一原版英国哈珀亚当斯大学毕业证如何办理
一比一原版英国哈珀亚当斯大学毕业证如何办理
 
Why Won't My Mercedes Key Fob Function After A Battery Swap
Why Won't My Mercedes Key Fob Function After A Battery SwapWhy Won't My Mercedes Key Fob Function After A Battery Swap
Why Won't My Mercedes Key Fob Function After A Battery Swap
 
Why Is The Glow Plug Light Flashing In My VW & What Does It Indicate
Why Is The Glow Plug Light Flashing In My VW & What Does It IndicateWhy Is The Glow Plug Light Flashing In My VW & What Does It Indicate
Why Is The Glow Plug Light Flashing In My VW & What Does It Indicate
 

TomTom traffic index

  • 1. Traffic Index 2020 Created to help you tackle traffic – as a driver, city planner, automaker or policy maker – the TomTom Traffic Index provides detailed insights on live and historic road congestion levels in cities around the world. You are permitted to use the contents of this document in online, offline and social media and other publication channels for non-commercial purposes with clear reference to TomTom International BV as its main source. You are not permitted to modify, compile, adapt or use any part of this document in any way for commercial purposes without a written agreement from TomTom International BV.
  • 2. Traffic Index results 2020 Downloaded from: https://www.tomtom.com/traffic-index/ranking/ 416 results FULL All countries (57) Argentina, Australia, Austria, Belgium, Brazil, Bulgaria, Canada, Chile, China, Colombia, Czechia, Denmark, Egypt, Estonia, Finland, France, Germany, Greece, Hong Kong, Hungary, Iceland, India, Indonesia, Ireland, Israel, Italy, Japan, Kuwait, Latvia, Lithuania, Luxembourg, Malaysia, Mexico, Netherlands, New Zealand, Norway, Peru, Philippines, Poland, Portugal, Romania, Russia, Saudi Arabia, Singapore, Slovakia, Slovenia, South Africa, Spain, Sweden, Switzerland, Taiwan, Thailand, Turkey, Ukraine, United Arab Emirates, United Kingdom, United States of America All city sizes (by population) Megacity > 8 million Large > 800 thousand Small < 800 thousand All congestion levels > 50% 25% - 50% 15% - 25% < 15%
  • 3. Traffic Index 2020 # World rank City Country Congestion level 1 of 21See online ranking 1 1 Moscow region (oblast) Russia 54% ↓ 5%p 2 2 Mumbai India 53% ↓ 12%p 3 3 Bogota Colombia 53% ↓ 15%p 4 4 Manila Philippines 53% ↓ 18%p 5 5 Istanbul Turkey 51% ↓ 4%p 6 6 Bengaluru India 51% ↓ 20%p 7 7 Kyiv Ukraine 51% ↓ 2%p 8 8 New Delhi India 47% ↓ 9%p 9 9 Novosibirsk Russia 45% – 0%p 10 10 Bangkok Thailand 44% ↓ 9%p 11 11 Odessa Ukraine 44% ↓ 3%p 12 12 Saint Petersburg Russia 44% ↓ 5%p 13 13 Kharkiv Ukraine 43% – 0%p 14 14 Lodz Poland 42% ↓ 5%p 15 15 Lima Peru 42% ↓ 15%p 16 16 Pune India 42% ↓ 17%p 17 17 Chongqing China 42% ↑ 1%p 18 18 Bucharest Romania 42% ↓ 10%p 19 19 Tokyo Japan 41% ↓ 1%p 20 20 Samara Russia 41% ↓ 3%p
  • 4. Traffic Index 2020 # World rank City Country Congestion level 2 of 21See online ranking 21 21 Dublin Ireland 38% ↓ 10%p 22 22 Dnipro Ukraine 38% ↑ 1%p 23 23 Taipei Taiwan 37% ↑ 2%p 24 24 Recife Brazil 37% ↓ 13%p 25 25 Tel Aviv Israel 37% ↓ 9%p 26 26 Changchun China 37% ↑ 4%p 27 27 Krakow Poland 36% ↓ 9%p 28 28 Yekaterinburg Russia 36% ↓ 5%p 29 29 Mexico City Mexico 36% ↓ 16%p 30 30 Cairo Egypt 36% ↓ 4%p 31 31 Jakarta Indonesia 36% ↓ 17%p 32 32 Wroclaw Poland 35% ↓ 4%p 33 33 Osaka Japan 35% ↓ 1%p 34 34 Taichung Taiwan 35% ↑ 1%p 35 35 Taoyuan Taiwan 34% ↑ 4%p 36 36 Athens Greece 34% ↓ 9%p 37 37 Rostov-on-Don Russia 34% ↓ 2%p 38 38 Nagoya Japan 33% – 0%p 39 39 Kaohsiung Taiwan 32% ↓ 1%p 40 40 Rio de Janeiro Brazil 32% ↓ 14%p
  • 5. Traffic Index 2020 # World rank City Country Congestion level 3 of 21See online ranking 41 41 Tainan Taiwan 32% ↑ 1%p 42 42 Paris France 32% ↓ 7%p 43 43 Edinburgh United Kingdom 32% ↓ 9%p 44 44 Santiago Chile 31% ↓ 13%p 45 45 Poznan Poland 31% ↓ 13%p 46 46 Chelyabinsk Russia 31% ↓ 3%p 47 47 Warsaw Poland 31% ↓ 9%p 48 48 Fortaleza Brazil 31% ↓ 6%p 49 49 London United Kingdom 31% ↓ 7%p 50 50 Omsk Russia 31% ↓ 1%p 51 51 Salvador Brazil 30% ↓ 13%p 52 52 Vancouver Canada 30% ↓ 9%p 53 53 Sofia Bulgaria 30% ↓ 6%p 54 54 Marseille France 30% ↓ 4%p 55 55 Izmir Turkey 30% ↑ 1%p 56 56 Nizhny Novgorod Russia 30% ↓ 2%p 57 57 Hong Kong Hong Kong 30% ↓ 1%p 58 58 Berlin Germany 30% ↓ 2%p 59 59 Sao Paulo Brazil 30% ↓ 15%p 60 60 Palermo Italy 29% ↓ 7%p
  • 6. Traffic Index 2020 # World rank City Country Congestion level 4 of 21See online ranking 61 61 Hamburg Germany 29% ↓ 5%p 62 62 Geneva Switzerland 29% ↓ 4%p 63 63 Auckland New Zealand 29% ↓ 2%p 64 64 Kazan Russia 29% – 0%p 65 65 Brussels Belgium 29% ↓ 9%p 66 66 Gdansk, Gdynia and Sopot Poland 29% ↓ 4%p 67 67 Ankara Turkey 28% ↓ 4%p 68 68 Sydney Australia 28% ↓ 5%p 69 69 Chengdu China 28% ↓ 7%p 70 70 Tomsk Russia 28% ↓ 3%p 71 71 Sapporo Japan 28% ↓ 2%p 72 72 Hull United Kingdom 28% ↓ 6%p 73 73 Brighton and Hove United Kingdom 28% ↓ 7%p 74 74 Belo Horizonte Brazil 28% ↓ 7%p 75 75 Shenyang China 28% – 0%p 76 76 Limerick Ireland 28% ↓ 3%p 77 77 Kuala Lumpur Malaysia 28% ↓ 9%p 78 78 Genoa Italy 27% ↓ 3%p 79 79 Rome Italy 27% ↓ 11%p 80 80 Bydgoszcz Poland 27% ↓ 7%p
  • 7. Traffic Index 2020 # World rank City Country Congestion level 5 of 21See online ranking 81 81 Budapest Hungary 27% ↓ 10%p 82 82 Wellington New Zealand 27% ↓ 1%p 83 83 Singapore Singapore 27% ↓ 5%p 84 84 Szczecin Poland 27% ↓ 3%p 85 85 Los Angeles United States of America 27% ↓ 15%p 86 86 Zhuhai China 27% ↓ 12%p 87 87 Zurich Switzerland 27% ↓ 5%p 88 88 Bratislava Slovakia 27% ↓ 9%p 89 89 Adana Turkey 27% ↑ 1%p 90 90 Bordeaux France 27% ↓ 5%p 91 91 Lublin Poland 26% ↓ 1%p 92 92 Grenoble France 26% ↓ 6%p 93 93 Vilnius Lithuania 26% ↓ 6%p 94 94 Antalya Turkey 26% ↓ 3%p 95 95 Lugano Switzerland 26% ↓ 5%p 96 96 Changsha China 26% ↓ 9%p 97 97 Toulon France 26% ↓ 3%p 98 98 Tallinn Estonia 26% ↓ 5%p 99 99 Vienna Austria 26% ↓ 2%p 100 100 Cork Ireland 26% ↓ 7%p
  • 8. Traffic Index 2020 # World rank City Country Congestion level 6 of 21See online ranking 101 101 Wiesbaden Germany 26% ↓ 6%p 102 102 New York United States of America 26% ↓ 11%p 103 103 Kobe Japan 26% – 0%p 104 104 Belfast United Kingdom 25% ↓ 8%p 105 105 Bursa Turkey 25% – 0%p 106 106 Luxembourg Luxembourg 25% ↓ 11%p 107 107 Nuremberg Germany 25% ↓ 5%p 108 108 Messina Italy 25% ↓ 6%p 109 109 Nice France 25% ↓ 6%p 110 110 Haarlem Netherlands 25% ↓ 2%p 111 111 Stuttgart Germany 25% ↓ 5%p 112 112 Bournemouth United Kingdom 25% ↓ 9%p 113 113 Lyon France 25% ↓ 5%p 114 114 Reading United Kingdom 25% ↓ 7%p 115 115 Naples Italy 25% ↓ 7%p 116 116 Shijiazhuang China 25% ↓ 1%p 117 117 Beijing China 24% ↓ 13%p 118 118 Hamilton New Zealand 24% ↓ 1%p 119 119 Porto Alegre Brazil 24% ↓ 11%p 120 120 Kassel Germany 24% ↓ 4%p
  • 9. Traffic Index 2020 # World rank City Country Congestion level 7 of 21See online ranking 121 121 Southampton United Kingdom 24% ↓ 9%p 122 122 Montpellier France 24% ↓ 2%p 123 123 Buenos Aires Argentina 24% ↓ 11%p 124 124 Antwerp Belgium 24% ↓ 8%p 125 125 Guangzhou China 24% ↓ 16%p 126 126 Porto Portugal 24% ↓ 7%p 127 127 The Hague Netherlands 24% ↓ 4%p 128 128 Gaziantep Turkey 24% ↑ 1%p 129 129 Munich Germany 24% ↓ 6%p 130 130 Liverpool United Kingdom 23% ↓ 5%p 131 131 Shenzhen China 23% ↓ 14%p 132 132 Cape Town South Africa 23% ↓ 9%p 133 133 Dresden Germany 23% ↓ 2%p 134 134 Mersin Turkey 23% – 0%p 135 135 Nanjing China 23% ↓ 7%p 136 136 Catania Italy 23% ↓ 6%p 137 137 Prague Czechia 23% ↓ 6%p 138 138 Melbourne Australia 23% ↓ 7%p 139 139 Lisbon Portugal 23% ↓ 10%p 140 140 Bari Italy 23% ↓ 5%p
  • 10. Traffic Index 2020 # World rank City Country Congestion level 8 of 21See online ranking 141 141 Miami United States of America 23% ↓ 8%p 142 142 Stockholm Sweden 23% ↓ 4%p 143 143 Milan Italy 23% ↓ 8%p 144 144 Graz Austria 23% ↓ 3%p 145 145 Bristol United Kingdom 23% ↓ 10%p 146 146 Kiel Germany 23% ↓ 3%p 147 147 Kosice Slovakia 23% ↓ 3%p 148 148 Salzburg Austria 23% ↓ 4%p 149 149 Leipzig Germany 23% ↓ 1%p 150 150 Portsmouth United Kingdom 22% ↓ 4%p 151 151 Xiamen China 22% ↓ 9%p 152 152 Shanghai China 22% ↓ 9%p 153 153 Leicester United Kingdom 22% ↓ 10%p 154 154 Bialystok Poland 22% ↓ 4%p 155 155 Thessaloniki Greece 22% ↓ 8%p 156 156 Manchester United Kingdom 22% ↓ 11%p 157 157 Nottingham United Kingdom 22% ↓ 5%p 158 158 Brisbane Australia 22% ↓ 3%p 159 159 Basel Switzerland 22% ↓ 4%p 160 160 Lausanne Switzerland 22% ↓ 5%p
  • 11. Traffic Index 2020 # World rank City Country Congestion level 9 of 21See online ranking 161 161 Riga Latvia 22% ↓ 5%p 162 162 Strasbourg France 22% ↓ 6%p 163 163 Riyadh Saudi Arabia 22% ↓ 2%p 164 164 Barcelona Spain 22% ↓ 7%p 165 165 Nantes France 22% ↓ 5%p 166 166 East London South Africa 22% – 0%p 167 167 Brno Czechia 22% ↓ 8%p 168 168 Toronto Canada 22% ↓ 11%p 169 169 San Francisco United States of America 21% ↓ 15%p 170 170 Reggio Calabria Italy 21% ↓ 6%p 171 171 Christchurch New Zealand 21% – 0%p 172 172 Tianjin China 21% ↓ 2%p 173 173 Clermont-Ferrand France 21% ↓ 5%p 174 174 Nijmegen Netherlands 21% ↓ 6%p 175 175 Brest France 21% ↓ 2%p 176 176 Leiden Netherlands 21% ↓ 9%p 177 177 Toulouse France 21% ↓ 7%p 178 178 Cardiff United Kingdom 21% ↓ 9%p 179 179 Gold Coast Australia 21% ↓ 3%p 180 180 Bonn Germany 21% ↓ 8%p
  • 12. Traffic Index 2020 # World rank City Country Congestion level 10 of 21See online ranking 181 181 Leuven Belgium 21% ↑ 1%p 182 182 Johannesburg South Africa 21% ↓ 9%p 183 183 Tauranga New Zealand 21% ↑ 1%p 184 184 Adelaide Australia 21% ↓ 3%p 185 185 Cologne Germany 21% ↓ 5%p 186 186 Curitiba Brazil 21% ↓ 7%p 187 187 Hobart Australia 20% ↓ 3%p 188 188 Frankfurt am Main Germany 20% ↓ 7%p 189 189 Turin Italy 20% ↓ 7%p 190 190 Hangzhou China 20% ↓ 8%p 191 191 Groningen Netherlands 20% ↓ 4%p 192 192 Baton Rouge United States of America 20% ↓ 6%p 193 193 Granada Spain 20% ↓ 5%p 194 194 Freiburg Germany 20% ↓ 3%p 195 195 Montreal Canada 20% ↓ 9%p 196 196 Rennes France 20% ↓ 4%p 197 197 Apeldoorn Netherlands 20% – 0%p 198 198 Fuzhou China 20% ↓ 8%p 199 199 Lille France 20% ↓ 5%p 200 200 Oslo Norway 20% ↓ 2%p
  • 13. Traffic Index 2020 # World rank City Country Congestion level 11 of 21See online ranking 201 201 Le Havre France 20% ↓ 1%p 202 202 Pretoria South Africa 20% ↓ 5%p 203 203 Swansea United Kingdom 20% ↓ 6%p 204 204 Glasgow United Kingdom 20% ↓ 5%p 205 205 Mons Belgium 20% ↓ 14%p 206 206 Ruhr region west Germany 20% ↓ 3%p 207 207 Aarhus Denmark 20% ↓ 2%p 208 208 Sheffield United Kingdom 20% ↓ 8%p 209 209 Bremen Germany 19% ↓ 8%p 210 210 Birmingham-Wolverhampton United Kingdom 19% ↓ 9%p 211 211 Leeds-Bradford United Kingdom 19% ↓ 8%p 212 212 Newcastle-Sunderland United Kingdom 19% ↓ 6%p 213 213 San Jose United States of America 19% ↓ 14%p 214 214 Rotterdam Netherlands 19% ↓ 6%p 215 215 Dunedin New Zealand 19% ↓ 1%p 216 216 Augsburg Germany 19% ↓ 3%p 217 217 Cape Coral-Fort Myers United States of America 19% ↓ 2%p 218 218 Arnhem Netherlands 19% ↓ 7%p 219 219 Perth Australia 19% ↓ 1%p 220 220 Seattle United States of America 19% ↓ 12%p
  • 14. Traffic Index 2020 # World rank City Country Congestion level 12 of 21See online ranking 221 221 Newcastle Australia 19% ↓ 1%p 222 222 Honolulu United States of America 19% ↓ 9%p 223 223 Stoke-on-Trent United Kingdom 19% ↓ 9%p 224 224 Munster Germany 19% ↓ 2%p 225 225 Ottawa Canada 19% ↓ 10%p 226 226 Cagliari Italy 19% ↓ 4%p 227 227 Hannover Germany 19% ↓ 2%p 228 228 Breda Netherlands 19% ↓ 2%p 229 229 Dusseldorf Germany 19% ↓ 5%p 230 230 Dubai United Arab Emirates 19% ↓ 2%p 231 231 Karlsruhe Germany 19% ↓ 3%p 232 232 Uppsala Sweden 19% ↓ 2%p 233 233 Tilburg Netherlands 19% ↓ 1%p 234 234 Riverside United States of America 19% ↓ 7%p 235 235 Wuxi China 18% ↓ 1%p 236 236 Rouen France 18% ↓ 4%p 237 237 Bakersfield United States of America 18% ↓ 3%p 238 238 Amsterdam Netherlands 18% ↓ 8%p 239 239 Tampa United States of America 18% ↓ 6%p 240 240 Middlesbrough United Kingdom 18% ↓ 2%p
  • 15. Traffic Index 2020 # World rank City Country Congestion level 13 of 21See online ranking 241 241 Eindhoven Netherlands 18% ↓ 4%p 242 242 Mannheim Germany 18% ↓ 3%p 243 243 Santa Cruz de Tenerife Spain 18% ↓ 5%p 244 244 Trieste Italy 18% ↓ 3%p 245 245 Austin United States of America 18% ↓ 9%p 246 246 Orleans France 18% ↓ 2%p 247 247 Ruhr region east Germany 18% ↓ 3%p 248 248 London Canada 18% ↓ 5%p 249 249 Copenhagen Denmark 18% ↓ 4%p 250 250 Ghent Belgium 18% ↓ 2%p 251 251 Fresno United States of America 18% ↓ 3%p 252 252 Monchengladbach Germany 18% ↓ 4%p 253 253 Prato Italy 18% ↓ 6%p 254 254 Bologna Italy 18% ↓ 7%p 255 255 Jeddah Saudi Arabia 18% ↓ 1%p 256 256 Bern Switzerland 18% ↓ 2%p 257 257 Nancy France 18% ↓ 3%p 258 258 Sacramento United States of America 18% ↓ 7%p 259 259 Boise United States of America 18% ↓ 3%p 260 260 Bielsko-Biala Poland 18% ↓ 3%p
  • 16. Traffic Index 2020 # World rank City Country Congestion level 14 of 21See online ranking 261 261 Turku Finland 18% ↓ 1%p 262 262 Quanzhou China 17% ↓ 6%p 263 263 Ljubljana Slovenia 17% ↓ 9%p 264 264 Coventry United Kingdom 17% ↓ 8%p 265 265 Pescara Italy 17% ↓ 6%p 266 266 Atlanta United States of America 17% ↓ 9%p 267 267 Kuwait City Kuwait 17% ↓ 8%p 268 268 New Orleans United States of America 17% ↓ 5%p 269 269 Linz Austria 17% ↓ 5%p 270 270 Florence Italy 17% ↓ 8%p 271 271 Valencia Spain 17% ↓ 3%p 272 272 Livorno Italy 17% ↓ 3%p 273 273 Washington United States of America 17% ↓ 12%p 274 274 Saint-Etienne France 17% ↓ 3%p 275 275 Chicago United States of America 17% ↓ 11%p 276 276 Orlando United States of America 17% ↓ 5%p 277 277 Charleston United States of America 17% ↓ 5%p 278 278 Innsbruck Austria 17% ↓ 6%p 279 279 Konya Turkey 17% ↓ 1%p 280 280 Avignon France 17% ↓ 1%p
  • 17. Traffic Index 2020 # World rank City Country Congestion level 15 of 21See online ranking 281 281 Philadelphia United States of America 17% ↓ 7%p 282 282 Halifax Canada 17% ↓ 8%p 283 283 San Diego United States of America 17% ↓ 9%p 284 284 Winnipeg Canada 17% ↓ 5%p 285 285 Bielefeld Germany 17% ↓ 1%p 286 286 Ningbo China 17% ↓ 7%p 287 287 Portland United States of America 16% ↓ 10%p 288 288 Zwolle Netherlands 16% ↓ 2%p 289 289 Verona Italy 16% ↓ 4%p 290 290 Las Vegas United States of America 16% ↓ 5%p 291 291 Suzhou China 16% ↓ 4%p 292 292 Reykjavik Iceland 16% ↓ 2%p 293 293 Amersfoort Netherlands 16% ↓ 4%p 294 294 Palma de Mallorca Spain 16% ↓ 8%p 295 295 Houston United States of America 16% ↓ 8%p 296 296 Tucson United States of America 16% ↓ 3%p 297 297 Wuppertal Germany 16% ↓ 1%p 298 298 Preston United Kingdom 16% ↓ 7%p 299 299 Santander Spain 16% ↓ 1%p 300 300 Murcia Spain 16% ↓ 5%p
  • 18. Traffic Index 2020 # World rank City Country Congestion level 16 of 21See online ranking 301 301 Taranto Italy 16% ↓ 4%p 302 302 Liege Belgium 16% ↓ 8%p 303 303 Kayseri Turkey 16% ↓ 1%p 304 304 Brasilia Brazil 16% ↓ 5%p 305 305 Namur Belgium 16% ↓ 3%p 306 306 Durban South Africa 16% ↓ 3%p 307 307 McAllen United States of America 16% ↓ 3%p 308 308 Wuhan China 16% ↓ 11%p 309 309 Dijon France 16% ↓ 1%p 310 310 Katowice urban area Poland 16% ↓ 3%p 311 311 Le Mans France 16% ↓ 2%p 312 312 A Coruna Spain 15% ↓ 4%p 313 313 Kortrijk Belgium 15% – 0%p 314 314 Las Palmas Spain 15% ↓ 3%p 315 315 Utrecht Netherlands 15% ↓ 7%p 316 316 Madrid Spain 15% ↓ 8%p 317 317 Odense Denmark 15% ↓ 3%p 318 318 Seville Spain 15% ↓ 6%p 319 319 Canberra Australia 15% ↓ 2%p 320 320 Braga Portugal 15% ↓ 3%p
  • 19. Traffic Index 2020 # World rank City Country Congestion level 17 of 21See online ranking 321 321 Nashville United States of America 15% ↓ 11%p 322 322 Tours France 15% ↓ 1%p 323 323 Helsinki Finland 15% ↓ 4%p 324 324 Malaga Spain 15% ↓ 5%p 325 325 Boston United States of America 15% ↓ 11%p 326 326 Denver United States of America 15% ↓ 8%p 327 327 Reims France 15% ↓ 1%p 328 328 Pamplona Spain 15% ↓ 1%p 329 329 Gothenburg Sweden 14% ↓ 4%p 330 330 Quebec Canada 14% ↓ 8%p 331 331 Ravenna Italy 14% ↓ 3%p 332 332 Providence United States of America 14% ↓ 6%p 333 333 Oxnard-Thousand Oaks-Ventura United States of America 14% ↓ 4%p 334 334 Parma Italy 14% ↓ 3%p 335 335 Vitoria-Gasteiz Spain 14% – 0%p 336 336 Reggio Emilia Italy 14% ↓ 4%p 337 337 Alicante Spain 14% ↓ 4%p 338 338 Greenville United States of America 14% ↓ 4%p 339 339 Malmo Sweden 14% ↓ 1%p 340 340 Pittsburgh United States of America 14% ↓ 7%p
  • 20. Traffic Index 2020 # World rank City Country Congestion level 18 of 21See online ranking 341 341 Wollongong Australia 14% ↑ 1%p 342 342 Colorado Springs United States of America 14% ↓ 3%p 343 343 Albuquerque United States of America 14% ↓ 3%p 344 344 Edmonton Canada 13% ↓ 3%p 345 345 Tampere Finland 13% ↓ 2%p 346 346 Dallas-Fort Worth United States of America 13% ↓ 6%p 347 347 Ostrava Czechia 13% ↓ 7%p 348 348 Jacksonville United States of America 13% ↓ 4%p 349 349 Salt Lake City United States of America 13% ↓ 6%p 350 350 Den Bosch Netherlands 13% ↓ 4%p 351 351 Phoenix United States of America 13% ↓ 5%p 352 352 Zaragoza Spain 13% ↓ 1%p 353 353 Bergen Norway 13% ↓ 2%p 354 354 Charlotte United States of America 13% ↓ 6%p 355 355 Vigo Spain 13% ↓ 2%p 356 356 Calgary Canada 13% ↓ 5%p 357 357 Virginia Beach United States of America 13% ↓ 3%p 358 358 San Antonio United States of America 13% ↓ 6%p 359 359 Dongguan China 13% ↓ 9%p 360 360 Gijon Spain 13% ↓ 3%p
  • 21. Traffic Index 2020 # World rank City Country Congestion level 19 of 21See online ranking 361 361 Valladolid Spain 13% – 0%p 362 362 Padua Italy 13% ↓ 4%p 363 363 Bruges Belgium 12% ↓ 4%p 364 364 Coimbra Portugal 12% ↓ 3%p 365 365 Trondheim Norway 12% ↓ 3%p 366 366 El Paso United States of America 12% ↓ 4%p 367 367 Cartagena Spain 12% ↓ 2%p 368 368 New Haven United States of America 12% ↓ 4%p 369 369 Kitchener-Waterloo Canada 12% ↓ 4%p 370 370 Cordoba Spain 12% ↓ 2%p 371 371 Modena Italy 12% ↓ 2%p 372 372 Baltimore United States of America 12% ↓ 8%p 373 373 Raleigh United States of America 12% ↓ 6%p 374 374 Charleroi Belgium 12% ↓ 1%p 375 375 Funchal Portugal 12% ↓ 5%p 376 376 Bilbao Spain 12% ↓ 1%p 377 377 Oklahoma City United States of America 12% ↓ 2%p 378 378 Birmingham United States of America 12% ↓ 6%p 379 379 Stavanger Norway 12% ↓ 1%p 380 380 Hamilton Canada 12% ↓ 7%p
  • 22. Traffic Index 2020 # World rank City Country Congestion level 20 of 21See online ranking 381 381 Cincinnati United States of America 12% ↓ 4%p 382 382 Brescia Italy 11% ↓ 3%p 383 383 Louisville United States of America 11% ↓ 4%p 384 384 Memphis United States of America 11% ↓ 4%p 385 385 San Sebastian Spain 11% ↓ 3%p 386 386 Allentown United States of America 11% ↓ 4%p 387 387 Oviedo Spain 11% ↓ 2%p 388 388 Bloemfontein South Africa 11% ↓ 2%p 389 389 Columbus United States of America 11% ↓ 5%p 390 390 Tulsa United States of America 11% ↓ 2%p 391 391 Detroit United States of America 11% ↓ 5%p 392 392 Hartford United States of America 11% ↓ 6%p 393 393 Buffalo United States of America 10% ↓ 5%p 394 394 Columbia United States of America 10% ↓ 3%p 395 395 Albany United States of America 10% ↓ 6%p 396 396 Omaha-Council Bluffs United States of America 10% ↓ 4%p 397 397 Knoxville United States of America 10% ↓ 2%p 398 398 Grand Rapids United States of America 10% ↓ 6%p 399 399 Abu Dhabi United Arab Emirates 10% – 0%p 400 400 Almere Netherlands 10% – 0%p
  • 23. Traffic Index 2020 # World rank City Country Congestion level 21 of 21See online ranking 401 401 Rochester United States of America 10% ↓ 4%p 402 402 Worcester United States of America 9% ↓ 6%p 403 403 St. Louis United States of America 9% ↓ 5%p 404 404 Cleveland United States of America 9% ↓ 3%p 405 405 Richmond United States of America 9% ↓ 3%p 406 406 Milwaukee United States of America 9% ↓ 4%p 407 407 Indianapolis United States of America 9% ↓ 5%p 408 408 Minneapolis United States of America 9% ↓ 8%p 409 409 Kansas City United States of America 9% ↓ 3%p 410 410 Syracuse United States of America 8% ↓ 2%p 411 411 Dayton United States of America 8% ↓ 2%p 412 412 Little Rock United States of America 8% ↓ 3%p 413 413 Winston-Salem United States of America 8% ↓ 4%p 414 414 Cadiz Spain 8% ↓ 2%p 415 415 Akron United States of America 8% ↓ 2%p 416 416 Greensboro-High Point United States of America 7% ↓ 2%p