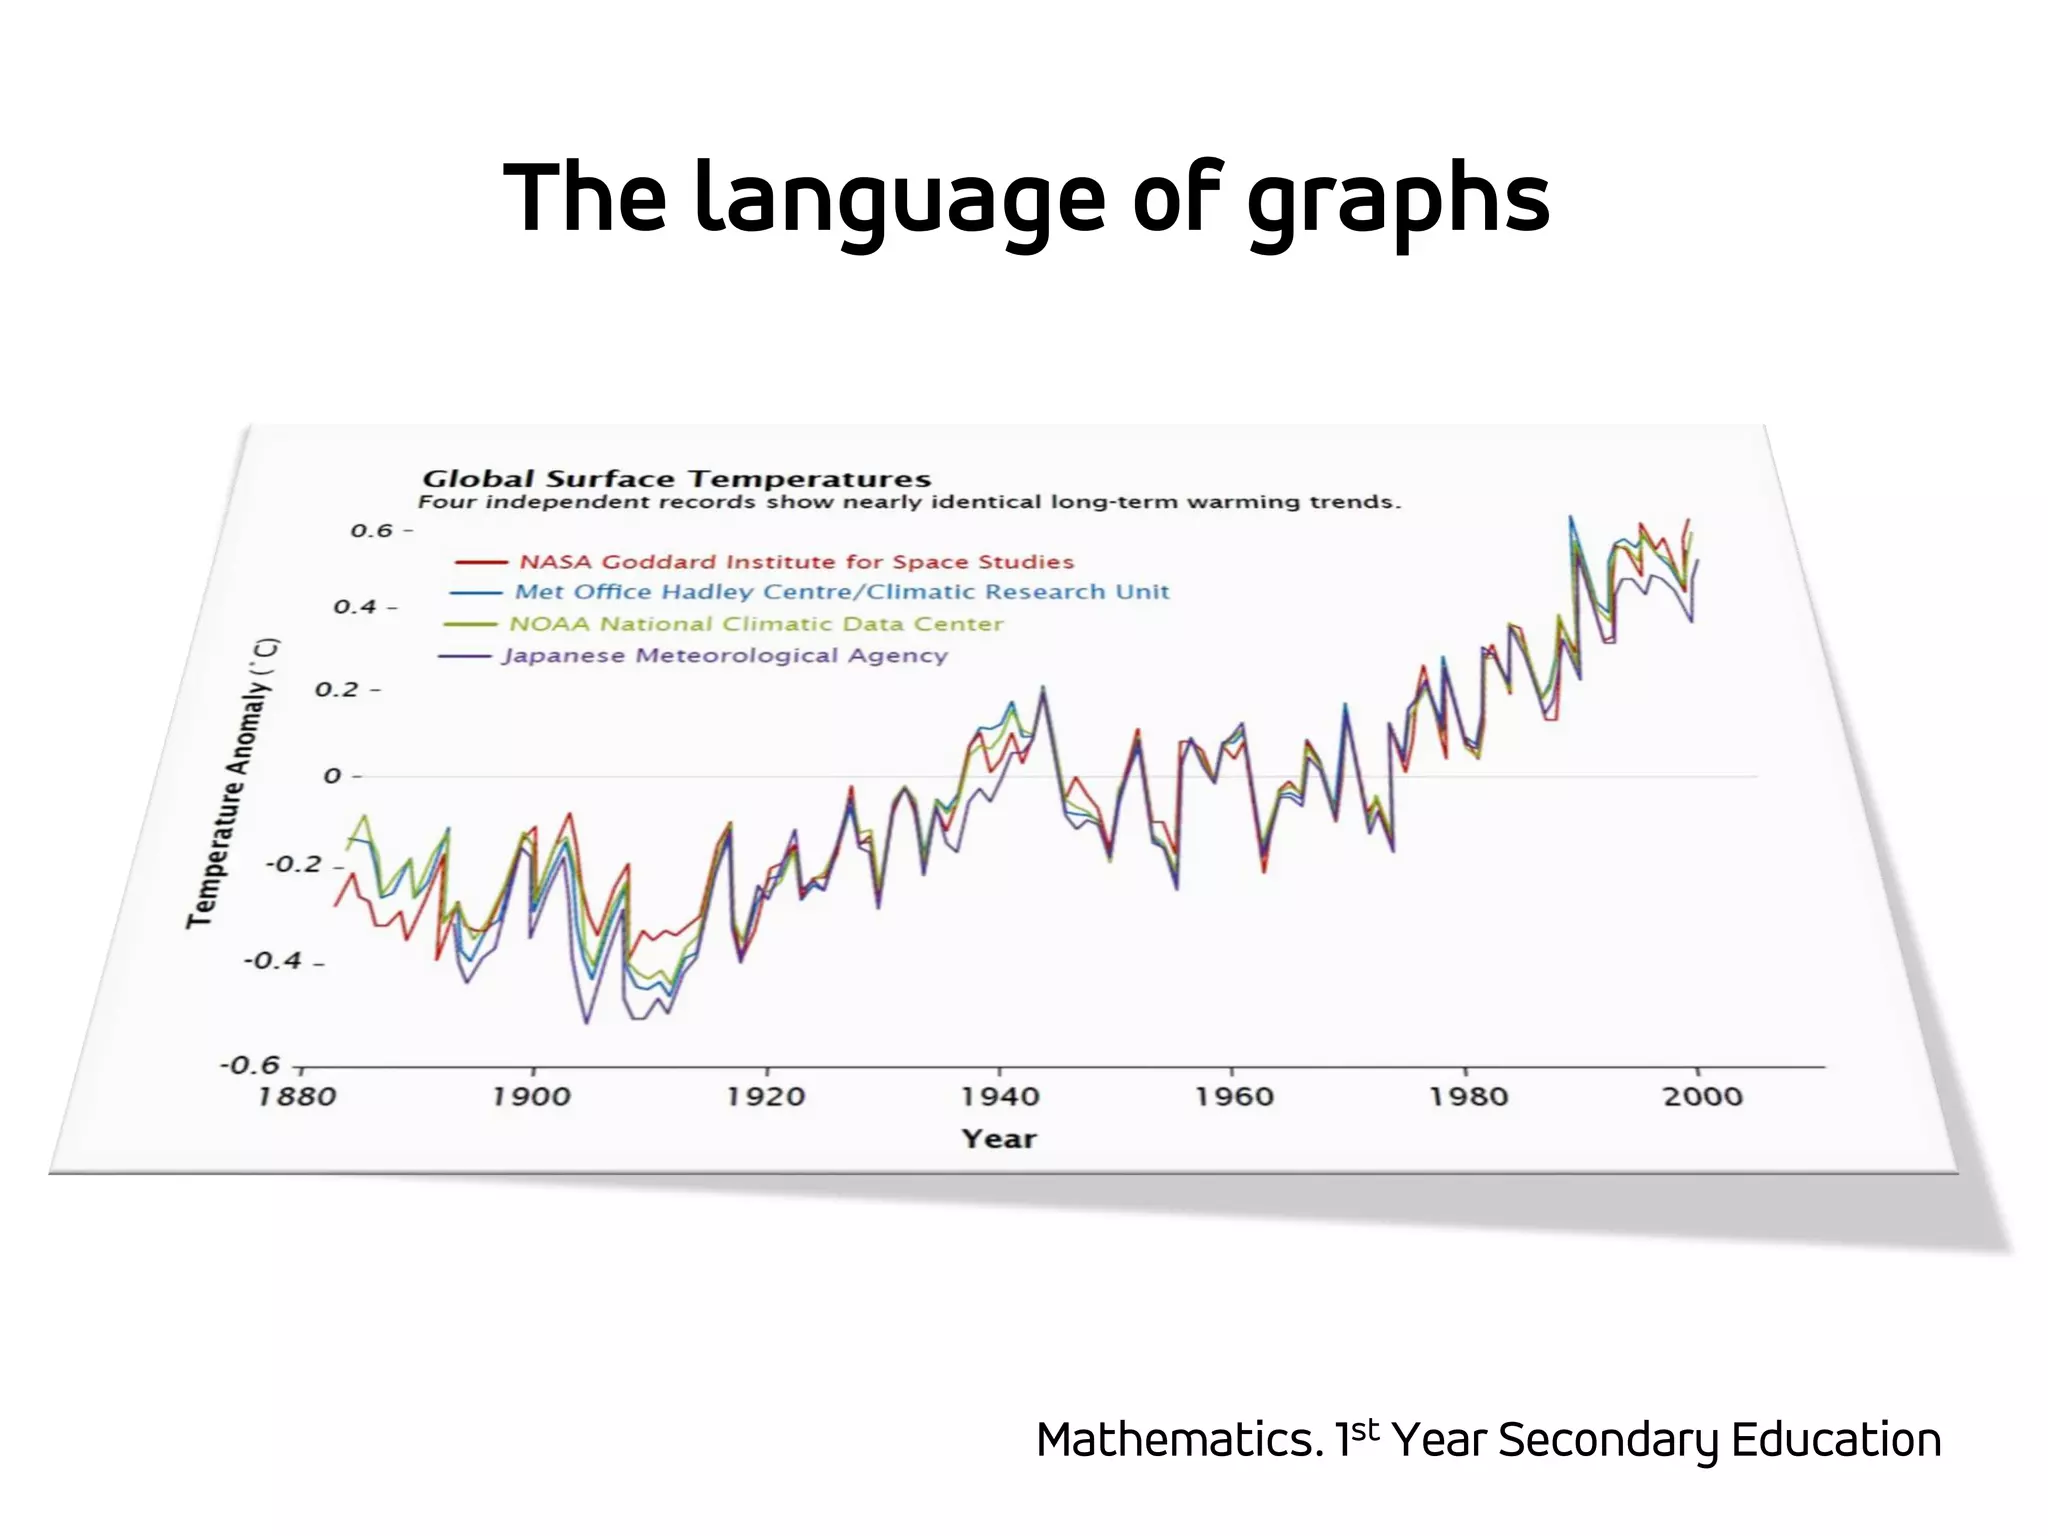
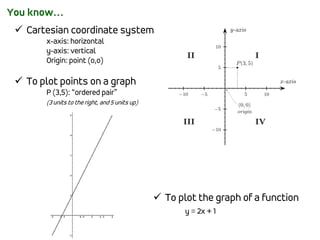
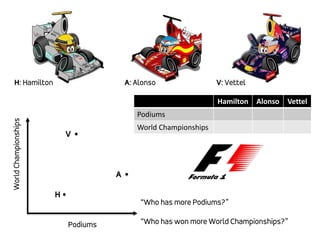
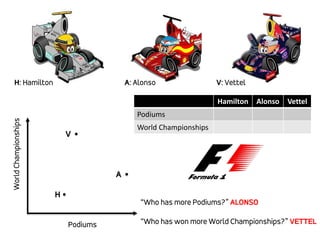
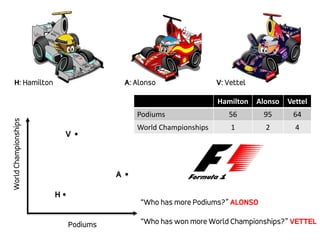
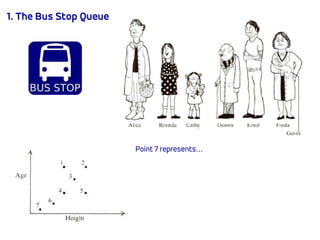
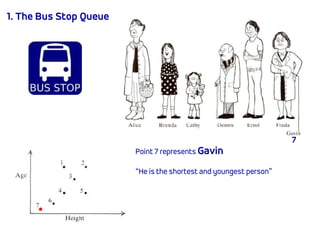
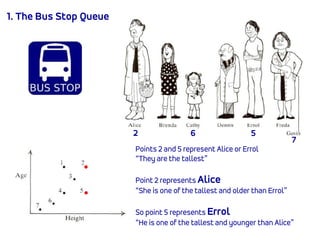
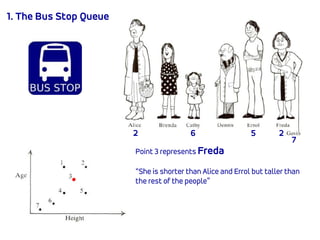
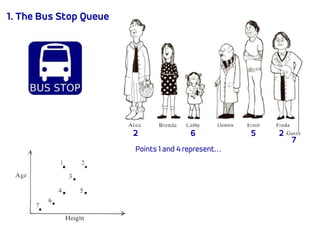
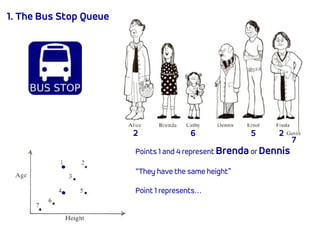
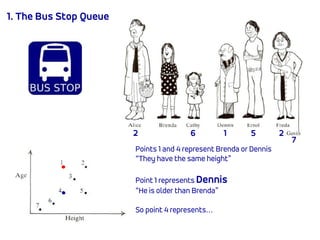
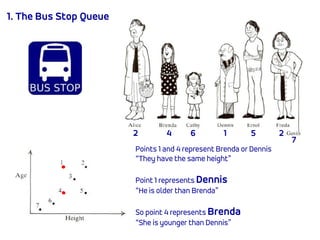
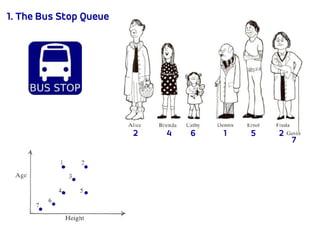
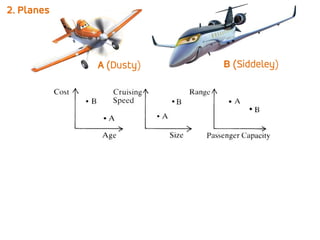
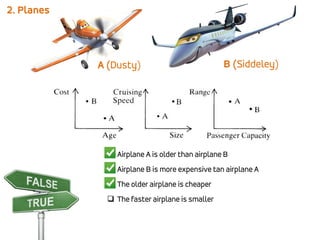
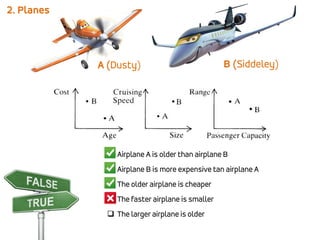
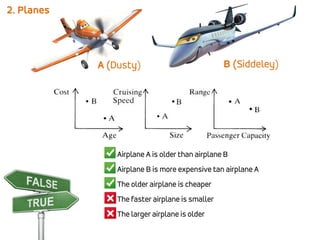
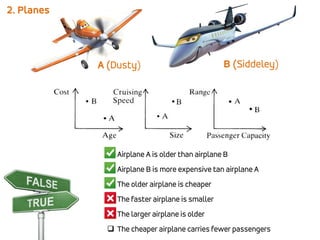
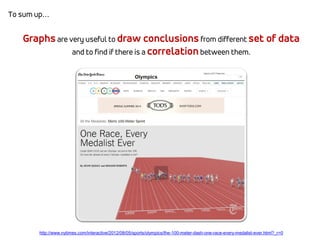
The language of graphs
Mathematics. 1st Year Secondary Education
You know…
 Cartesian coordinate system
x-axis: horizontal
y-axis: vertical
Origin: point (o,o)
 To plot points on a graph
P (3,5): “ordered pair”
(3 units to the right, and 5 units up)
 To plot the graph of a function
y = 2x + 1
“You have to be able to understand the
qualitative meaning
of a graph”
“Let’s practice together…”
Hamilton Alonso Vettel
Podiums
World Championships
Podiums
WorldChampionships
A
H
V
“Who has more Podiums?”
“Who has won more World Championships?”
H: Hamilton A: Alonso V: Vettel
Hamilton Alonso Vettel
Podiums
World Championships
Podiums
WorldChampionships
A
H
V
“Who has more Podiums?” ALONSO
“Who has won more World Championships?” VETTEL
H: Hamilton A: Alonso V: Vettel
Hamilton Alonso Vettel
Podiums 56 95 64
World Championships 1 2 4
Podiums
WorldChampionships
A
H
V
“Who has more Podiums?” ALONSO
“Who has won more World Championships?” VETTEL
H: Hamilton A: Alonso V: Vettel
1. The Bus Stop Queue
Point 7 represents…
1. The Bus Stop Queue
Point 7 represents Gavin
“He is the shortest and youngest person”
7
1. The Bus Stop Queue
Point 6 represents…
7
1. The Bus Stop Queue
Point 6 represents Cathy
“She is taller than Gavin but shorter than the rest of
the people”
7
6
1. The Bus Stop Queue
Points 2 and 5 represent…
7
6
1. The Bus Stop Queue
Points 2 and 5 represent Alice or Errol
“They are the tallest”
Point 2 represents…
7
6
1. The Bus Stop Queue
Points 2 and 5 represent Alice or Errol
“They are the tallest”
Point 2 represents Alice
“She is one of the tallest and older than Errol”
So point 5 represents…
7
62
1. The Bus Stop Queue
Points 2 and 5 represent Alice or Errol
“They are the tallest”
Point 2 represents Alice
“She is one of the tallest and older than Errol”
So point 5 represents Errol
“He is one of the tallest and younger than Alice”
7
62 5
1. The Bus Stop Queue
Point 3 represents…
7
62 5
1. The Bus Stop Queue
Point 3 represents Freda
“She is shorter than Alice and Errol but taller than
the rest of the people”
7
62 25
1. The Bus Stop Queue
Points 1 and 4 represent…
7
62 5 2
1. The Bus Stop Queue
Points 1 and 4 represent Brendaor Dennis
“They have the same height”
Point 1 represents…
7
62 5 2
1. The Bus Stop Queue
Points 1 and 4 represent Brenda or Dennis
“They have the same height”
Point 1 represents Dennis
“He is older than Brenda”
So point 4 represents…
7
62 5 21
1. The Bus Stop Queue
Points 1 and 4 represent Brenda or Dennis
“They have the same height”
Point 1 represents Dennis
“He is older than Brenda”
So point 4 represents Brenda
“She is younger than Dennis”
7
62 5 214
1. The Bus Stop Queue
7
62 5 214
2. Planes
A (Dusty) B (Siddeley)
2. Planes
A (Dusty) B (Siddeley)
 Airplane A is older than airplane B
2. Planes
A (Dusty) B (Siddeley)
 Airplane A is older than airplane B
 Airplane B is more expensive than airplane A
2. Planes
A (Dusty) B (Siddeley)
 Airplane A is older than airplane B
 Airplane B is more expensive tan airplane A
 The older airplane is cheaper
2. Planes
A (Dusty) B (Siddeley)
 Airplane A is older than airplane B
 Airplane B is more expensive tan airplane A
 The older airplane is cheaper
2. Planes
A (Dusty) B (Siddeley)
 Airplane A is older than airplane B
 Airplane B is more expensive tan airplane A
 The older airplane is cheaper
 The faster airplane is smaller
2. Planes
A (Dusty) B (Siddeley)
 Airplane A is older than airplane B
 Airplane B is more expensive tan airplane A
 The older airplane is cheaper
 The faster airplane is smaller
2. Planes
A (Dusty) B (Siddeley)
 Airplane A is older than airplane B
 Airplane B is more expensive tan airplane A
 The older airplane is cheaper
 The faster airplane is smaller
 The larger airplane is older
2. Planes
A (Dusty) B (Siddeley)
 Airplane A is older than airplane B
 Airplane B is more expensive tan airplane A
 The older airplane is cheaper
 The faster airplane is smaller
 The larger airplane is older
2. Planes
A (Dusty) B (Siddeley)
 Airplane A is older than airplane B
 Airplane B is more expensive tan airplane A
 The older airplane is cheaper
 The faster airplane is smaller
 The larger airplane is older
 The cheaper airplane carries fewer passengers
2. Planes
A (Dusty) B (Siddeley)
 Airplane A is older than airplane B
 Airplane B is more expensive tan airplane A
 The older airplane is cheaper
 The faster airplane is smaller
 The larger airplane is older
 The cheaper airplane carries fewer passengers
2. Planes
A (Dusty) B (Siddeley)
3. Which Graph?
The 100 metres race.
The men's world record is
9.58 seconds, set by Usain Bolt
0,00
2,00
4,00
6,00
8,00
10,00
12,00
0 50 100 150SPEED
DISTANCE
GRAPH 3
0
2
4
6
8
10
12
0 50 100 150
SPEED
DISTANCE
GRAPH 1
0
2
4
6
8
10
12
0 50 100 150
SPEED
DISTANCE
GRAPH 2
0,00
2,00
4,00
6,00
8,00
10,00
12,00
0 20 40 60 80 100 120 140
SPEED
DISTANCE
GRAPH 3
3. Which Graph?
To sum up…
Graphsare very useful to draw conclusionsfrom different set of data
and to find if there is a correlation between them.
http://www.nytimes.com/interactive/2012/08/05/sports/olympics/the-100-meter-dash-one-race-every-medalist-ever.html?_r=0
The language of graphs
Mathematics. 1st Year Secondary Education

The language of Graphs - Presentation

  • 1.
    The language ofgraphs Mathematics. 1st Year Secondary Education
  • 2.
    You know…  Cartesiancoordinate system x-axis: horizontal y-axis: vertical Origin: point (o,o)  To plot points on a graph P (3,5): “ordered pair” (3 units to the right, and 5 units up)  To plot the graph of a function y = 2x + 1
  • 3.
    “You have tobe able to understand the qualitative meaning of a graph” “Let’s practice together…”
  • 4.
    Hamilton Alonso Vettel Podiums WorldChampionships Podiums WorldChampionships A H V “Who has more Podiums?” “Who has won more World Championships?” H: Hamilton A: Alonso V: Vettel
  • 5.
    Hamilton Alonso Vettel Podiums WorldChampionships Podiums WorldChampionships A H V “Who has more Podiums?” ALONSO “Who has won more World Championships?” VETTEL H: Hamilton A: Alonso V: Vettel
  • 6.
    Hamilton Alonso Vettel Podiums56 95 64 World Championships 1 2 4 Podiums WorldChampionships A H V “Who has more Podiums?” ALONSO “Who has won more World Championships?” VETTEL H: Hamilton A: Alonso V: Vettel
  • 7.
    1. The BusStop Queue Point 7 represents…
  • 8.
    1. The BusStop Queue Point 7 represents Gavin “He is the shortest and youngest person” 7
  • 9.
    1. The BusStop Queue Point 6 represents… 7
  • 10.
    1. The BusStop Queue Point 6 represents Cathy “She is taller than Gavin but shorter than the rest of the people” 7 6
  • 11.
    1. The BusStop Queue Points 2 and 5 represent… 7 6
  • 12.
    1. The BusStop Queue Points 2 and 5 represent Alice or Errol “They are the tallest” Point 2 represents… 7 6
  • 13.
    1. The BusStop Queue Points 2 and 5 represent Alice or Errol “They are the tallest” Point 2 represents Alice “She is one of the tallest and older than Errol” So point 5 represents… 7 62
  • 14.
    1. The BusStop Queue Points 2 and 5 represent Alice or Errol “They are the tallest” Point 2 represents Alice “She is one of the tallest and older than Errol” So point 5 represents Errol “He is one of the tallest and younger than Alice” 7 62 5
  • 15.
    1. The BusStop Queue Point 3 represents… 7 62 5
  • 16.
    1. The BusStop Queue Point 3 represents Freda “She is shorter than Alice and Errol but taller than the rest of the people” 7 62 25
  • 17.
    1. The BusStop Queue Points 1 and 4 represent… 7 62 5 2
  • 18.
    1. The BusStop Queue Points 1 and 4 represent Brendaor Dennis “They have the same height” Point 1 represents… 7 62 5 2
  • 19.
    1. The BusStop Queue Points 1 and 4 represent Brenda or Dennis “They have the same height” Point 1 represents Dennis “He is older than Brenda” So point 4 represents… 7 62 5 21
  • 20.
    1. The BusStop Queue Points 1 and 4 represent Brenda or Dennis “They have the same height” Point 1 represents Dennis “He is older than Brenda” So point 4 represents Brenda “She is younger than Dennis” 7 62 5 214
  • 21.
    1. The BusStop Queue 7 62 5 214
  • 22.
    2. Planes A (Dusty)B (Siddeley)
  • 23.
    2. Planes A (Dusty)B (Siddeley)  Airplane A is older than airplane B
  • 24.
    2. Planes A (Dusty)B (Siddeley)  Airplane A is older than airplane B  Airplane B is more expensive than airplane A
  • 25.
    2. Planes A (Dusty)B (Siddeley)  Airplane A is older than airplane B  Airplane B is more expensive tan airplane A  The older airplane is cheaper
  • 26.
    2. Planes A (Dusty)B (Siddeley)  Airplane A is older than airplane B  Airplane B is more expensive tan airplane A  The older airplane is cheaper
  • 27.
    2. Planes A (Dusty)B (Siddeley)  Airplane A is older than airplane B  Airplane B is more expensive tan airplane A  The older airplane is cheaper  The faster airplane is smaller
  • 28.
    2. Planes A (Dusty)B (Siddeley)  Airplane A is older than airplane B  Airplane B is more expensive tan airplane A  The older airplane is cheaper  The faster airplane is smaller
  • 29.
    2. Planes A (Dusty)B (Siddeley)  Airplane A is older than airplane B  Airplane B is more expensive tan airplane A  The older airplane is cheaper  The faster airplane is smaller  The larger airplane is older
  • 30.
    2. Planes A (Dusty)B (Siddeley)  Airplane A is older than airplane B  Airplane B is more expensive tan airplane A  The older airplane is cheaper  The faster airplane is smaller  The larger airplane is older
  • 31.
    2. Planes A (Dusty)B (Siddeley)  Airplane A is older than airplane B  Airplane B is more expensive tan airplane A  The older airplane is cheaper  The faster airplane is smaller  The larger airplane is older  The cheaper airplane carries fewer passengers
  • 32.
    2. Planes A (Dusty)B (Siddeley)  Airplane A is older than airplane B  Airplane B is more expensive tan airplane A  The older airplane is cheaper  The faster airplane is smaller  The larger airplane is older  The cheaper airplane carries fewer passengers
  • 33.
    2. Planes A (Dusty)B (Siddeley)
  • 34.
    3. Which Graph? The100 metres race. The men's world record is 9.58 seconds, set by Usain Bolt 0,00 2,00 4,00 6,00 8,00 10,00 12,00 0 50 100 150SPEED DISTANCE GRAPH 3 0 2 4 6 8 10 12 0 50 100 150 SPEED DISTANCE GRAPH 1 0 2 4 6 8 10 12 0 50 100 150 SPEED DISTANCE GRAPH 2
  • 35.
    0,00 2,00 4,00 6,00 8,00 10,00 12,00 0 20 4060 80 100 120 140 SPEED DISTANCE GRAPH 3 3. Which Graph?
  • 36.
    To sum up… Graphsarevery useful to draw conclusionsfrom different set of data and to find if there is a correlation between them. http://www.nytimes.com/interactive/2012/08/05/sports/olympics/the-100-meter-dash-one-race-every-medalist-ever.html?_r=0
  • 37.
    The language ofgraphs Mathematics. 1st Year Secondary Education