SlideShare a Scribd company logo
Page 1
June 13th, 2018
THE ECONOMICS OF THE WORLD CUP
Suttle Economics Notes #41
• FIFA’s 21st
World Cup starts on Thursday in Russia; Brazil to win at soccer, but lose in GDP
• The ascent of FIFA revenues reflects the rise of the Asian consumer—especially China
• Hosting the Cup can be bad for a country’s GDP and FX health, especially if they win
• Looking ahead to 2022 and beyond: The World Cup and geopolitics
The 21st
FIFA World Cup—soccer’s quadrennial
national team world championship—starts tomorrow.
The tournament will be held in 12 stadiums across 11
cities in Russia, with the Final in Moscow on July 15th
.
In this note, I look at three sets of issues that link the
World Cup to global economics and financial
markets. The links are tenuous, but writing this note is
my best effort to ease my conscience about watching
so much of the tournament over the next month.
First, I review the global economic significance of this
major sporting event. Second, I assess the impact of
the tournament on the host economy and financial
markets. Third, I look ahead and consider how the
World Cup might interact with global geopolitics in
coming years: in the Middle East in the build-up to
2022; North American reunification in 2026; and
when (not if) the World Cup goes to China.
Oddsmakers imply that Brazil (22%), Germany (20%),
Spain (15%) or France (13%) are most likely winners
(Chart 1). As in the world of politics, Brexit may be
delayed, but not avoided: a quarter-final spot seems
fair-value for England’s prospects. The red-line could
be a penalty shoot-out: England have lost all three to
date, while Germany are 4-for-4. Home country bias
gives Russia hope of getting out of the group stage.
Home country bias does not hold for Brazil, which had
nightmare tournaments at home in 1950 and 2014.
The greatest show on earth
The World Cup can justifiably claim to be the major
regular global media event in a world where the
production and consumption of global media
services is becoming an increasingly important aspect
of the service economy. It is a month-long event,
comparable to the Summer Olympic games,
although the latter has far more competing countries
and individual events. Despite this, however, the
World Cup can claim to garner more consistent
attention simply because its key moments—especially
the Final—appeal to a wider global audience (Chart 2).
0
5
10
15
20
25
BZ GE SP FR AR BE EN PR Rest
Chart 1
Implied odds of winning
percent, as of June 10th
0
200
400
600
800
1000
1200
1400
1600
02/04 06/08 10/12 14/16
NFL Superbowl
(4yr avg)
FIFA Cup Final
Olympics opening
ceremony
Chart 2
Global TV viewership
million
Page 2
June 13th, 2018
The record global TV audience (estimated at least 1.5
billion) watched the opening ceremony of the Beijing
Olympics games in 2008, underlining the importance
of Asia (especially China) as a consuming zone. This
also explains why the 2002 World Cup Final in Japan
attracted such a large audience. The NFL’s Superbowl
(and the NFL) suffer from a lack of globalization.
The World Cup also benefits from the fact that it is an
emerging market (EM) as much a developed market
game. Since 1930, the World Cup has been held in
EM economies almost as much as in DM economies—
a difference from the Summer Olympics, which are
geared more to higher-income audiences (Chart 3).
Some of the revenue generated by each World Cup
competition comes from ticket sales. Interestingly,
World Cup attendances have not risen materially in
the past 20 years or so (Chart 4). Indeed, the peak
aggregate attendance was recorded at the 1994
tournament in the United States (3.6 million) even
though there were fewer games there than in the five
tournaments since. The average gate at the 1994
World Cup was almost 69,000 (the next highest—
Brazil in 2014—was about 53,000). Larger stadiums
and the prospect of more games in a 48-team
tournament help explain why FIFA today voted to
hold the 2026 World Cup back in the United States,
Canada and Mexico (which will now get to hold its
third tournament—go figure).
The first six World Cups were goal-fests, with an
average of 4.3 per game, or one every 21 minutes—
enough to keep even US fans engaged (Chart 5). Since
1962, however, the average has settled down to 2.6
per game (a goal every 35 minutes). Attempts on goal
have fallen consistently. This speaks to the growing
uniformity of ability across countries. England did not
compete in the pre-war tournaments on the premise
that we were the world’s best (it was our game after
all; the winner would just play us for true legitimacy).
On our first try (Brazil in 1950), we were defeated 1-0
by an amateur team from the United States.
FIFA revenue in context
While ticket sales are important, FIFA’s main source of
revenue (at least on the books) comes from the sale
of broadcast rights and other marketing deals. Unlike
attendances, these have risen sharply (in USD terms)
through the past 20 years. FIFA revenues are best
looked at in four-year cycles (culminating in World
Cup years). In the latest complete 4-year cycle (2011-
14) revenues totaled $5.1 billion, of which $2.5 billion
was accounted for by TV rights (especially valuable in
Asia) and $1.6 billion by marketing deals with
corporate partners (Chart 6). In 2015-18, this total is
expected to be $5.7 billion; and, in 2019-22, the total
is projected at $6.6 billion.
0
2
4
6
8
10
12
14
16
18
World Cup Olympics
DM economies
EM economies
Chart 3
Locations by economy
number of events
0
10
20
30
40
50
60
70
0.0
0.5
1.0
1.5
2.0
2.5
3.0
3.5
4.0
30 38 54 62 70 78 86 94 02 10
Total attendance
Matches played
in tournament
Chart 4
World Cup attendances
million number of games
1.0
1.5
2.0
2.5
3.0
3.5
4.0
4.5
5.0
5.5
6.0
30 38 54 62 70 78 86 94 02 10
Chart 5
Goals scored per game
number per 90 minute game
Page 3
June 13th, 2018
In the current cycle, FIFA revenue in 2018 is projected
to be about $3.9 billion (i.e. it averaged just $600
million in the previous 3 years). $3.9 billion is about
0.0045% of global GDP, which helps put the scale of
the competition in its true economic context. FIFA
revenues have been growing far more rapidly than
global nominal GDP over recent years, however (Chart
7). The nominal aggregate revenue gain (in USD
terms) for the 2019-22 cycle (when the World Cup will
be held in Qatar during the Northern winter) is
projected to be slower than the gain in nominal GDP
(in USD terms) projected by the IMF for that four-year
period (FIFA should invoice in non-USD currencies).
Watch for weak June data from Brazil
While the impact of the tournament on the global
economy is thus a (small) rounding error for GDP,
there are ways it might matter for the global data flow
in coming months. In South and Central America, live
TV viewership will be high during the work day.
Assuming that Argentina and Brazil progress deep
into the tournament, this could have a negative effect
on production indicators. In the past 3 World Cups
(2006, 2010 and 2014), Brazilian IP fell by an average
of 0.9%m/m, sa, in June. This was a much worse
outcome than surrounding months: the average for
Apr-May was flat and Jul-Aug posted an average
0.7%m/m, sa rebound. This could add to concerns
about the health of Brazil as it approaches elections.
Impact on the host economy and markets
The most plausible economic impact of the
tournament is on the host economy—Russia. Events
such as the World Cup can boost growth for two
reasons. First, there is a construction boost (both
stadia and infrastructure) leading up to the event. The
Russia World Cup Organizing Committee reckoned
that outlays between 2013 and 2018 boosted GDP by
almost a cumulative 1% point (while that might not
seem a lot, Russia grew only 3% in all between 2013
and 2018). This growth boost disappears on the eve of
the event. Second, there is a short-term infusion of
tourism spending from foreign visitors, although the
magnitude of this effect can be limited if event visitors
scare off other potential visitors (this happened at the
London Olympics in 2012). While hordes of soccer
crowds are indeed apt to scare competing visitors off,
I’m not sure how many might otherwise have been
hurrying to Volgograd (formerly Stalingrad) in June.
Empirically, hosting a World Cup has been bad for a
country’s growth health (Chart 8). This is even more
true if the host country wins (unlikely in 2018).
Hosting a World Cup has been even worse for a
country’s financial markets (using the FX rate as a
proxy; Chart 9). Host countries have experienced FX
devaluations in the calendar year following the World
Cup in six of the nine competitions since 1982. This is
0.0
0.5
1.0
1.5
2.0
2.5
3.0
3.5
4.0
99-02 03-06 07-10 11-14 15-18 19-22
TV rights
Marketing deals
Chart 6
FIFA revenues
$ billion total over a 4yr cycle
1.2
1.3
1.4
1.5
1.6
1.7
1.8
99-02 03-06 07-10 11-14 15-18 19-22
Chart 7
FIFA revenues relative to global GDP
thousandths of 1 percent, 4yr cycles
Welcome to
Qatar
0.0
0.5
1.0
1.5
2.0
2.5
3.0
3.5
4.0
T-1 T T+1
All tournaments since 1966
Home team wins (66, 74, 78, 98)
Chart 8
Growth performance of World Cup host
Median GDP growth, %y/y, T = year of tournament
Page 4
June 13th, 2018
much worse performance than in the year after a
Summer Olympic games. Three of the six
depreciations were in DM economies.
A pipeline model of winning the World Cup
There is a pipeline for the World Cup. Since 1977, FIFA
has held a U-20 World Cup; since 1985, it has held a
U-17 World Cup (both every two years). Last year,
England became the first country to win both
tournaments in the same year: watch out Qatar in
2022! Unfortunately, however, the statistical link
between winning competitions at the junior level and
senior level is weak (Chart 10). Nigeria and Ghana, for
example, have won eight junior World Cups between
them, but neither has yet progressed beyond the
quarter-final round at the senior level (which Ghana
reached in 2010). By contrast, Italy and Uruguay
combine to six senior World Cup titles, but none at
the junior level.
Geopolitics ahead
Looking ahead, there are three geopolitical issues that
could be important. First, Qatar 2022 is shaping up to
have major issues, given the current blockade (and
underlying animosity) between Qatar and the rest of
its Gulf neighbors (a Saudi-Iran match in Qatar would
be a doozy). Second, FIFA today awarded the 2026
World Cup to NAFTA just as US-Canadian-Mexican
political relations have plunged to a recent low.
Finally, and most interestingly, there is the issue of
when China enters the picture. After the US, China is
the main economic prize for FIFA. The 2030
(centenary) World Cup will most likely be held in
South America (jointly by Argentina and Uruguay—the
1930 hosts) or England. 2034 (or 2038) is thus shaping
up as the first year that China might host the Cup.
China might be competitive by then. It re-entered the
Olympic Games in 1984; 24 years later, it won most
gold medals at home (Chart 11). China’s very low FIFA
world ranking (which correlates inversely with their
Olympic performance) hit its most recent low in 2014;
the country could be at the other end of the spectrum
by the late 2030s. Once focused, China has scaled
most other global rankings in the past 40 years.
Philip Suttle
phil@suttleeconomics.com
202-378-6793
Important Information
While we make every effort to ensure that the analysis in this
note is as accurate as possible, we do not guarantee that the
information contained is either complete or correct. The material
has been provided for informational and educational purposes
only. The information is not intended to provide or constitute
investment, accounting, tax or legal advice.
-8
-6
-4
-2
0
2
4
6
8
10
Olympics World Cup
Year ahead
Year after
Chart 9
FX moves for host currency since 1982
median % ch versus USD (except US = DXY)
R² = 0.0549
0
1
2
3
4
5
0 1 2 3 4 5 6 7 8
Chart 10
Senior and Junior World Cup wins
Senior cup wins
Junior cup wins
Brazil
Argentina
Nigeria
Germany
Italy
Ghana
30
40
50
60
70
80
90
100
110
0
10
20
30
40
50
60
84 88 92 96 00 04 08 12 16
Gold medals (LHS)
FIFA world ranking (RHS)
Chart 11
Chinese Olympic & soccer performance
number of medals ranking (higher is worse)

More Related Content

Similar to The economics of the world cup

Viewer track 2010 fifa world cup
Viewer track 2010 fifa world cupViewer track 2010 fifa world cup
Viewer track 2010 fifa world cup
mediapiac
 
Nielsen_World-Football-2018-6.11.18.pdf
Nielsen_World-Football-2018-6.11.18.pdfNielsen_World-Football-2018-6.11.18.pdf
Nielsen_World-Football-2018-6.11.18.pdf
KunHuynh2
 
THE FIFA WORLD CUP 2014 - 2018 - 2022The Fédération Internati.docx
THE FIFA WORLD CUP 2014 - 2018 - 2022The Fédération Internati.docxTHE FIFA WORLD CUP 2014 - 2018 - 2022The Fédération Internati.docx
THE FIFA WORLD CUP 2014 - 2018 - 2022The Fédération Internati.docx
cherry686017
 
Perspectives Global and Spanish Economy G4 2019
Perspectives Global and Spanish Economy G4 2019Perspectives Global and Spanish Economy G4 2019
Perspectives Global and Spanish Economy G4 2019
Círculo de Empresarios
 
36332054 sports-industry-overview
36332054 sports-industry-overview36332054 sports-industry-overview
36332054 sports-industry-overview
Prashant Bandhu
 
The Economics of Hosting a World Cup
The Economics of Hosting a World Cup The Economics of Hosting a World Cup
The Economics of Hosting a World Cup
QNB Group
 
Perspectives on Global and Spanish Economy Q3-2018 Circulo de Empresarios
Perspectives on Global and Spanish Economy Q3-2018 Circulo de EmpresariosPerspectives on Global and Spanish Economy Q3-2018 Circulo de Empresarios
Perspectives on Global and Spanish Economy Q3-2018 Circulo de Empresarios
Círculo de Empresarios
 
Magna Global - Advertising Forecasts - Global Advertising Market | 12/06/2014
Magna Global - Advertising Forecasts - Global Advertising Market | 12/06/2014Magna Global - Advertising Forecasts - Global Advertising Market | 12/06/2014
Magna Global - Advertising Forecasts - Global Advertising Market | 12/06/2014
Lamia Mosbah
 
Quarterly Report. Perspectives on Global and Spanish economy Q2-2019
Quarterly Report. Perspectives on Global and Spanish economy Q2-2019Quarterly Report. Perspectives on Global and Spanish economy Q2-2019
Quarterly Report. Perspectives on Global and Spanish economy Q2-2019
Círculo de Empresarios
 
C-Issues-Coursework
C-Issues-CourseworkC-Issues-Coursework
C-Issues-Coursework
Alexandros Efthymiou
 
US sports events and facilities - Where are the opportunities - Christian Mo...
US sports events and facilities  - Where are the opportunities - Christian Mo...US sports events and facilities  - Where are the opportunities - Christian Mo...
US sports events and facilities - Where are the opportunities - Christian Mo...
Signitt
 
Quarterly Report Perspectives Spanish and Global Economy Q3-2020
Quarterly Report Perspectives Spanish and Global Economy Q3-2020Quarterly Report Perspectives Spanish and Global Economy Q3-2020
Quarterly Report Perspectives Spanish and Global Economy Q3-2020
Círculo de Empresarios
 
Soccer World Cup
Soccer World CupSoccer World Cup
Soccer World Cup
Tim Michael
 
Group 3- World Cup
Group 3- World CupGroup 3- World Cup
Group 3- World Cup
Richard Liu
 
Dan global ad spend report june 2018
Dan global ad spend report  june 2018Dan global ad spend report  june 2018
Dan global ad spend report june 2018
Social Samosa
 
Quarterly report on the global and the spanish economy Q3 2016 Círculo de Emp...
Quarterly report on the global and the spanish economy Q3 2016 Círculo de Emp...Quarterly report on the global and the spanish economy Q3 2016 Círculo de Emp...
Quarterly report on the global and the spanish economy Q3 2016 Círculo de Emp...
Círculo de Empresarios
 
Mega eventos esportivos, relatório VISA
Mega eventos esportivos, relatório VISAMega eventos esportivos, relatório VISA
Mega eventos esportivos, relatório VISA
Jeanine Pires
 
Key Contemporary issues in Football
Key Contemporary issues in FootballKey Contemporary issues in Football
Key Contemporary issues in Football
Gabriel Marin
 
Arthur D. Little : Covid 19 impact on automotive industry update July 2020
Arthur D. Little : Covid 19 impact on automotive industry update July 2020Arthur D. Little : Covid 19 impact on automotive industry update July 2020
Arthur D. Little : Covid 19 impact on automotive industry update July 2020
Fabrizio Arena
 
FIFA World Cup 2014: Social Impacts and Policy Strategies
FIFA World Cup 2014: Social Impacts and Policy StrategiesFIFA World Cup 2014: Social Impacts and Policy Strategies
FIFA World Cup 2014: Social Impacts and Policy Strategies
Flavio Kleijssen
 

Similar to The economics of the world cup (20)

Viewer track 2010 fifa world cup
Viewer track 2010 fifa world cupViewer track 2010 fifa world cup
Viewer track 2010 fifa world cup
 
Nielsen_World-Football-2018-6.11.18.pdf
Nielsen_World-Football-2018-6.11.18.pdfNielsen_World-Football-2018-6.11.18.pdf
Nielsen_World-Football-2018-6.11.18.pdf
 
THE FIFA WORLD CUP 2014 - 2018 - 2022The Fédération Internati.docx
THE FIFA WORLD CUP 2014 - 2018 - 2022The Fédération Internati.docxTHE FIFA WORLD CUP 2014 - 2018 - 2022The Fédération Internati.docx
THE FIFA WORLD CUP 2014 - 2018 - 2022The Fédération Internati.docx
 
Perspectives Global and Spanish Economy G4 2019
Perspectives Global and Spanish Economy G4 2019Perspectives Global and Spanish Economy G4 2019
Perspectives Global and Spanish Economy G4 2019
 
36332054 sports-industry-overview
36332054 sports-industry-overview36332054 sports-industry-overview
36332054 sports-industry-overview
 
The Economics of Hosting a World Cup
The Economics of Hosting a World Cup The Economics of Hosting a World Cup
The Economics of Hosting a World Cup
 
Perspectives on Global and Spanish Economy Q3-2018 Circulo de Empresarios
Perspectives on Global and Spanish Economy Q3-2018 Circulo de EmpresariosPerspectives on Global and Spanish Economy Q3-2018 Circulo de Empresarios
Perspectives on Global and Spanish Economy Q3-2018 Circulo de Empresarios
 
Magna Global - Advertising Forecasts - Global Advertising Market | 12/06/2014
Magna Global - Advertising Forecasts - Global Advertising Market | 12/06/2014Magna Global - Advertising Forecasts - Global Advertising Market | 12/06/2014
Magna Global - Advertising Forecasts - Global Advertising Market | 12/06/2014
 
Quarterly Report. Perspectives on Global and Spanish economy Q2-2019
Quarterly Report. Perspectives on Global and Spanish economy Q2-2019Quarterly Report. Perspectives on Global and Spanish economy Q2-2019
Quarterly Report. Perspectives on Global and Spanish economy Q2-2019
 
C-Issues-Coursework
C-Issues-CourseworkC-Issues-Coursework
C-Issues-Coursework
 
US sports events and facilities - Where are the opportunities - Christian Mo...
US sports events and facilities  - Where are the opportunities - Christian Mo...US sports events and facilities  - Where are the opportunities - Christian Mo...
US sports events and facilities - Where are the opportunities - Christian Mo...
 
Quarterly Report Perspectives Spanish and Global Economy Q3-2020
Quarterly Report Perspectives Spanish and Global Economy Q3-2020Quarterly Report Perspectives Spanish and Global Economy Q3-2020
Quarterly Report Perspectives Spanish and Global Economy Q3-2020
 
Soccer World Cup
Soccer World CupSoccer World Cup
Soccer World Cup
 
Group 3- World Cup
Group 3- World CupGroup 3- World Cup
Group 3- World Cup
 
Dan global ad spend report june 2018
Dan global ad spend report  june 2018Dan global ad spend report  june 2018
Dan global ad spend report june 2018
 
Quarterly report on the global and the spanish economy Q3 2016 Círculo de Emp...
Quarterly report on the global and the spanish economy Q3 2016 Círculo de Emp...Quarterly report on the global and the spanish economy Q3 2016 Círculo de Emp...
Quarterly report on the global and the spanish economy Q3 2016 Círculo de Emp...
 
Mega eventos esportivos, relatório VISA
Mega eventos esportivos, relatório VISAMega eventos esportivos, relatório VISA
Mega eventos esportivos, relatório VISA
 
Key Contemporary issues in Football
Key Contemporary issues in FootballKey Contemporary issues in Football
Key Contemporary issues in Football
 
Arthur D. Little : Covid 19 impact on automotive industry update July 2020
Arthur D. Little : Covid 19 impact on automotive industry update July 2020Arthur D. Little : Covid 19 impact on automotive industry update July 2020
Arthur D. Little : Covid 19 impact on automotive industry update July 2020
 
FIFA World Cup 2014: Social Impacts and Policy Strategies
FIFA World Cup 2014: Social Impacts and Policy StrategiesFIFA World Cup 2014: Social Impacts and Policy Strategies
FIFA World Cup 2014: Social Impacts and Policy Strategies
 

Recently uploaded

How Non-Banking Financial Companies Empower Startups With Venture Debt Financing
How Non-Banking Financial Companies Empower Startups With Venture Debt FinancingHow Non-Banking Financial Companies Empower Startups With Venture Debt Financing
How Non-Banking Financial Companies Empower Startups With Venture Debt Financing
Vighnesh Shashtri
 
在线办理(GU毕业证书)美国贡萨加大学毕业证学历证书一模一样
在线办理(GU毕业证书)美国贡萨加大学毕业证学历证书一模一样在线办理(GU毕业证书)美国贡萨加大学毕业证学历证书一模一样
在线办理(GU毕业证书)美国贡萨加大学毕业证学历证书一模一样
5spllj1l
 
1:1制作加拿大麦吉尔大学毕业证硕士学历证书原版一模一样
1:1制作加拿大麦吉尔大学毕业证硕士学历证书原版一模一样1:1制作加拿大麦吉尔大学毕业证硕士学历证书原版一模一样
1:1制作加拿大麦吉尔大学毕业证硕士学历证书原版一模一样
qntjwn68
 
一比一原版美国新罕布什尔大学(unh)毕业证学历认证真实可查
一比一原版美国新罕布什尔大学(unh)毕业证学历认证真实可查一比一原版美国新罕布什尔大学(unh)毕业证学历认证真实可查
一比一原版美国新罕布什尔大学(unh)毕业证学历认证真实可查
taqyea
 
快速制作美国迈阿密大学牛津分校毕业证文凭证书英文原版一模一样
快速制作美国迈阿密大学牛津分校毕业证文凭证书英文原版一模一样快速制作美国迈阿密大学牛津分校毕业证文凭证书英文原版一模一样
快速制作美国迈阿密大学牛津分校毕业证文凭证书英文原版一模一样
rlo9fxi
 
The Impact of GST Payments on Loan Approvals
The Impact of GST Payments on Loan ApprovalsThe Impact of GST Payments on Loan Approvals
The Impact of GST Payments on Loan Approvals
Vighnesh Shashtri
 
falcon-invoice-discounting-a-strategic-approach-to-optimize-investments
falcon-invoice-discounting-a-strategic-approach-to-optimize-investmentsfalcon-invoice-discounting-a-strategic-approach-to-optimize-investments
falcon-invoice-discounting-a-strategic-approach-to-optimize-investments
Falcon Invoice Discounting
 
1.2 Business Ideas Business Ideas Busine
1.2 Business Ideas Business Ideas Busine1.2 Business Ideas Business Ideas Busine
1.2 Business Ideas Business Ideas Busine
Lawrence101
 
2. Elemental Economics - Mineral demand.pdf
2. Elemental Economics - Mineral demand.pdf2. Elemental Economics - Mineral demand.pdf
2. Elemental Economics - Mineral demand.pdf
Neal Brewster
 
1. Elemental Economics - Introduction to mining.pdf
1. Elemental Economics - Introduction to mining.pdf1. Elemental Economics - Introduction to mining.pdf
1. Elemental Economics - Introduction to mining.pdf
Neal Brewster
 
Eco-Innovations and Firm Heterogeneity. Evidence from Italian Family and Nonf...
Eco-Innovations and Firm Heterogeneity.Evidence from Italian Family and Nonf...Eco-Innovations and Firm Heterogeneity.Evidence from Italian Family and Nonf...
Eco-Innovations and Firm Heterogeneity. Evidence from Italian Family and Nonf...
University of Calabria
 
Economic Risk Factor Update: June 2024 [SlideShare]
Economic Risk Factor Update: June 2024 [SlideShare]Economic Risk Factor Update: June 2024 [SlideShare]
Economic Risk Factor Update: June 2024 [SlideShare]
Commonwealth
 
What's a worker’s market? Job quality and labour market tightness
What's a worker’s market? Job quality and labour market tightnessWhat's a worker’s market? Job quality and labour market tightness
What's a worker’s market? Job quality and labour market tightness
Labour Market Information Council | Conseil de l’information sur le marché du travail
 
Solution Manual For Financial Accounting, 8th Canadian Edition 2024, by Libby...
Solution Manual For Financial Accounting, 8th Canadian Edition 2024, by Libby...Solution Manual For Financial Accounting, 8th Canadian Edition 2024, by Libby...
Solution Manual For Financial Accounting, 8th Canadian Edition 2024, by Libby...
Donc Test
 
一比一原版(UCL毕业证)伦敦大学|学院毕业证如何办理
一比一原版(UCL毕业证)伦敦大学|学院毕业证如何办理一比一原版(UCL毕业证)伦敦大学|学院毕业证如何办理
一比一原版(UCL毕业证)伦敦大学|学院毕业证如何办理
otogas
 
Does teamwork really matter? Looking beyond the job posting to understand lab...
Does teamwork really matter? Looking beyond the job posting to understand lab...Does teamwork really matter? Looking beyond the job posting to understand lab...
Does teamwork really matter? Looking beyond the job posting to understand lab...
Labour Market Information Council | Conseil de l’information sur le marché du travail
 
FCCS Basic Accounts Outline and Hierarchy.pptx
FCCS Basic Accounts Outline and Hierarchy.pptxFCCS Basic Accounts Outline and Hierarchy.pptx
FCCS Basic Accounts Outline and Hierarchy.pptx
nalamynandan
 
Pensions and housing - Pensions PlayPen - 4 June 2024 v3 (1).pdf
Pensions and housing - Pensions PlayPen - 4 June 2024 v3 (1).pdfPensions and housing - Pensions PlayPen - 4 June 2024 v3 (1).pdf
Pensions and housing - Pensions PlayPen - 4 June 2024 v3 (1).pdf
Henry Tapper
 
Earn a passive income with prosocial investing
Earn a passive income with prosocial investingEarn a passive income with prosocial investing
Earn a passive income with prosocial investing
Colin R. Turner
 
Independent Study - College of Wooster Research (2023-2024)
Independent Study - College of Wooster Research (2023-2024)Independent Study - College of Wooster Research (2023-2024)
Independent Study - College of Wooster Research (2023-2024)
AntoniaOwensDetwiler
 

Recently uploaded (20)

How Non-Banking Financial Companies Empower Startups With Venture Debt Financing
How Non-Banking Financial Companies Empower Startups With Venture Debt FinancingHow Non-Banking Financial Companies Empower Startups With Venture Debt Financing
How Non-Banking Financial Companies Empower Startups With Venture Debt Financing
 
在线办理(GU毕业证书)美国贡萨加大学毕业证学历证书一模一样
在线办理(GU毕业证书)美国贡萨加大学毕业证学历证书一模一样在线办理(GU毕业证书)美国贡萨加大学毕业证学历证书一模一样
在线办理(GU毕业证书)美国贡萨加大学毕业证学历证书一模一样
 
1:1制作加拿大麦吉尔大学毕业证硕士学历证书原版一模一样
1:1制作加拿大麦吉尔大学毕业证硕士学历证书原版一模一样1:1制作加拿大麦吉尔大学毕业证硕士学历证书原版一模一样
1:1制作加拿大麦吉尔大学毕业证硕士学历证书原版一模一样
 
一比一原版美国新罕布什尔大学(unh)毕业证学历认证真实可查
一比一原版美国新罕布什尔大学(unh)毕业证学历认证真实可查一比一原版美国新罕布什尔大学(unh)毕业证学历认证真实可查
一比一原版美国新罕布什尔大学(unh)毕业证学历认证真实可查
 
快速制作美国迈阿密大学牛津分校毕业证文凭证书英文原版一模一样
快速制作美国迈阿密大学牛津分校毕业证文凭证书英文原版一模一样快速制作美国迈阿密大学牛津分校毕业证文凭证书英文原版一模一样
快速制作美国迈阿密大学牛津分校毕业证文凭证书英文原版一模一样
 
The Impact of GST Payments on Loan Approvals
The Impact of GST Payments on Loan ApprovalsThe Impact of GST Payments on Loan Approvals
The Impact of GST Payments on Loan Approvals
 
falcon-invoice-discounting-a-strategic-approach-to-optimize-investments
falcon-invoice-discounting-a-strategic-approach-to-optimize-investmentsfalcon-invoice-discounting-a-strategic-approach-to-optimize-investments
falcon-invoice-discounting-a-strategic-approach-to-optimize-investments
 
1.2 Business Ideas Business Ideas Busine
1.2 Business Ideas Business Ideas Busine1.2 Business Ideas Business Ideas Busine
1.2 Business Ideas Business Ideas Busine
 
2. Elemental Economics - Mineral demand.pdf
2. Elemental Economics - Mineral demand.pdf2. Elemental Economics - Mineral demand.pdf
2. Elemental Economics - Mineral demand.pdf
 
1. Elemental Economics - Introduction to mining.pdf
1. Elemental Economics - Introduction to mining.pdf1. Elemental Economics - Introduction to mining.pdf
1. Elemental Economics - Introduction to mining.pdf
 
Eco-Innovations and Firm Heterogeneity. Evidence from Italian Family and Nonf...
Eco-Innovations and Firm Heterogeneity.Evidence from Italian Family and Nonf...Eco-Innovations and Firm Heterogeneity.Evidence from Italian Family and Nonf...
Eco-Innovations and Firm Heterogeneity. Evidence from Italian Family and Nonf...
 
Economic Risk Factor Update: June 2024 [SlideShare]
Economic Risk Factor Update: June 2024 [SlideShare]Economic Risk Factor Update: June 2024 [SlideShare]
Economic Risk Factor Update: June 2024 [SlideShare]
 
What's a worker’s market? Job quality and labour market tightness
What's a worker’s market? Job quality and labour market tightnessWhat's a worker’s market? Job quality and labour market tightness
What's a worker’s market? Job quality and labour market tightness
 
Solution Manual For Financial Accounting, 8th Canadian Edition 2024, by Libby...
Solution Manual For Financial Accounting, 8th Canadian Edition 2024, by Libby...Solution Manual For Financial Accounting, 8th Canadian Edition 2024, by Libby...
Solution Manual For Financial Accounting, 8th Canadian Edition 2024, by Libby...
 
一比一原版(UCL毕业证)伦敦大学|学院毕业证如何办理
一比一原版(UCL毕业证)伦敦大学|学院毕业证如何办理一比一原版(UCL毕业证)伦敦大学|学院毕业证如何办理
一比一原版(UCL毕业证)伦敦大学|学院毕业证如何办理
 
Does teamwork really matter? Looking beyond the job posting to understand lab...
Does teamwork really matter? Looking beyond the job posting to understand lab...Does teamwork really matter? Looking beyond the job posting to understand lab...
Does teamwork really matter? Looking beyond the job posting to understand lab...
 
FCCS Basic Accounts Outline and Hierarchy.pptx
FCCS Basic Accounts Outline and Hierarchy.pptxFCCS Basic Accounts Outline and Hierarchy.pptx
FCCS Basic Accounts Outline and Hierarchy.pptx
 
Pensions and housing - Pensions PlayPen - 4 June 2024 v3 (1).pdf
Pensions and housing - Pensions PlayPen - 4 June 2024 v3 (1).pdfPensions and housing - Pensions PlayPen - 4 June 2024 v3 (1).pdf
Pensions and housing - Pensions PlayPen - 4 June 2024 v3 (1).pdf
 
Earn a passive income with prosocial investing
Earn a passive income with prosocial investingEarn a passive income with prosocial investing
Earn a passive income with prosocial investing
 
Independent Study - College of Wooster Research (2023-2024)
Independent Study - College of Wooster Research (2023-2024)Independent Study - College of Wooster Research (2023-2024)
Independent Study - College of Wooster Research (2023-2024)
 

The economics of the world cup

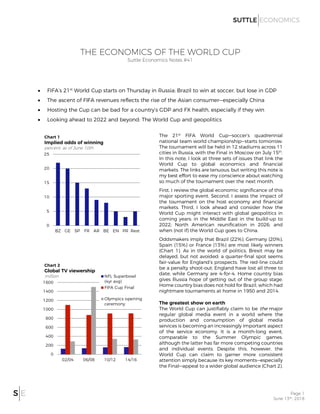
  • 1. Page 1 June 13th, 2018 THE ECONOMICS OF THE WORLD CUP Suttle Economics Notes #41 • FIFA’s 21st World Cup starts on Thursday in Russia; Brazil to win at soccer, but lose in GDP • The ascent of FIFA revenues reflects the rise of the Asian consumer—especially China • Hosting the Cup can be bad for a country’s GDP and FX health, especially if they win • Looking ahead to 2022 and beyond: The World Cup and geopolitics The 21st FIFA World Cup—soccer’s quadrennial national team world championship—starts tomorrow. The tournament will be held in 12 stadiums across 11 cities in Russia, with the Final in Moscow on July 15th . In this note, I look at three sets of issues that link the World Cup to global economics and financial markets. The links are tenuous, but writing this note is my best effort to ease my conscience about watching so much of the tournament over the next month. First, I review the global economic significance of this major sporting event. Second, I assess the impact of the tournament on the host economy and financial markets. Third, I look ahead and consider how the World Cup might interact with global geopolitics in coming years: in the Middle East in the build-up to 2022; North American reunification in 2026; and when (not if) the World Cup goes to China. Oddsmakers imply that Brazil (22%), Germany (20%), Spain (15%) or France (13%) are most likely winners (Chart 1). As in the world of politics, Brexit may be delayed, but not avoided: a quarter-final spot seems fair-value for England’s prospects. The red-line could be a penalty shoot-out: England have lost all three to date, while Germany are 4-for-4. Home country bias gives Russia hope of getting out of the group stage. Home country bias does not hold for Brazil, which had nightmare tournaments at home in 1950 and 2014. The greatest show on earth The World Cup can justifiably claim to be the major regular global media event in a world where the production and consumption of global media services is becoming an increasingly important aspect of the service economy. It is a month-long event, comparable to the Summer Olympic games, although the latter has far more competing countries and individual events. Despite this, however, the World Cup can claim to garner more consistent attention simply because its key moments—especially the Final—appeal to a wider global audience (Chart 2). 0 5 10 15 20 25 BZ GE SP FR AR BE EN PR Rest Chart 1 Implied odds of winning percent, as of June 10th 0 200 400 600 800 1000 1200 1400 1600 02/04 06/08 10/12 14/16 NFL Superbowl (4yr avg) FIFA Cup Final Olympics opening ceremony Chart 2 Global TV viewership million
  • 2. Page 2 June 13th, 2018 The record global TV audience (estimated at least 1.5 billion) watched the opening ceremony of the Beijing Olympics games in 2008, underlining the importance of Asia (especially China) as a consuming zone. This also explains why the 2002 World Cup Final in Japan attracted such a large audience. The NFL’s Superbowl (and the NFL) suffer from a lack of globalization. The World Cup also benefits from the fact that it is an emerging market (EM) as much a developed market game. Since 1930, the World Cup has been held in EM economies almost as much as in DM economies— a difference from the Summer Olympics, which are geared more to higher-income audiences (Chart 3). Some of the revenue generated by each World Cup competition comes from ticket sales. Interestingly, World Cup attendances have not risen materially in the past 20 years or so (Chart 4). Indeed, the peak aggregate attendance was recorded at the 1994 tournament in the United States (3.6 million) even though there were fewer games there than in the five tournaments since. The average gate at the 1994 World Cup was almost 69,000 (the next highest— Brazil in 2014—was about 53,000). Larger stadiums and the prospect of more games in a 48-team tournament help explain why FIFA today voted to hold the 2026 World Cup back in the United States, Canada and Mexico (which will now get to hold its third tournament—go figure). The first six World Cups were goal-fests, with an average of 4.3 per game, or one every 21 minutes— enough to keep even US fans engaged (Chart 5). Since 1962, however, the average has settled down to 2.6 per game (a goal every 35 minutes). Attempts on goal have fallen consistently. This speaks to the growing uniformity of ability across countries. England did not compete in the pre-war tournaments on the premise that we were the world’s best (it was our game after all; the winner would just play us for true legitimacy). On our first try (Brazil in 1950), we were defeated 1-0 by an amateur team from the United States. FIFA revenue in context While ticket sales are important, FIFA’s main source of revenue (at least on the books) comes from the sale of broadcast rights and other marketing deals. Unlike attendances, these have risen sharply (in USD terms) through the past 20 years. FIFA revenues are best looked at in four-year cycles (culminating in World Cup years). In the latest complete 4-year cycle (2011- 14) revenues totaled $5.1 billion, of which $2.5 billion was accounted for by TV rights (especially valuable in Asia) and $1.6 billion by marketing deals with corporate partners (Chart 6). In 2015-18, this total is expected to be $5.7 billion; and, in 2019-22, the total is projected at $6.6 billion. 0 2 4 6 8 10 12 14 16 18 World Cup Olympics DM economies EM economies Chart 3 Locations by economy number of events 0 10 20 30 40 50 60 70 0.0 0.5 1.0 1.5 2.0 2.5 3.0 3.5 4.0 30 38 54 62 70 78 86 94 02 10 Total attendance Matches played in tournament Chart 4 World Cup attendances million number of games 1.0 1.5 2.0 2.5 3.0 3.5 4.0 4.5 5.0 5.5 6.0 30 38 54 62 70 78 86 94 02 10 Chart 5 Goals scored per game number per 90 minute game
  • 3. Page 3 June 13th, 2018 In the current cycle, FIFA revenue in 2018 is projected to be about $3.9 billion (i.e. it averaged just $600 million in the previous 3 years). $3.9 billion is about 0.0045% of global GDP, which helps put the scale of the competition in its true economic context. FIFA revenues have been growing far more rapidly than global nominal GDP over recent years, however (Chart 7). The nominal aggregate revenue gain (in USD terms) for the 2019-22 cycle (when the World Cup will be held in Qatar during the Northern winter) is projected to be slower than the gain in nominal GDP (in USD terms) projected by the IMF for that four-year period (FIFA should invoice in non-USD currencies). Watch for weak June data from Brazil While the impact of the tournament on the global economy is thus a (small) rounding error for GDP, there are ways it might matter for the global data flow in coming months. In South and Central America, live TV viewership will be high during the work day. Assuming that Argentina and Brazil progress deep into the tournament, this could have a negative effect on production indicators. In the past 3 World Cups (2006, 2010 and 2014), Brazilian IP fell by an average of 0.9%m/m, sa, in June. This was a much worse outcome than surrounding months: the average for Apr-May was flat and Jul-Aug posted an average 0.7%m/m, sa rebound. This could add to concerns about the health of Brazil as it approaches elections. Impact on the host economy and markets The most plausible economic impact of the tournament is on the host economy—Russia. Events such as the World Cup can boost growth for two reasons. First, there is a construction boost (both stadia and infrastructure) leading up to the event. The Russia World Cup Organizing Committee reckoned that outlays between 2013 and 2018 boosted GDP by almost a cumulative 1% point (while that might not seem a lot, Russia grew only 3% in all between 2013 and 2018). This growth boost disappears on the eve of the event. Second, there is a short-term infusion of tourism spending from foreign visitors, although the magnitude of this effect can be limited if event visitors scare off other potential visitors (this happened at the London Olympics in 2012). While hordes of soccer crowds are indeed apt to scare competing visitors off, I’m not sure how many might otherwise have been hurrying to Volgograd (formerly Stalingrad) in June. Empirically, hosting a World Cup has been bad for a country’s growth health (Chart 8). This is even more true if the host country wins (unlikely in 2018). Hosting a World Cup has been even worse for a country’s financial markets (using the FX rate as a proxy; Chart 9). Host countries have experienced FX devaluations in the calendar year following the World Cup in six of the nine competitions since 1982. This is 0.0 0.5 1.0 1.5 2.0 2.5 3.0 3.5 4.0 99-02 03-06 07-10 11-14 15-18 19-22 TV rights Marketing deals Chart 6 FIFA revenues $ billion total over a 4yr cycle 1.2 1.3 1.4 1.5 1.6 1.7 1.8 99-02 03-06 07-10 11-14 15-18 19-22 Chart 7 FIFA revenues relative to global GDP thousandths of 1 percent, 4yr cycles Welcome to Qatar 0.0 0.5 1.0 1.5 2.0 2.5 3.0 3.5 4.0 T-1 T T+1 All tournaments since 1966 Home team wins (66, 74, 78, 98) Chart 8 Growth performance of World Cup host Median GDP growth, %y/y, T = year of tournament
  • 4. Page 4 June 13th, 2018 much worse performance than in the year after a Summer Olympic games. Three of the six depreciations were in DM economies. A pipeline model of winning the World Cup There is a pipeline for the World Cup. Since 1977, FIFA has held a U-20 World Cup; since 1985, it has held a U-17 World Cup (both every two years). Last year, England became the first country to win both tournaments in the same year: watch out Qatar in 2022! Unfortunately, however, the statistical link between winning competitions at the junior level and senior level is weak (Chart 10). Nigeria and Ghana, for example, have won eight junior World Cups between them, but neither has yet progressed beyond the quarter-final round at the senior level (which Ghana reached in 2010). By contrast, Italy and Uruguay combine to six senior World Cup titles, but none at the junior level. Geopolitics ahead Looking ahead, there are three geopolitical issues that could be important. First, Qatar 2022 is shaping up to have major issues, given the current blockade (and underlying animosity) between Qatar and the rest of its Gulf neighbors (a Saudi-Iran match in Qatar would be a doozy). Second, FIFA today awarded the 2026 World Cup to NAFTA just as US-Canadian-Mexican political relations have plunged to a recent low. Finally, and most interestingly, there is the issue of when China enters the picture. After the US, China is the main economic prize for FIFA. The 2030 (centenary) World Cup will most likely be held in South America (jointly by Argentina and Uruguay—the 1930 hosts) or England. 2034 (or 2038) is thus shaping up as the first year that China might host the Cup. China might be competitive by then. It re-entered the Olympic Games in 1984; 24 years later, it won most gold medals at home (Chart 11). China’s very low FIFA world ranking (which correlates inversely with their Olympic performance) hit its most recent low in 2014; the country could be at the other end of the spectrum by the late 2030s. Once focused, China has scaled most other global rankings in the past 40 years. Philip Suttle phil@suttleeconomics.com 202-378-6793 Important Information While we make every effort to ensure that the analysis in this note is as accurate as possible, we do not guarantee that the information contained is either complete or correct. The material has been provided for informational and educational purposes only. The information is not intended to provide or constitute investment, accounting, tax or legal advice. -8 -6 -4 -2 0 2 4 6 8 10 Olympics World Cup Year ahead Year after Chart 9 FX moves for host currency since 1982 median % ch versus USD (except US = DXY) R² = 0.0549 0 1 2 3 4 5 0 1 2 3 4 5 6 7 8 Chart 10 Senior and Junior World Cup wins Senior cup wins Junior cup wins Brazil Argentina Nigeria Germany Italy Ghana 30 40 50 60 70 80 90 100 110 0 10 20 30 40 50 60 84 88 92 96 00 04 08 12 16 Gold medals (LHS) FIFA world ranking (RHS) Chart 11 Chinese Olympic & soccer performance number of medals ranking (higher is worse)