Download to read offline


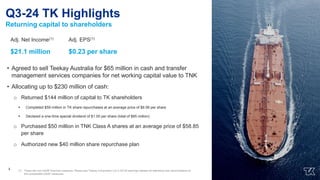
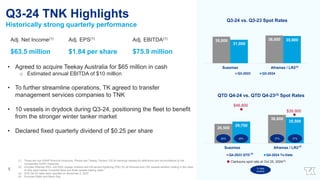
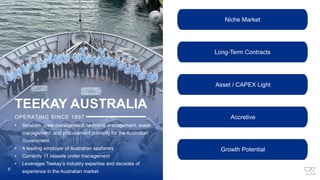
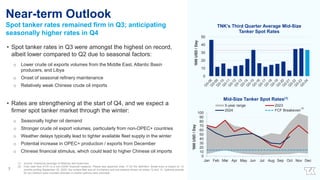
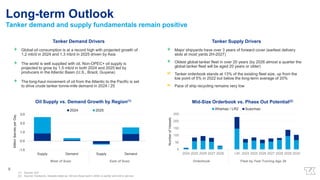

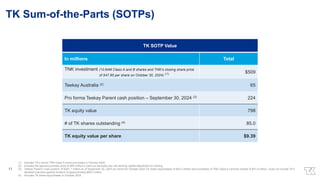

Teekay Group's Q3-2024 earnings presentation details forward-looking statements regarding the acquisition of Teekay Australia and anticipated market conditions, emphasizing the company's efforts to return capital to shareholders, including a one-time special dividend. The presentation highlights strong financial performance, with adjusted net income and plans for vessel acquisitions amidst a favorable tanker market outlook influenced by global oil demand. Key factors affecting future performance include geopolitical events, oil supply and demand dynamics, and anticipated tanker rates amid seasonal trends.


![[ls머트리얼즈]LS Materials 417200 Algorithm Investment Report](https://cdn.slidesharecdn.com/ss_thumbnails/lsmaterials417200algorithminvestmentreport-260202182715-66072c7b-thumbnail.jpg?width=640&height=640&fit=bounds)


