Download to read offline
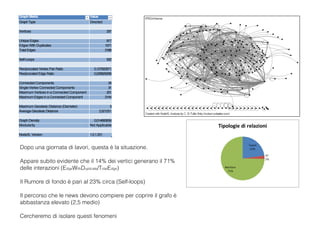
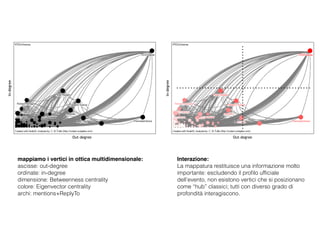
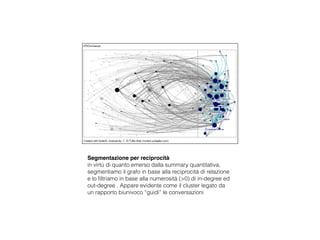
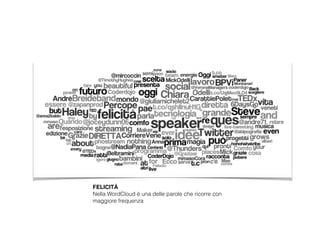
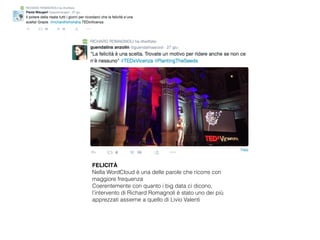
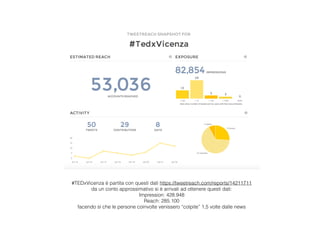

Il comunicato stampa del 27 giugno 2015 presenta un'analisi del networking sociale in occasione della prima edizione di TEDxVicenza, evidenziando che il 14% dei vertici genera il 71% delle interazioni e che il rumore di fondo è pari al 23%. L'analisi mostra una mancanza di hub classici nel grafo, con tutti i partecipanti che interagiscono a vari livelli, e sottolinea l'importanza delle relazioni biunivoche nel guidare le conversazioni. I risultati includono 428.948 impression e 285.100 reach per l'evento, con 'felicità' come parola chiave ricorrente nella wordcloud.


