Download to read offline
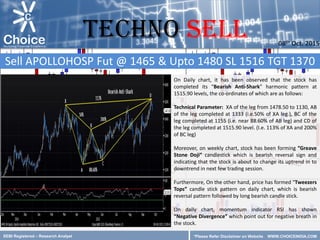


1) The document analyzes a daily and weekly chart of a stock that has completed a "Bearish Anti-Shark" harmonic pattern at 1515.90 levels. 2) On the weekly chart, a "Greave Stone Doji" candlestick formation is seen, which is a bearish reversal signal indicating the stock may change from an uptrend to a downtrend. 3) On the daily chart, momentum indicators show "Negative Divergence" and a "Tweezers Tops" bearish reversal candlestick pattern followed by a long bearish candle, pointing to negative sentiment in the stock.


