Download to read offline
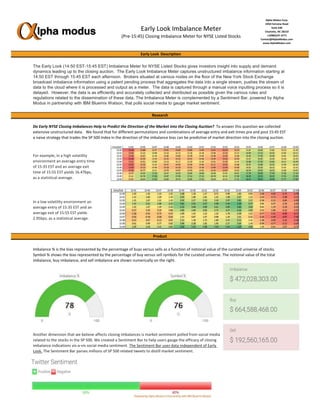

The document discusses an imbalance meter and sentiment bar tool that analyzes stock market data. The imbalance meter captures supply and demand imbalance information for NYSE stocks between 14:50-15:45 EST each day. It aggregates this unstructured data into a single stream and displays it as a meter. A sentiment bar complements the tool by analyzing social media to gauge market sentiment. Together, these tools help users understand closing imbalances and how they relate to social media sentiment going into the market close.


