Download to read offline


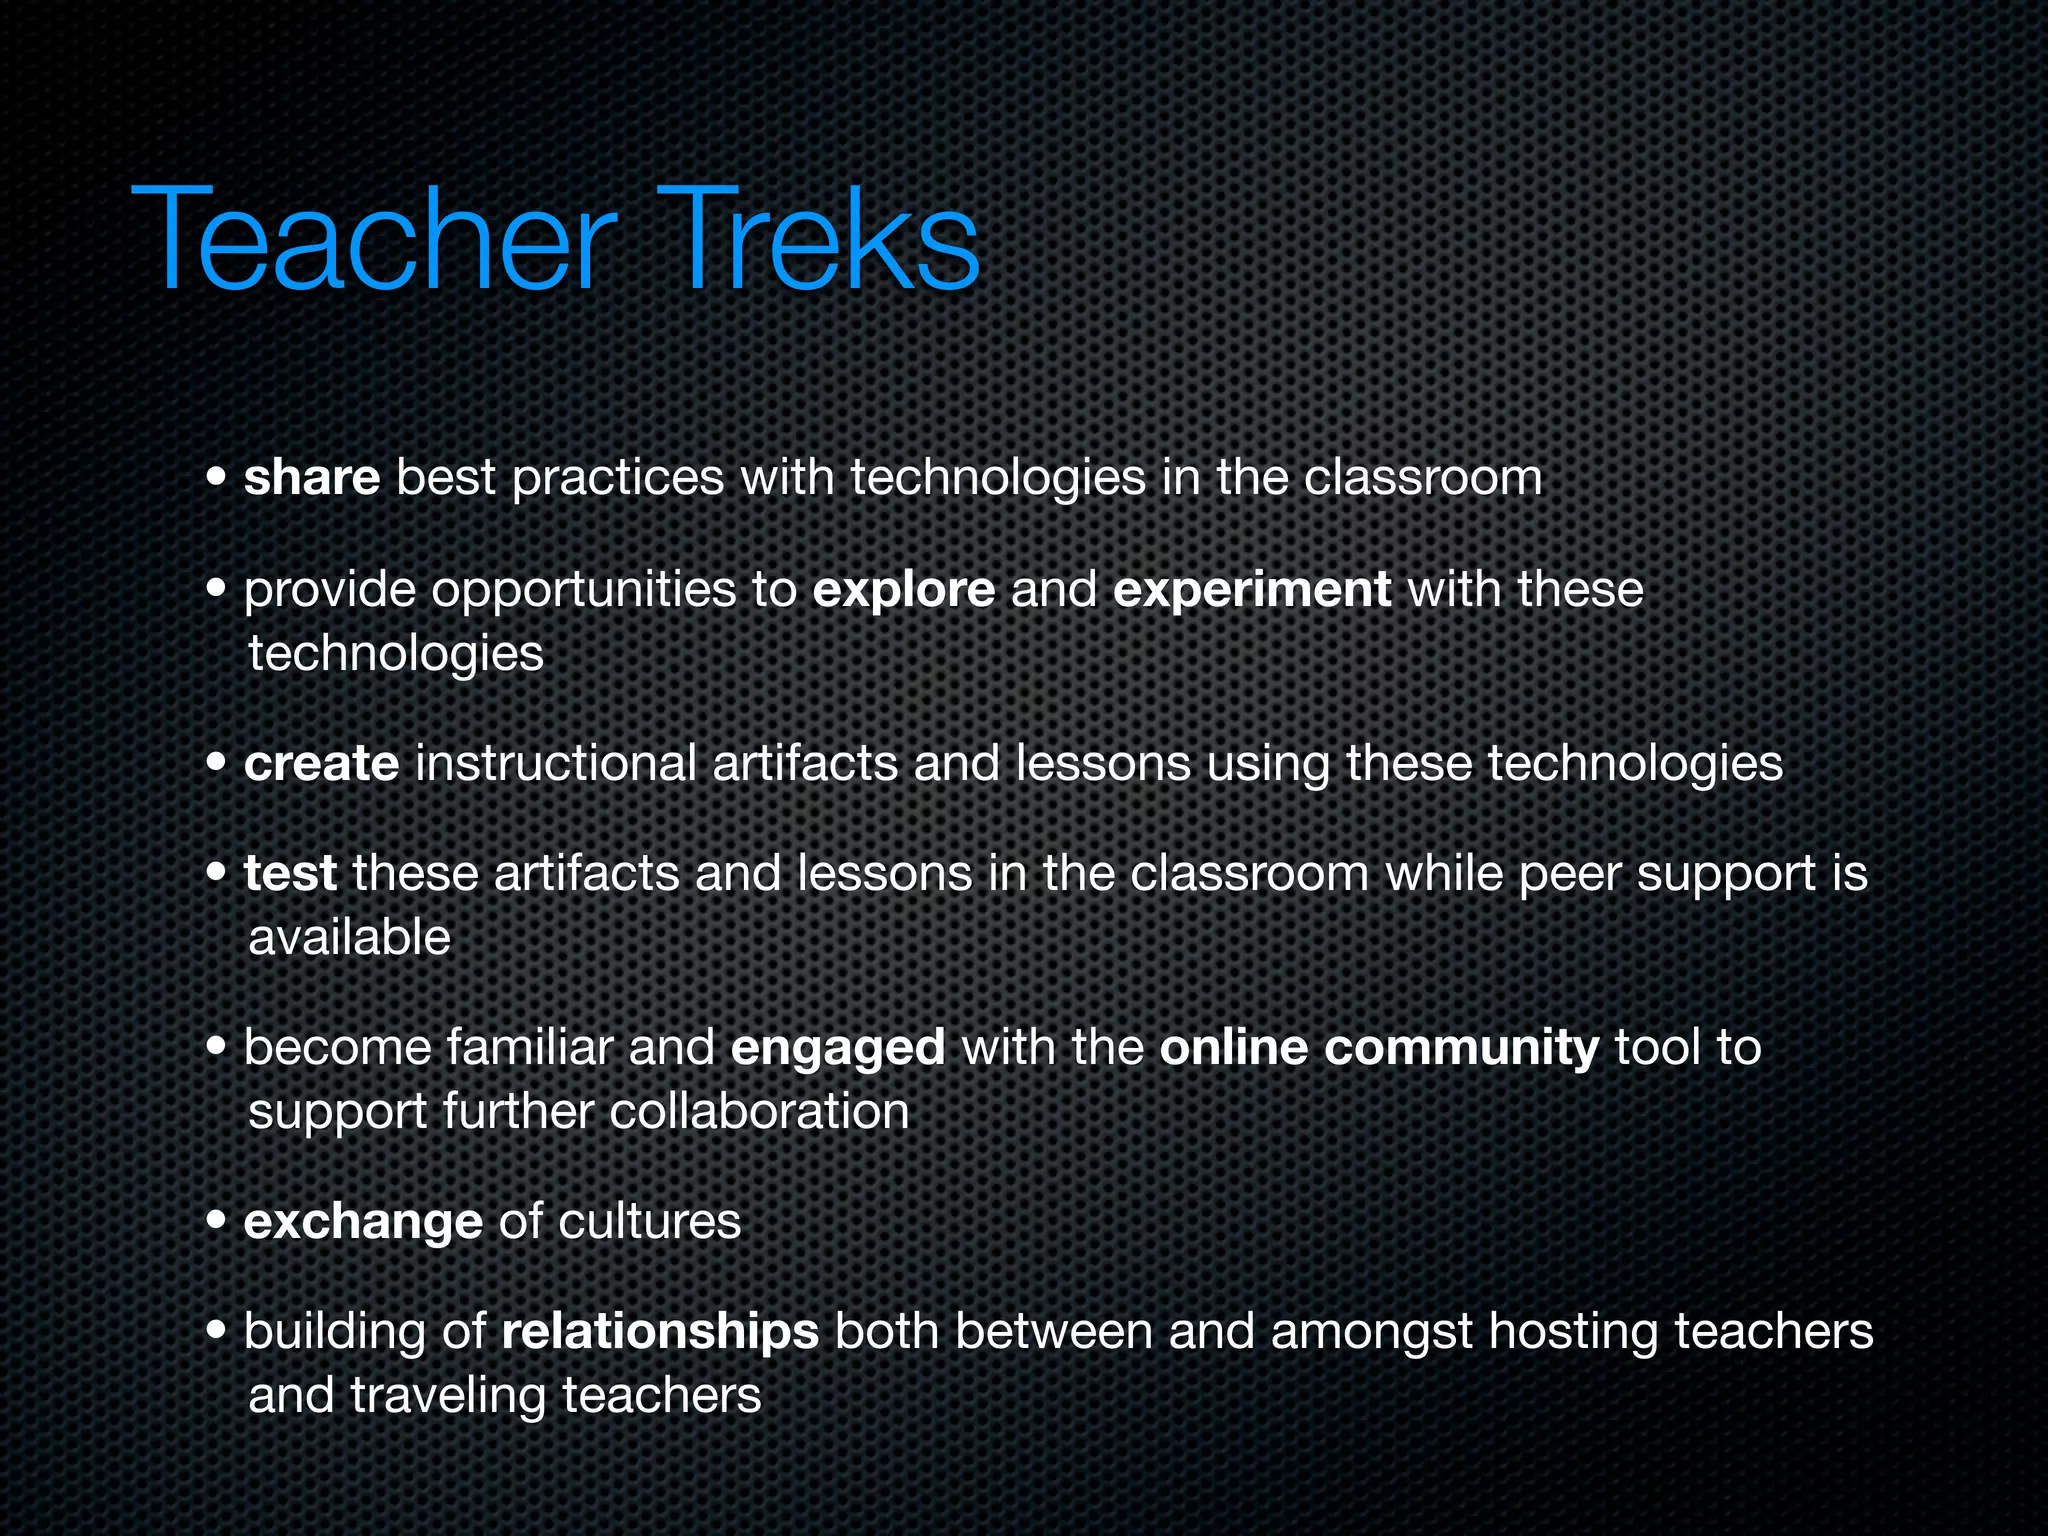
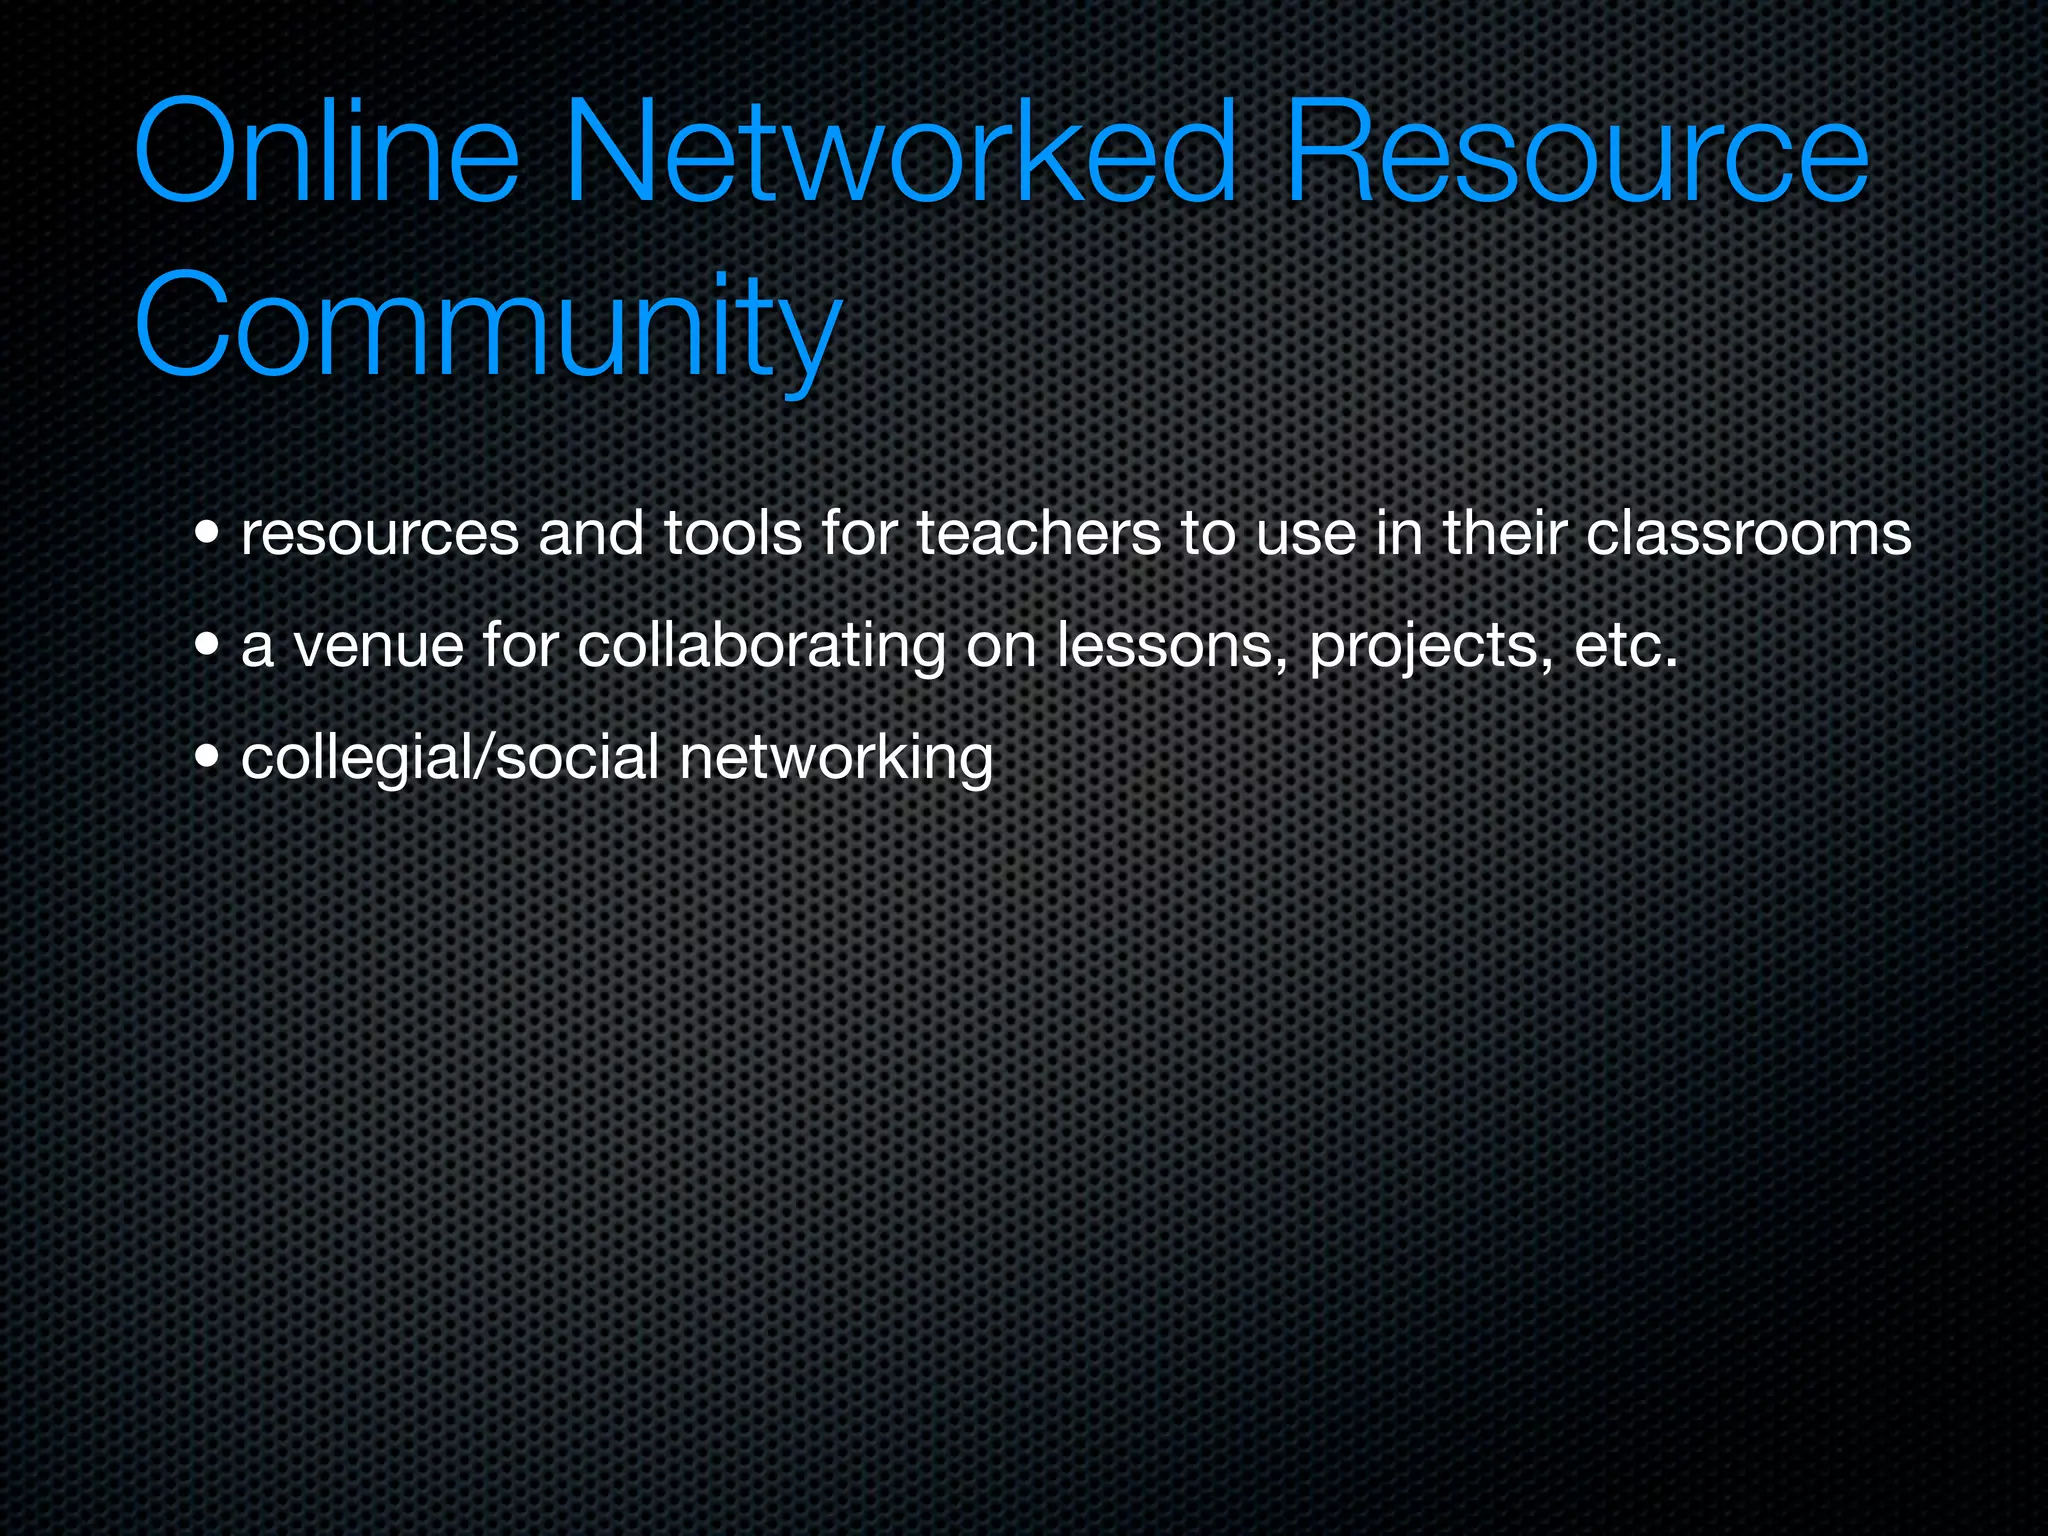

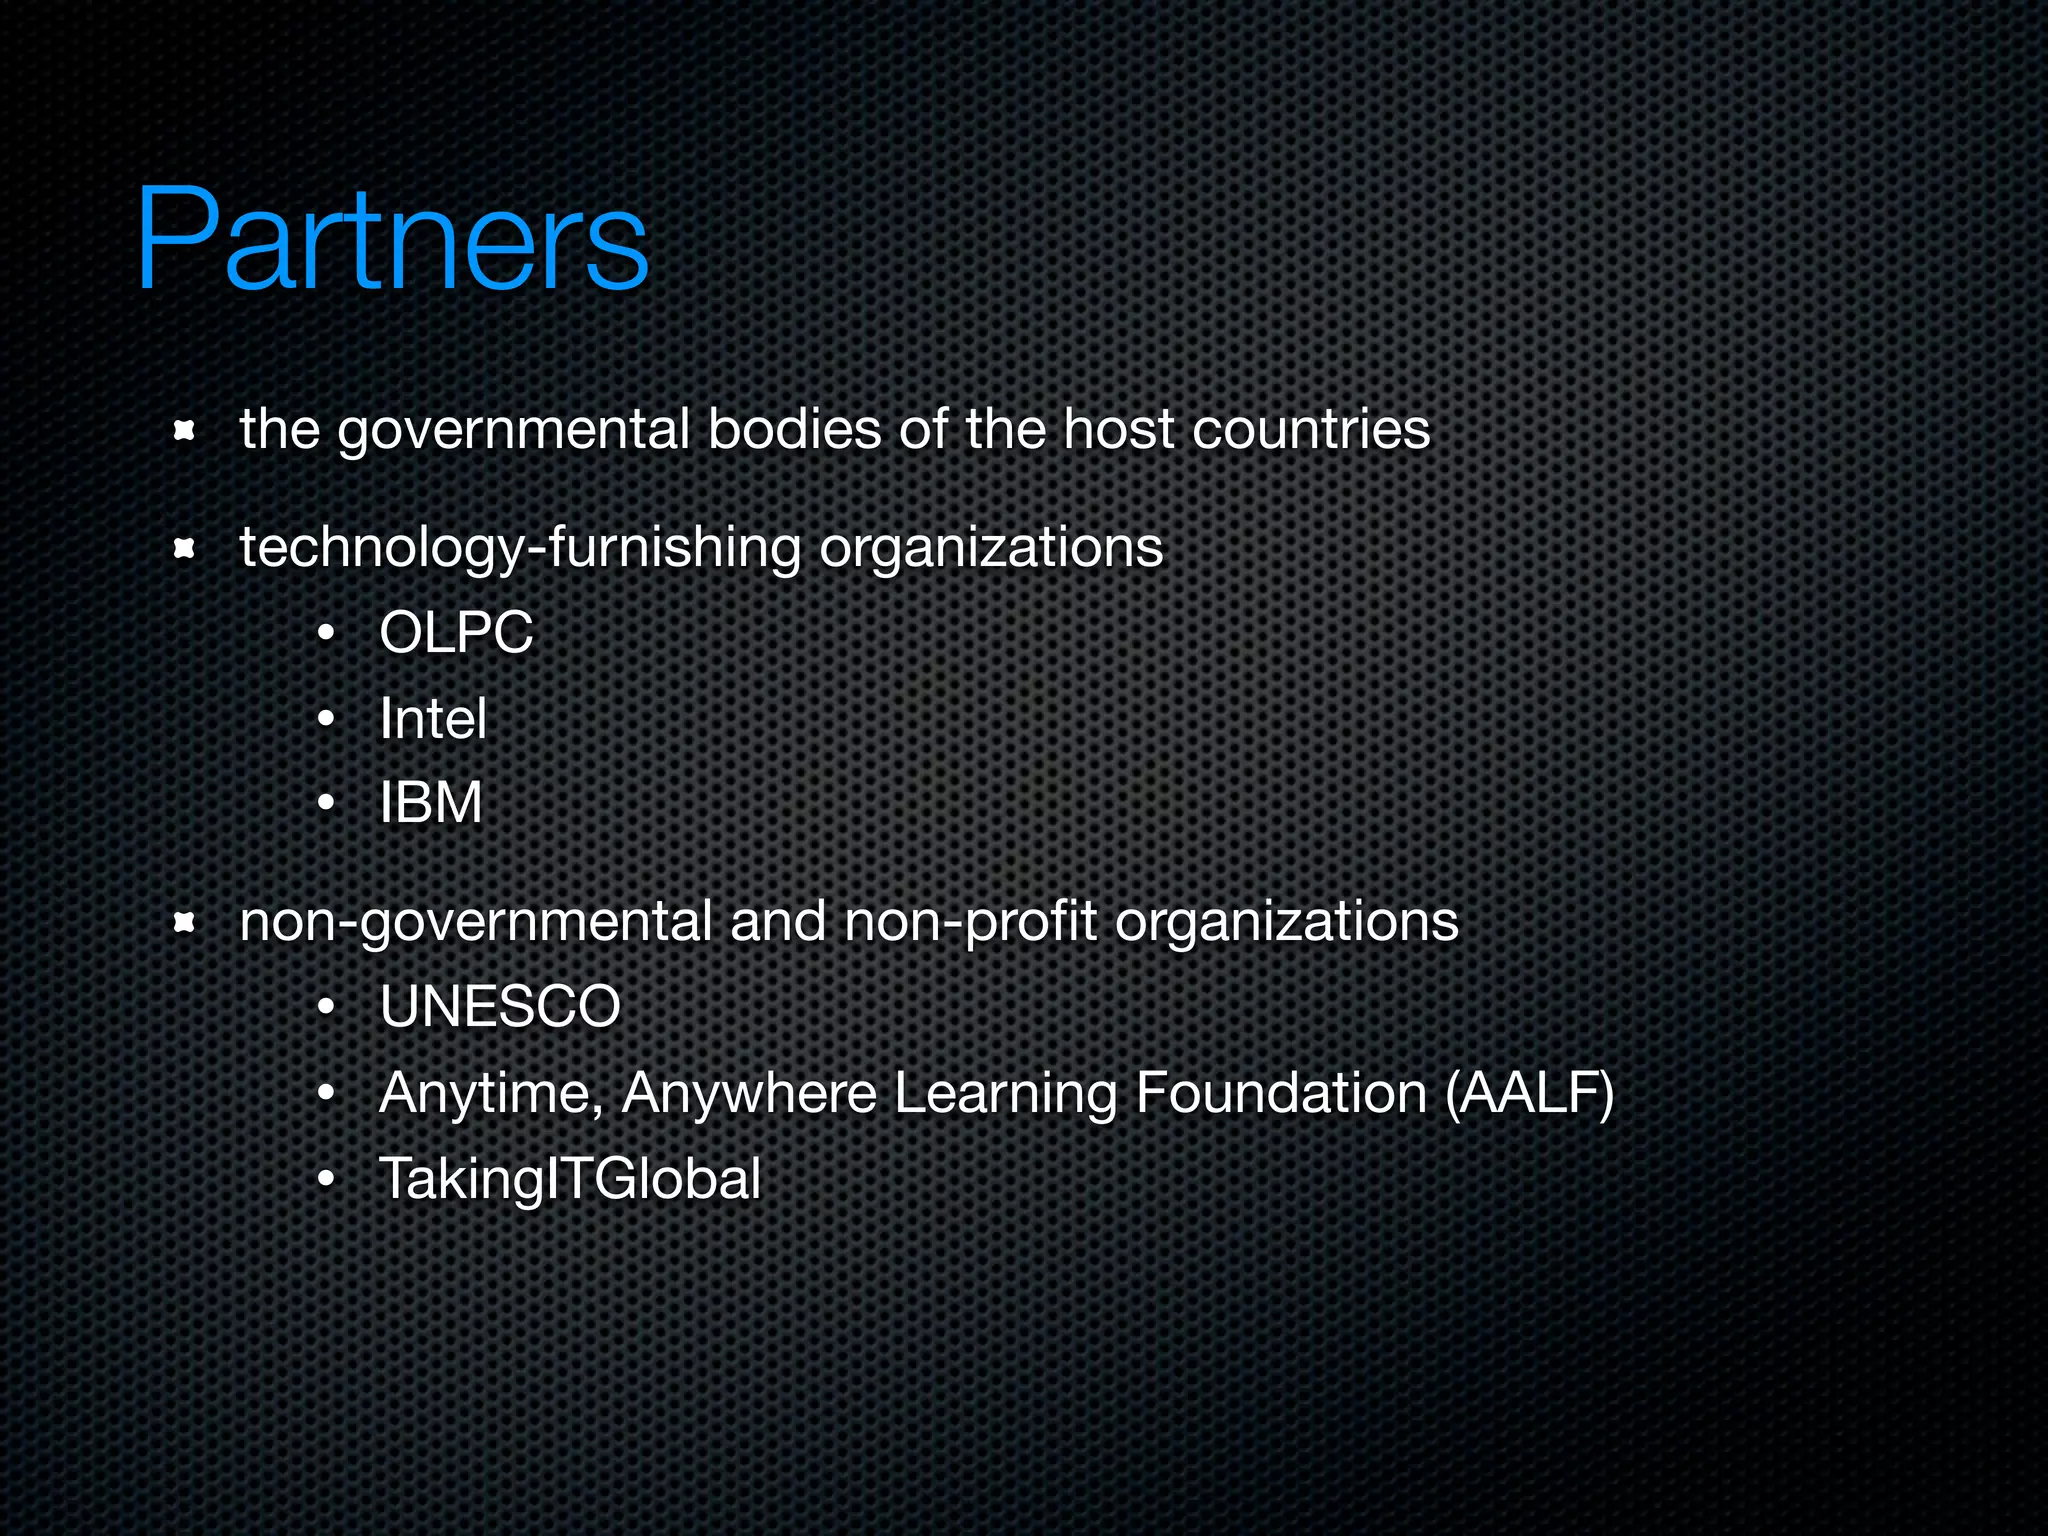
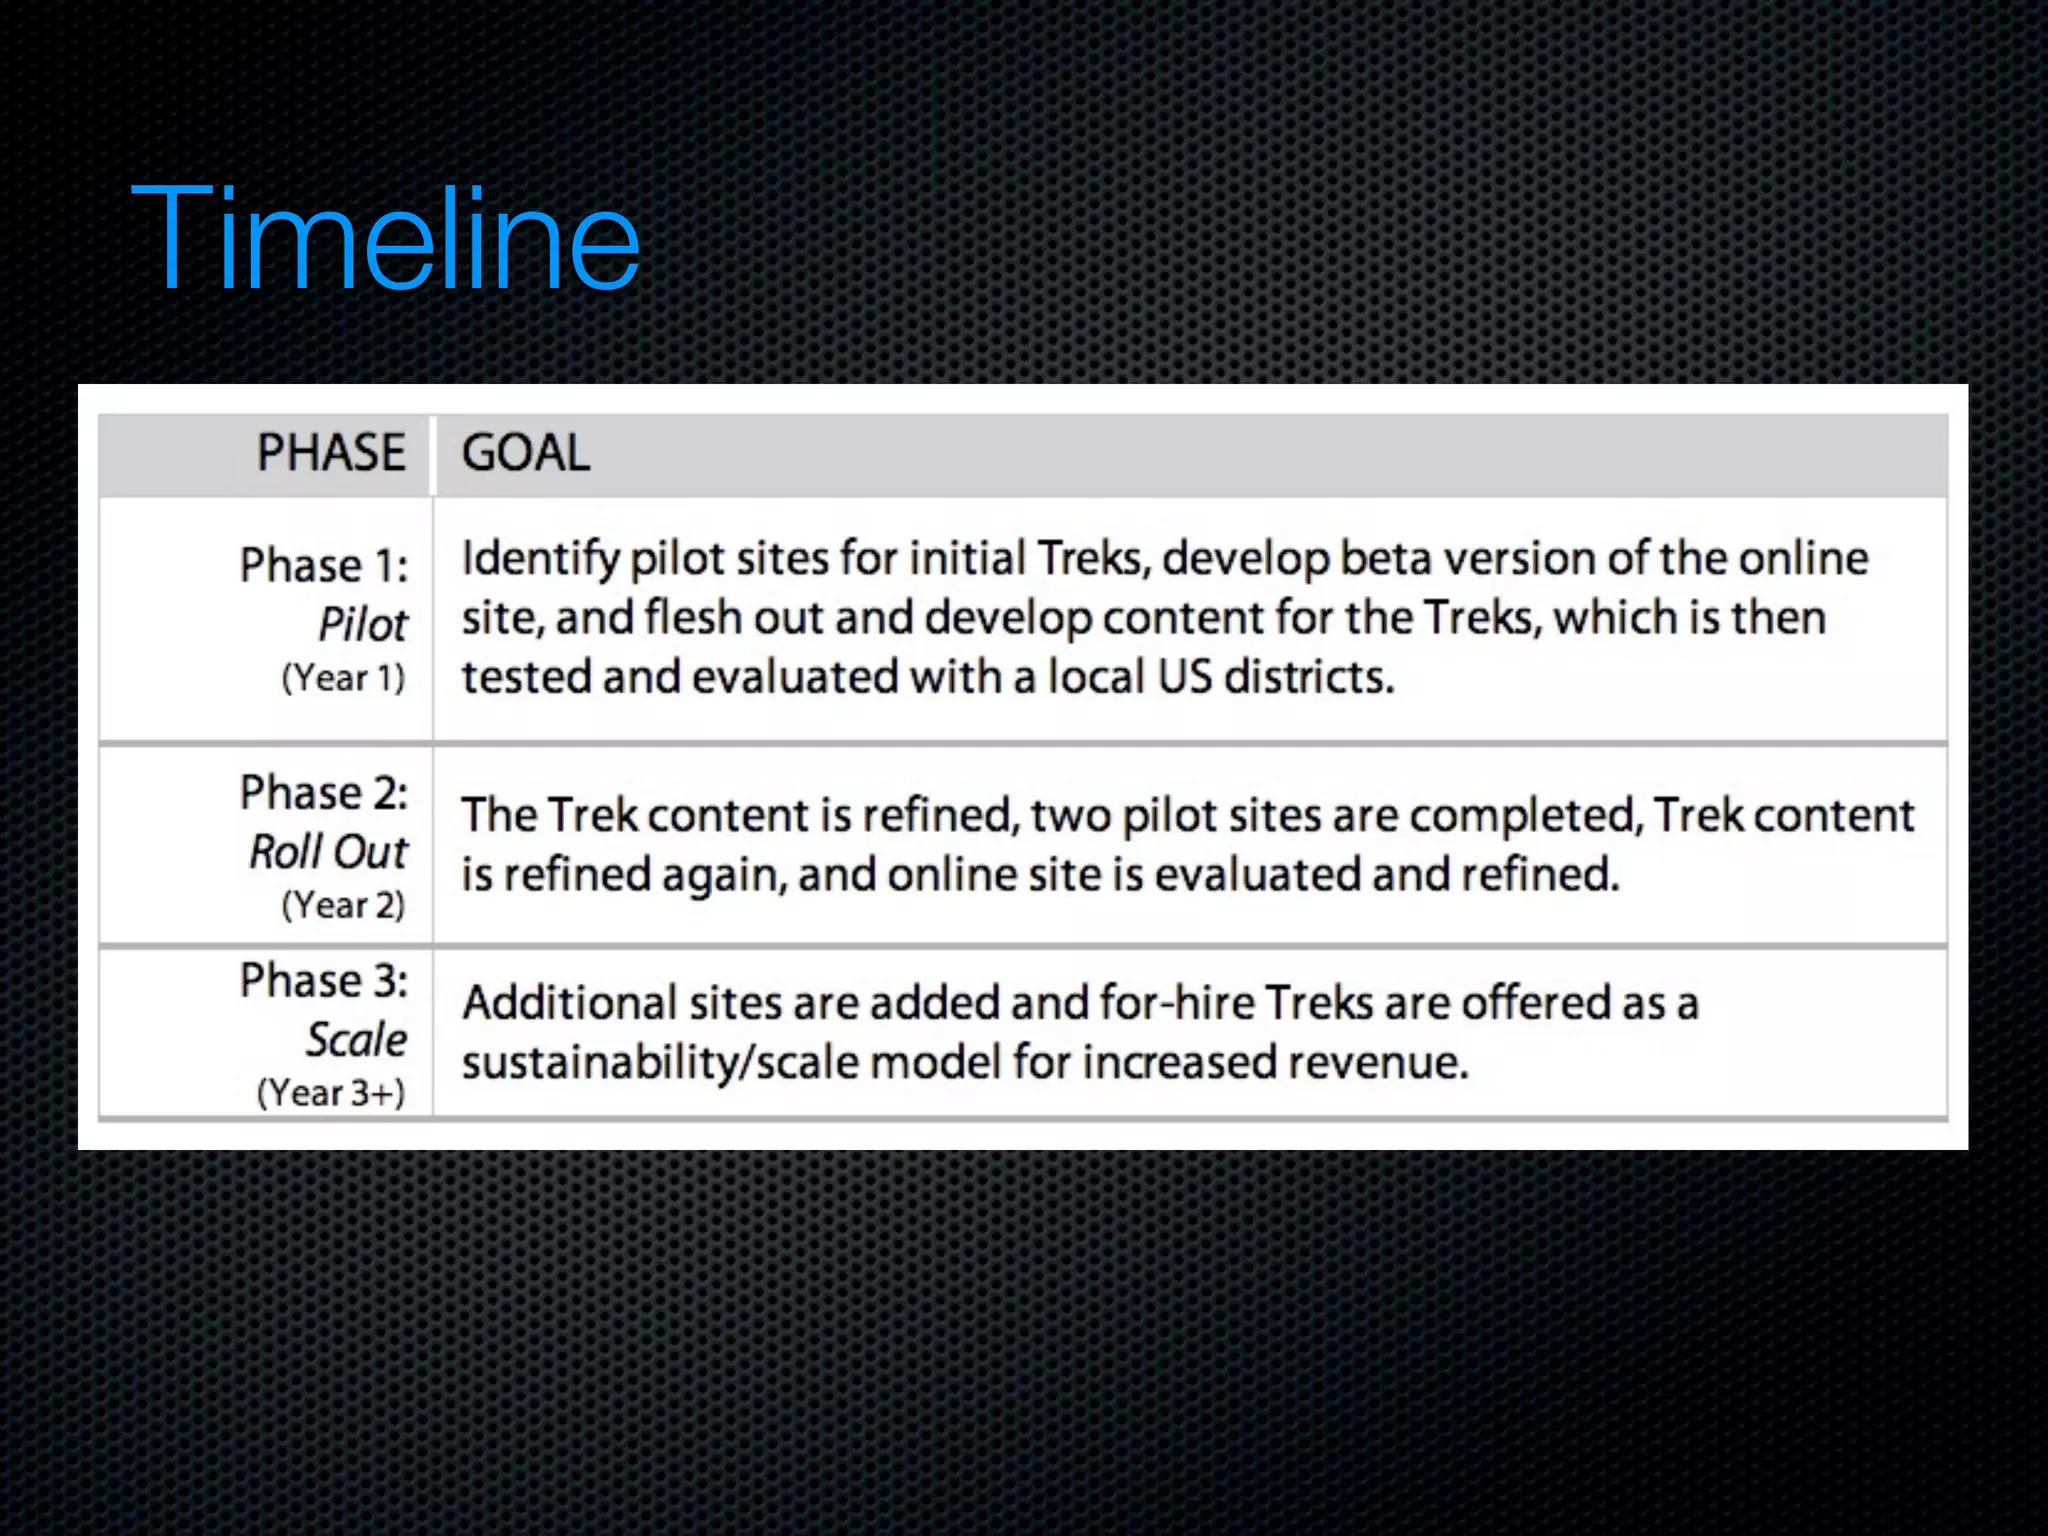
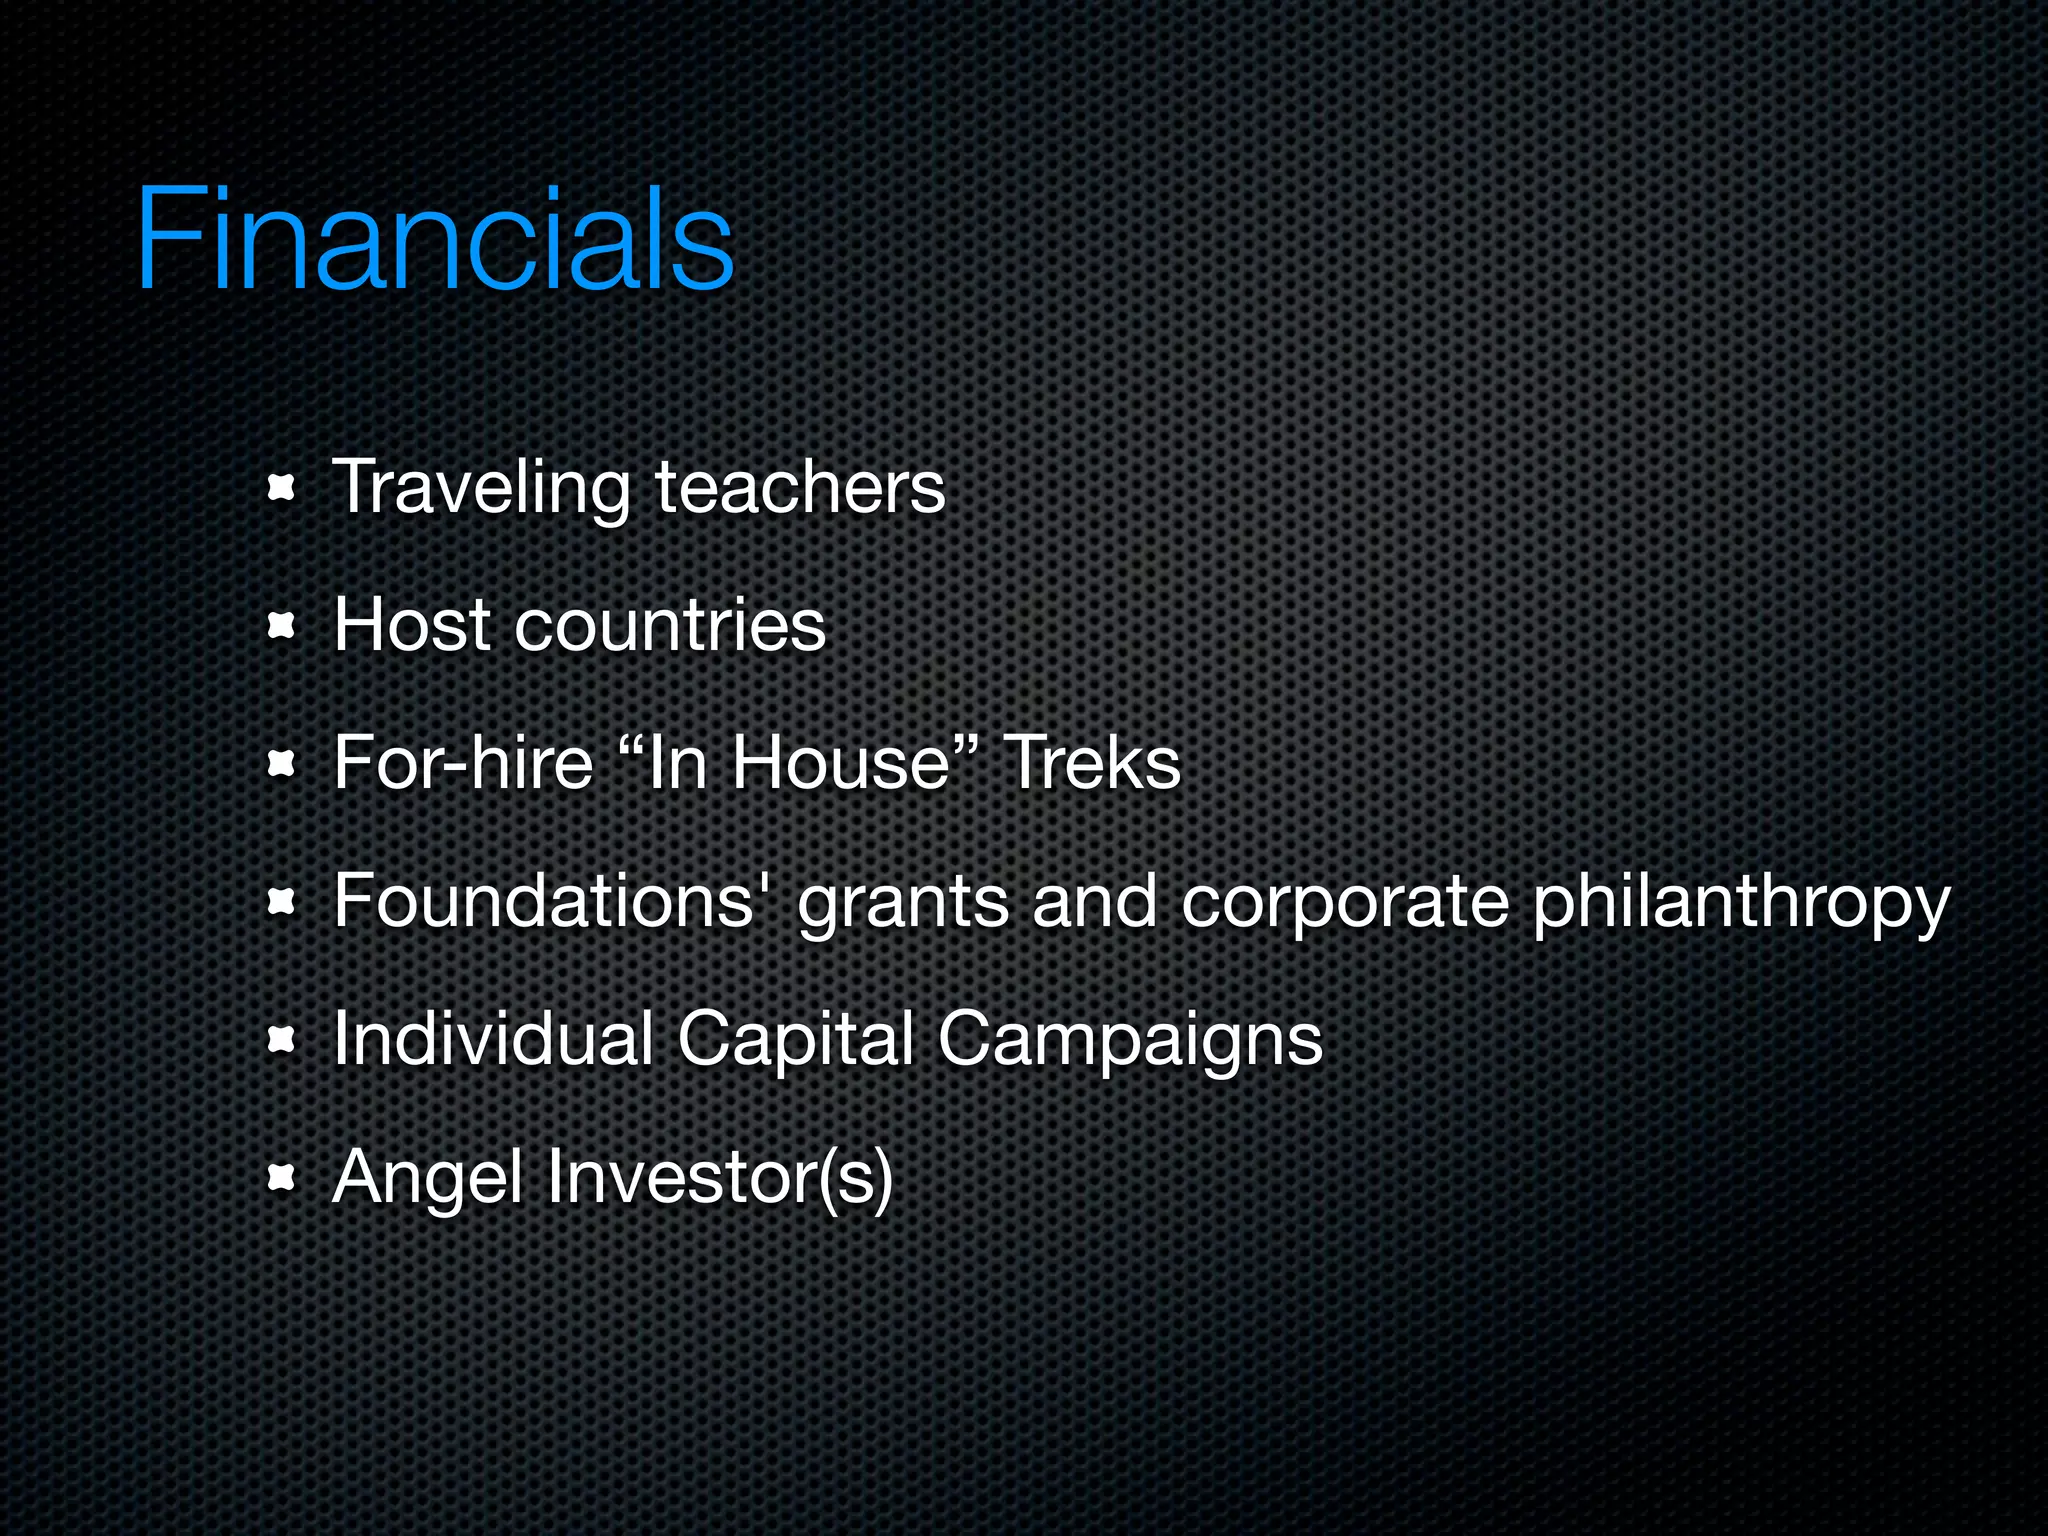


TeachforChange aims to connect and support teachers around the world through online networks and teacher exchange programs. Their goals are to leverage digital technologies for learning and foster education for all children. Key programs include Teacher Treks, where teachers physically exchange places and share best practices, and an Online Networked Resource Community for collaboration. Partners will include technology companies, governments, and non-profits. Funding will come from individual donations, foundations, corporate sponsors, and angel investors. The timeline and financial projections cover development of the website and initial operations over the first year.