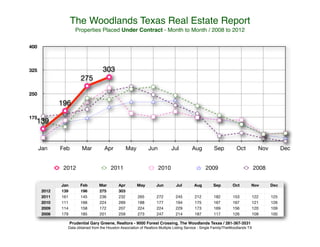
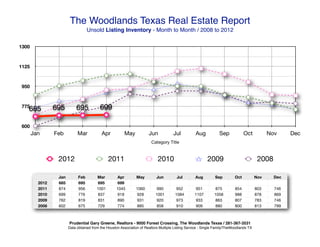
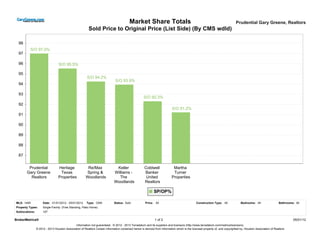
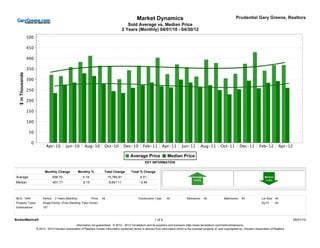
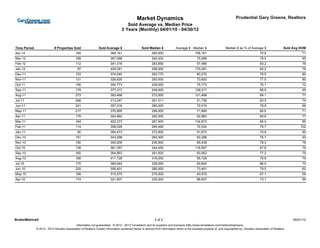
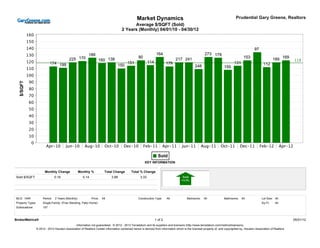
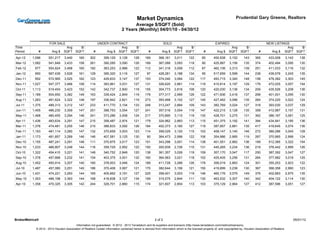
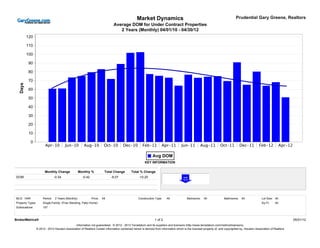
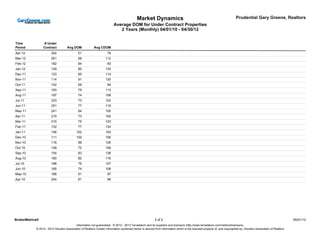
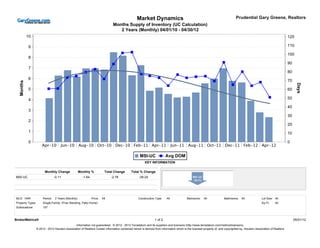
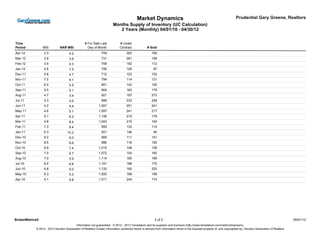
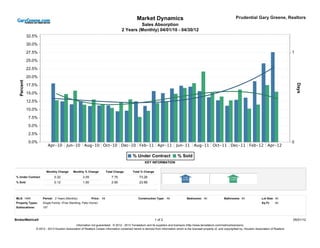
The document contains real estate data and statistics for The Woodlands, Texas from 2008 to 2012, including properties placed under contract each month, unsold listing inventory levels, and market share totals for top real estate brokers in the area. It also provides charts showing trends in average and median home sale prices and average price per square foot over a two year period from 2010 to 2012. The data is from the Houston Association of Realtors Multiple Listing Service and is presented to analyze the performance of the local real estate market.
Homes Sale and Real Estate Reports for The Woodlands TX/ May - June 2012 / Ga...Ken Brand
The real estate market in The Woodlands, Texas from May 2010 to May 2012 is summarized as follows:
- The average sold price fluctuated between $300,000-$400,000, while the median sold price was typically lower, ranging from $229,000 to $316,000.
- Inventory levels varied between 685 and 1,125 properties, with the highest levels in 2011 and lower levels in 2010 and 2012.
- Properties sold on average between 58-85 days on the market, with longer times typically in 2010-2011 and shorter times in 2012.
Home Sales Real Estate Report for The Woodlands TX / June-July 2012 / Better ...Ken Brand
The document is a real estate report for The Woodlands, TX from June/July 2012 that includes statistics on home sales, listing inventory, average and median sold prices, and days on market from 2008 to 2012. It shows that in June 2012 there were 284 home sales with an average price of $389,245 and median of $300,500. Unsold inventory was 685 listings that month. Over the last two years, the median sold price has decreased by $5,937.61 on average compared to the average sold price.
The document is a real estate report for The Woodlands, TX from June/July 2012 that includes the following key information:
1) Home sales and listing inventory statistics from 2008 to 2012 that show trends in properties sold, average sold prices, days on market, and supply of inventory.
2) Charts tracking properties under contract and unsold inventory levels month-to-month from 2008 to 2012.
3) Data on average and median sold prices from June 2010 to June 2012, including the difference between the two prices and average days on market.
4) Statistics for factors like number of properties sold, average price, and price per square foot from June 2010 to June 2012.
Real estate market report woodlands area - august 2012Katie Emery-Cooper
The document is a real estate sales report for The Woodlands, TX from August/September 2012 that includes the following key information:
- Home sales and listing inventory numbers month-to-month from 2008 to 2012, showing general increases.
- Average and median sold prices month-by-month, with the average consistently higher than the median.
- Average days on market and months of inventory have remained steady from 50-80 days and 5-10 months respectively.
The Woodlands Home Sales and Market Report | September 2012 | Better Homes An...Ken Brand
This real estate report summarizes home sales data in The Woodlands, TX from August/September 2012. It shows that in August 2012, there were 221 homes sold with an average price of $351,549 and median price of $269,500. The number of homes under contract has decreased month-to-month in 2012 while the number of unsold listings in inventory has remained around 660-699 homes. The report also provides charts comparing the average and median home prices over the last two years.
The Woodlands TX Home Sales Report | February 2013Ken Brand
The document is a real estate report for The Woodlands, Texas that provides monthly data from 2009 to 2013 on home listing inventory, properties under contract, average and median sold prices, average days on market, and months of inventory. Key metrics include a median sold price of $295,950 for May 2012, average days on market of 66 for January 2013, and 402 properties in inventory for January 2013. The report indicates that inventory levels have declined since 2011 while home sales and prices have increased.
Real Estate Home Sales Market Report For The Woodlands TX | Oct. 2012 | Bette...Ken Brand
The document is a real estate sales report for The Woodlands, TX from September/October 2012. It includes data on homes sales, listing inventory, average and median sold prices, average price per square foot, average days on market, and months supply of inventory on a month-to-month basis from 2008 to 2012. The key information shows a decrease in the number of properties sold, average sold price, and median sold price in September 2012 compared to the previous month. The median price as a percentage of average price was 79.8%, suggesting home prices remained stable.
The Woodlands Real Estate Homes Sales Reports | March 2013Ken Brand
The document is a real estate report for The Woodlands, Texas from March 2013. It includes data on listing inventory, homes sold, average and median sold prices, average price per square foot, average days on market, and months of inventory over multiple months from 2009 to 2013. It also shows properties under contract and expired listings month by month from February 2011 to February 2013 with average prices and price per square foot.
The document discusses the benefits of exercise for mental health. Regular physical activity can help reduce anxiety and depression and improve mood and cognitive functioning. Exercise boosts blood flow, releases endorphins, and promotes changes in the brain which help regulate emotions and stress levels.
- The QE Index fell 0.73% for the week to close at 9,652.35 points. Trading value increased 41.56% to QR1.50bn while volume rose 35.18%.
- IQCD reported weaker than expected 3Q2013 results with net income down 12% QoQ and 32% YoY. DHBK's 3Q2013 net profit also missed estimates.
- QIBK's 3Q2013 results were in line with estimates. Net profit rose 1.8% QoQ driven by higher net financing income.
Come checkout our real estate tour of this Million Dollar property with an Ozark setting on October 22, 2009 from 4-6.
Wine and Cheese Party 10/22 from 4-6 PM.
Este mensaje habla sobre tener fe en Dios y en la bondad de los amigos. Menciona que Dios cuidará a la persona que recibe el mensaje y su familia, y que el amor de Dios no tiene fin. Luego predice que algo bueno le pasará al receptor a las 7:40 pm del día que reciba el mensaje. Insta al receptor a pasar el mensaje a otros amigos.
Sondaggio sul mercato delle abitazioni in Italiaidealistait
Cosa prevedono gli agenti immobiliari per il mattone. Maggiori info su: http://www.idealista.it/news/archivio/2012/11/14/065472-presente-futuro-dellimmobiliare-tempi-medi-prezzi-sconti-tabelle
The widow weaves a beautiful brocade of a palace called Sun Palace. Her son Chen suggests she weave the painting as a brocade. She works for months to complete it. A wind carries the brocade away to Sun Palace. Chen journeys to retrieve it, facing dangers along the way. He finds the fairy ladies at Sun Palace copying the brocade. They agree to return it if he takes it back the next day. Chen brings the brocade back to his mother, who steps into it with Chen and finds herself transported to Sun Palace, where she and Chen now live.
L’evoluzione della gestione della sicurezza nel Gruppo WürthNicola Bottura
La gestione della sicurezza nel gruppo Würth: dalla certificazione 18001 ottenuta sin dal 1999 all'implementaazione di modelli di sicurezza basati sul fattore umano e i comportamenti.
FÉNIX DIRECTO launches an iPhone and iPad app, another step in the relationsh...FÉNIX DIRECTO Seguros
This application for devices running iOS operating system joins the existing one for smartphones with Android
The application allows to quickly calculate the price of an insurance policy or locate a repair shop
This free service let user to access social networks where Fénix Directo is present
FÉNIX DIRECTO ® Seguro que Sí
Royal Wessanen nv reported financial results for Q3 2011. Autonomous revenue growth was 8.0% driven by strong performances in Grocery and ABC segments. Normalized EBIT increased to €6.2 million due to revenue growth and higher margins. Going forward, the company remains cautiously optimistic as it continues executing its strategy to improve performance across business segments.
Q4FY14 Result: Bajaj Finance continues to reap the benefits of healthy consum...IndiaNotes.com
Bajaj Finance (BAF) reported a 11% year-over-year increase in 4QFY14 profit at INR1.82 billion, which was below estimates due to a decline in net interest margins from shifting loan mix to lower-yielding mortgages and higher operating expenses from ongoing investments in new business lines. Asset quality remained healthy with non-performing assets stable at 1.18% despite a corporate loan slippage. The report maintains a "Buy" rating with a target price of INR2,018, but reduces FY15/16 earnings estimates by 5-6% to factor lower margins and higher costs from the loan mix shift and investments.
The document contains real estate market data for The Woodlands, Texas from 2011 to 2013. It shows trends for total active listings, new contracts written, average days on market, average list price vs sale price, average months of inventory, and total showings. Overall, the data indicates that the real estate market in The Woodlands has improved from 2011 to 2013 with decreasing active listings and months of inventory as well as increasing sales prices and total showings.
Il sondaggio non è rappresentantivo dal punto di vista statistico ma rappresenta uno spaccato interessante della presenza dei cittadini di Martina Franca su Facebook
The real estate market in The Woodlands, Texas from May 2010 to May 2012 is summarized as follows:
- The average sold home price fluctuated between $300,000-$400,000, while the median price was typically lower, ranging from $229,000 to $316,000.
- Inventory levels varied between 665 and 1,125 properties, with the highest levels in 2011 and lower amounts in 2012.
- Homes typically sold within 2 months on average, with days on market ranging from 58 to 102 days over the two-year period.
Home sales market report collection june july 2012 the woodlands txwcblbball6508
The document is a real estate report for The Woodlands, TX from June/July 2012 that includes the following key information:
1) Home sales and listing inventory statistics from 2008 to 2012 that show trends in properties sold, average sold prices, days on market, and supply of inventory.
2) Average and median sold prices per month from June 2010 to June 2012, which fluctuated between $300,000-$400,000.
3) Metrics like average price per square foot also varied monthly but were typically around $150-200 per square foot.
The document is a real estate report for The Woodlands, TX from June/July 2012 that includes monthly data from 2008 to 2012. It provides statistics on homes listed for sale including inventory levels, average and median sold prices, average days on market, and sales absorption rates. Properties under contract in 2012 were highest in May at 323 and lowest in January at 139. Unsold inventory levels were similar month-to-month in 2012 ranging from 665 to 699 properties. Median sold prices were generally lower than average prices from June 2010 to June 2012 with the largest differences in January 2012 at $170,281.
The Woodlands, TX Home Sales Market Report for August/September 2012Lisa Lasley
The document is a real estate sales report for The Woodlands, TX from August/September 2012 that includes the following key information:
- Home sales and listing inventory numbers month-to-month from 2008 to 2012 showing trends.
- Average and median sold prices, average price per square foot, and average days on market for each month.
- Months supply of inventory for each month.
The report provides an overview of the real estate market in The Woodlands, TX with statistics on home sales, inventory, prices and other trends from 2008 to the present. It allows analysis of how the market has changed over time.
The document is a real estate sales report for The Woodlands, TX from September/October 2012. It includes data on homes sales, listing inventory, average and median sold prices, average price per square foot, and average days on market, month by month from 2008 to 2012. Properties placed under contract and unsold listing inventory levels are shown declining from 2008 highs to current lower levels. The median sold price is typically 75-80% of the average price.
The document is a real estate sales report for The Woodlands, TX from September/October 2012. It includes data on homes sales, listing inventory, average and median sold prices, average price per square foot, and average days on market, month by month from 2008 to 2012. Properties placed under contract and unsold listing inventory levels are shown declining from 2008 highs to current lower levels. The median sold price as a percentage of average price ranged from 60-80% over the reported periods, suggesting a right-skewed price distribution with some higher-end home sales pulling the average up.
The document is a real estate report for The Woodlands, Texas that provides monthly data from 2009 to 2013 on home listing inventory, properties under contract, average and median sold prices, average days on market, and months of inventory. Key metrics showed that in February 2013 average sold price was $387,072, median was $296,075, and average days on market was 66 days. Unsold inventory was 402 properties that month.
The document is a real estate report for The Woodlands, Texas that provides monthly data from 2009 to 2013 on home listing inventory, properties under contract, average and median sold prices, average days on market, and months of inventory. Key metrics show that in January 2013 there were 125 homes sold with an average price of $387,072 and median of $296,075, taking an average of 66 days to sell.
The woodlands home sales reports feb 2013Mike Tabbert
The document is a real estate report for The Woodlands, Texas that provides monthly data from 2009 to 2013 on home listing inventory, properties under contract, average and median sold prices, days on market, and supply of inventory. Key metrics showed that in February 2013 the average sold price was $387,072, the median was $296,075, and the average days on market was 66 days.
The woodlands home sales reports feb 2013Mike Tabbert
The document provides real estate data for The Woodlands, Texas for the period of 2009-2013. It includes statistics such as listing inventory, homes sold, average and median sold prices, average days on market, and months of inventory. The data is broken down by month to show trends over time. Overall, the document analyzes the real estate market conditions in The Woodlands through detailed housing metrics.
The woodlands home sales reports feb 2013Debra Wymore
The document provides real estate data for The Woodlands, Texas for the period of 2009-2013. It includes statistics such as listing inventory, homes sold, average and median sold prices, average days on market, and months of inventory. The data is broken down by month to show trends over time. Overall, the document analyzes the real estate market conditions in The Woodlands through detailed housing metrics.
Real estate home sales reports all the woodlands december 2012Mike Tabbert
The document is a real estate sales report for The Woodlands, Texas in December 2012. It includes data on listing inventory, home sales, average and median sold prices, average price per square foot, average days on market, and months of inventory from 2008 to 2012. The key metrics provided are that in November 2012 there were 166 homes sold with an average sold price of $333,222 and median of $265,000. The average price per square foot was $2,868 and average days on market was 52 days.
The Woodlands Real Estate and Homes Sales Report | December 2013Ken Brand
The document is a real estate sales report for The Woodlands, Texas in December 2012. It includes data on listing inventory, home sales, average and median sold prices, average price per square foot, average days on market, and months of inventory from 2008 to 2012. The key metrics provided are that in November 2012 there were 166 homes sold with an average sold price of $333,222 and median of $265,000. The average price per square foot was $2,868 for homes sold that month.
The document is a real estate sales report for The Woodlands, Texas in December 2012. It includes data on listing inventory, home sales, average and median sold prices, average price per square foot, average days on market, and months supply of inventory over several months and years. The data is presented in tables and charts showing month-by-month comparisons from 2008 to 2012.
This document is a real estate report for The Woodlands, Texas from March 2013. It contains data on listing inventory, home sales, average and median sold prices, average price per square foot, average days on market, months of inventory, and sold price to list price ratios from 2009 to 2013. The data is presented on a monthly basis to show trends over time.
The Woodlands Texas Market Report - March 2013Rebekah Snipp
Multiple offer situations, hot pocket listings, SOLD before they ever hit the MLS. These are some of the things going on in the local market. Give me a call today or message me, 832-814-6120 buyer activity is hot and inventory is very low. I appreciate the opportunity to earn your business. Rebekah Snipp rsnipp21@gmail.com
This real estate report for The Woodlands, Texas in November 2012 contains the following key information:
- Average and median sold home prices and average price per square foot from 2008-2012.
- Average days on the market from 2008-2012.
- Monthly supply of homes for sale from 2008-2012.
- Percentage of homes sold at or above list price by broker.
- Unsold home inventory levels from 2008-2012.
- Homes placed under contract from 2008-2012.
- Relationship between average and median home prices from October 2010 to October 2012.
The document is a real estate report for The Woodlands, Texas in November 2012 that includes several charts and graphs summarizing key housing market metrics. It shows trends in average and median home prices, price per square foot, days on market, and housing inventory levels over multiple months and years. Overall, the data indicates declining home prices, shorter times on market, and reduced housing supply in The Woodlands market between 2008-2012.
This real estate report for The Woodlands, Texas in November 2012 contains the following key information:
- Average and median sold home prices and average price per square foot fluctuated monthly from 2008 to 2012. Average days on market also varied each month.
- Unsold home inventory decreased from 2008 to 2012, with the lowest levels in October and November 2012.
- Homes placed under contract increased from January to March 2012 then declined through the rest of the year.
- In October 2012, the average home sold for $341,683 while the median was $274,708, indicating higher priced homes skewed the average upward.
The woodlands november 2012 market r eport collectionsfinley2388
This real estate report for The Woodlands, Texas in November 2012 contains the following key information:
- Average and median sold home prices and average price per square foot from 2008-2012.
- Average days on the market from 2008-2012.
- Monthly supply of homes for sale from 2008-2012.
- Percentage of homes sold at or above list price by broker.
- Unsold home inventory levels from 2008-2012.
- Homes placed under contract from 2008-2012.
- Relationship between average and median home prices from October 2010 to October 2012.
Similar to The Woodlands TX Real Estate Market Report-May 2012 (20)
This document provides a real estate report for The Woodlands, Texas for October 2016. It includes data on listing inventory, homes sold, average and median sold prices, average price per square foot, average days on market, and months of inventory. Listing inventory was 878 homes in October 2016, down from 901 in September. The average sold price was $412,018 and the median was $335,000. Average days on market was 81.33 days.
The document provides real estate data for The Woodlands, Texas for April 2016 and the previous year. It includes information on listing inventory, homes placed under contract, average and median sold prices, average price per square foot, average days on market, and months of inventory. Specific metrics are provided month-by-month for 2016 and 2015. The data comes from the Houston Association of Realtors Multiple Listing Service for single family homes in The Woodlands.
The document provides a real estate report for The Woodlands, TX in March 2016. It includes data on listing inventory, home sales, average and median sold prices, average price per square foot, average days on market, and months supply of homes for sale. The months supply for most price ranges was between 5-6 months, indicating a balanced market. Price ranges over $900,000 had higher months supplies of 9 months and over, suggesting a buyer's market at the higher end.
The housing market continues to favor sellers due to low inventory levels driven by seasonal factors, slow new home construction since the housing crash, and existing homeowners choosing not to sell. While low mortgage rates present a good opportunity for buyers, many potential first-time buyers continue to be sidelined by stagnant wage growth, high rent prices, and issues with home affordability as prices rise faster than incomes. However, experts advise potential home buyers to act sooner rather than later to take advantage of still-low mortgage rates before further price increases diminish their purchasing power.
This real estate report summarizes housing data for The Woodlands, Texas area over a two-year period. It shows that in January 2016, there were 788 homes listed for sale, with 486 homes selling at an average price of $486,370. Homes spent an average of 60.5 days on the market. The report also tracks additional metrics like average sales price per square foot, months of inventory, and percentage of original list price received. Charts show housing trends month-by-month for two years.
This real estate report summarizes housing data for The Woodlands, Texas from February 2013 to February 2015. It includes information on listing inventory, homes placed under contract, average and median sold prices, average price per square foot, and average days on market by month. For example, in February 2015 there were 591 homes listed, 170 homes placed under contract, and the average sold price was $439,676.
This document summarizes real estate data for The Woodlands, Texas for January 2015 and the preceding years. It includes information on listing inventory, homes placed under contract, average and median sold prices, average price per square foot, and average days on market from month to month. The data is from the Houston Association of Realtors Multiple Listing Service and is presented in tables and charts comparing 2015 to previous years.
This document contains real estate market data and statistics for The Woodlands, Texas from 2009 to 2014. It includes information on listing inventory, homes sold, average and median sold prices, average price per square foot, average days on market, and months of inventory by month. Charts show trends over time for these metrics. Additional sections provide details on average days on market for homes under contract and months of inventory calculated using common industry methods.
This document provides real estate market data and statistics for Magnolia, TX for the period of September 2012 through September 2014. It includes information on average and median home sale prices, average price per square foot, average days on market, and months supply of inventory on a monthly basis. Overall, the data shows fluctuations in home prices, sales volume, and supply and demand in the local housing market over the past two years.
The document is a real estate report for The Woodlands, Texas that provides monthly data from 2009 to 2014 on listing inventory, homes sold, average and median sold prices, average price per square foot, and average days on market. It also includes charts showing trends in these metrics over time.
This document provides real estate data and statistics for The Woodlands, Texas for the period of June 2012 through June 2014. It includes information on listing inventory levels, homes sold, average and median sold prices, average price per square foot, and average days on market for properties each month. Charts display trends over time for properties placed under contract, unsold inventory, sales price to list price percentage. The source of the data is the Houston Association of Realtors Multiple Listing Service for single-family homes in The Woodlands area.
This document provides real estate data for Spring, TX (zip code 77386) from March 2012 to March 2014. It includes information on average and median sold home prices, average price per square foot, average days on market, and monthly supply of inventory over time. Key metrics are reported monthly to show trends in the local real estate market.
This real estate report summarizes home sales data in Magnolia, TX (zip code 77354) from March 2012 to March 2014. It includes charts showing the average and median sold prices, average price per square foot, average days on market, and months supply of inventory over time. The key metrics provided are average home prices ranging from around $250,000 to $320,000, median prices being generally lower, average price per square foot between $100-130, and average days on market of 75-100 days depending on the month.
This document provides real estate data and statistics for The Woodlands, Texas for the period of 2009 to 2014. It includes information on listing inventory levels, homes sold, average and median sold prices, average price per square foot, average days on market, and months supply of inventory over time. Specific data is broken out by month for easy comparison over multiple years. The source of the data is the Houston Association of Realtors Multiple Listing Service for single family homes in The Woodlands area.
This document provides real estate market data and statistics for Spring, TX (zip code 77386) from February 2012 to February 2014. It includes charts showing the average and median sold home prices, average price per square foot, average days on market for homes listed as under contract, and months of inventory over time. The data indicates trends in home prices, price per square foot, time on market, and housing supply and demand in the local real estate market over the past two years.
This report summarizes home sales data for Magnolia, TX (zip code 77354) from February 2012 to February 2014. It includes charts showing the average and median sold prices and average price per square foot by month, as well as the average number of days homes spent on the market and months of inventory available each month. Overall, the data shows trends in home prices, speed of sales, and housing supply in the local real estate market over this two year period.
This document is a listing of real estate agents from the Houston Chronicle Custom Publishing Group. It contains over 100 names of real estate agents without any additional details about them or properties they are listing. The purpose seems to be to provide contact information for these agents, as it directs readers to a website for more listing information.
This real estate report summarizes home sales data for Magnolia, TX (zip code 77354) from January 2012 to January 2014. It provides monthly breakdowns of average and median home sale prices, average price per square foot, average number of days homes spent on the market, and months of inventory (supply and demand). Overall, the data shows some fluctuations in these key metrics from month to month but generally stable or slightly increasing home values and times on market over the two-year period.
This real estate report summarizes home sales data for the Spring, TX area (zip code 77386) from January 2012 through January 2014. It includes charts showing the average and median sold prices and average price per square foot by month, as well details on average days on market and months of inventory available. The data indicates that while prices and sales have fluctuated month-to-month, the overall market has strengthened in the past year with prices and sales generally increasing and inventory levels decreasing.
More from Better Homes and Gardens Real Estate Gary Greene (20)
Dholera Smart City Latest Development Status 2024.pdfShivgan Infratech
Explore the latest development status of Dholera Smart City in 2024. Discover the progress, infrastructure, and future plans of India's first greenfield smart city.
AVRUPA KONUTLARI ESENTEPE - ENGLISH - Listing TurkeyListing Turkey
Looking for a new home in Istanbul? Look no further than Avrupa Konutlari Esentepe! Our beautifully designed homes provide the perfect blend of luxury and comfort, making them the perfect choice for anyone looking for a high-quality home in the city.
With a wide range of apartment types available, from 1+1 to 4+1, we have something to suit every need and budget. Each apartment is designed with attention to detail and features spacious and bright living areas, making them the perfect place to relax and unwind after a long day.
One of the things that sets Avrupa Konutlari Esentepe apart from other developments is our focus on creating a community that is both comfortable and convenient. Our homes are surrounded by lush green spaces, perfect for enjoying a peaceful stroll or having a picnic with friends and family. Additionally, our complex includes a variety of social and recreational amenities, such as swimming pools, sports fields, and playgrounds, making it easy for residents to stay active and socialize with their neighbors.
https://listingturkey.com/property/avrupa-konutlari-esentepe/
Serviced Apartment Ho Chi Minh For RentalGVRenting
GVRenting is the leading rental real estate company in Vietnam. We help you to find a serviced apartment for rent in Ho Chi Minh & Saigon. Discover our broad range of rental properties in Vietnam.
For more details https://gvrenting.com/
The SVN® organization shares a portion of their new weekly listings via their SVN Live® Weekly Property Broadcast. Visit https://svn.com/svn-live/ if you would like to attend our weekly call, which we open up to the brokerage community.
Stark Builders: Where Quality Meets Craftsmanship!shuilykhatunnil
At Stark Builders our vision is to redefine the renovation experience by combining both stunning design and high quality construction skills. We believe that by delivering both these key aspects together we are able to achieve incredible results for our clients and ensure every project reflects their vision and enhances their lifestyle.
Although we are not all related by blood we have created a team of highly professional and hardworking individuals who share the common goal of delivering beautiful and functional renovated spaces. Our tight nit team are able to work together in a way where we pour our passion into each and every project as we have a love for what we do. Building is our life.
BEST FARMLAND FOR SALE | FARM PLOTS NEAR BANGALORE | KANAKAPURA | CHICKKABALP...knox groups real estate
welcome to knox groups real estate company in Bangalore. best farm land for sale near Bangalore and madhugiri . Managed farmland near Kanakapura and Chickkabalapur get know more details about the projects .Knox groups is a leading real estate company dedicated to helping individuals and businesses navigate the dynamic real estate market. With our extensive knowledge, experience, and commitment to excellence, we deliver exceptional results for our clients. Discover the perfect foundation for your agricultural aspirations with KNOX Groups' prime farm lands. These aren't just plots; they're the fertile grounds where vibrant crops flourish, livestock thrives, and unique agricultural ventures come to life. At KNOX, we go beyond selling land we curate sustainable ecosystems, ensuring that your journey toward agricultural success is seamless and prosperous.
Recent Trends Fueling The Surge in Farmhouse Demand in IndiaFarmland Bazaar
Embarking on the journey to acquire a farmhouse for sale is just the beginning; the real investment lies in crafting an environment that contributes to our mental and physical well-being while satisfying the soul. At Farmlandbazaar.com, India’s leading online marketplace dedicated to farm land, farmhouses, and agricultural lands, we understand the importance of transforming a humble farmland into a warm and inviting sanctuary. Let's explore the fundamental aspects that can elevate your farmhouse into a tranquil haven.
2. The Woodlands Texas Real Estate Report
Properties Placed Under Contract - Month to Month / 2008 to 2012
400
325 303
275
250
196
175
139
Jan Feb Mar Apr May Jun Jul Aug Sep Oct Nov Dec
2012 2011 2010 2009 2008
Jan Feb Mar Apr May Jun Jul Aug Sep Oct Nov Dec
2012 139 196 275 303
2011 161 145 236 232 265 272 245 212 182 153 122 125
2010 111 166 224 269 188 177 194 175 167 167 121 126
2009 114 158 172 207 224 224 229 173 169 156 120 109
2008 179 185 201 259 273 247 214 187 117 126 109 100
Prudential Gary Greene, Realtors - 9000 Forest Crossing, The Woodlands Texas / 281-367-3531
Data obtained from the Houston Association of Realtors Multiple Listing Service - Single Family/TheWoodlands TX
3. The Woodlands Texas Real Estate Report
Unsold Listing Inventory - Month to Month / 2008 to 2012
1300
1125
950
775
685 695 695 699
600
Jan Feb Mar Apr May Jun Jul Aug Sep Oct Nov Dec
Category Title
2012 2011 2010 2009 2008
Jan Feb Mar Apr May Jun Jul Aug Sep Oct Nov Dec
2012 685 695 695 699
2011 874 956 1001 1045 1060 990 952 951 875 854 803 746
2010 699 776 837 918 928 1001 1084 1107 1058 988 878 869
2009 762 819 831 890 931 920 973 933 863 807 783 746
2008 602 675 729 774 885 858 910 909 880 800 813 799
Prudential Gary Greene, Realtors - 9000 Forest Crossing, The Woodlands Texas / 281-367-3531
Data obtained from the Houston Association of Realtors Multiple Listing Service - Single Family/TheWoodlands TX