Download as PDF, PPTX


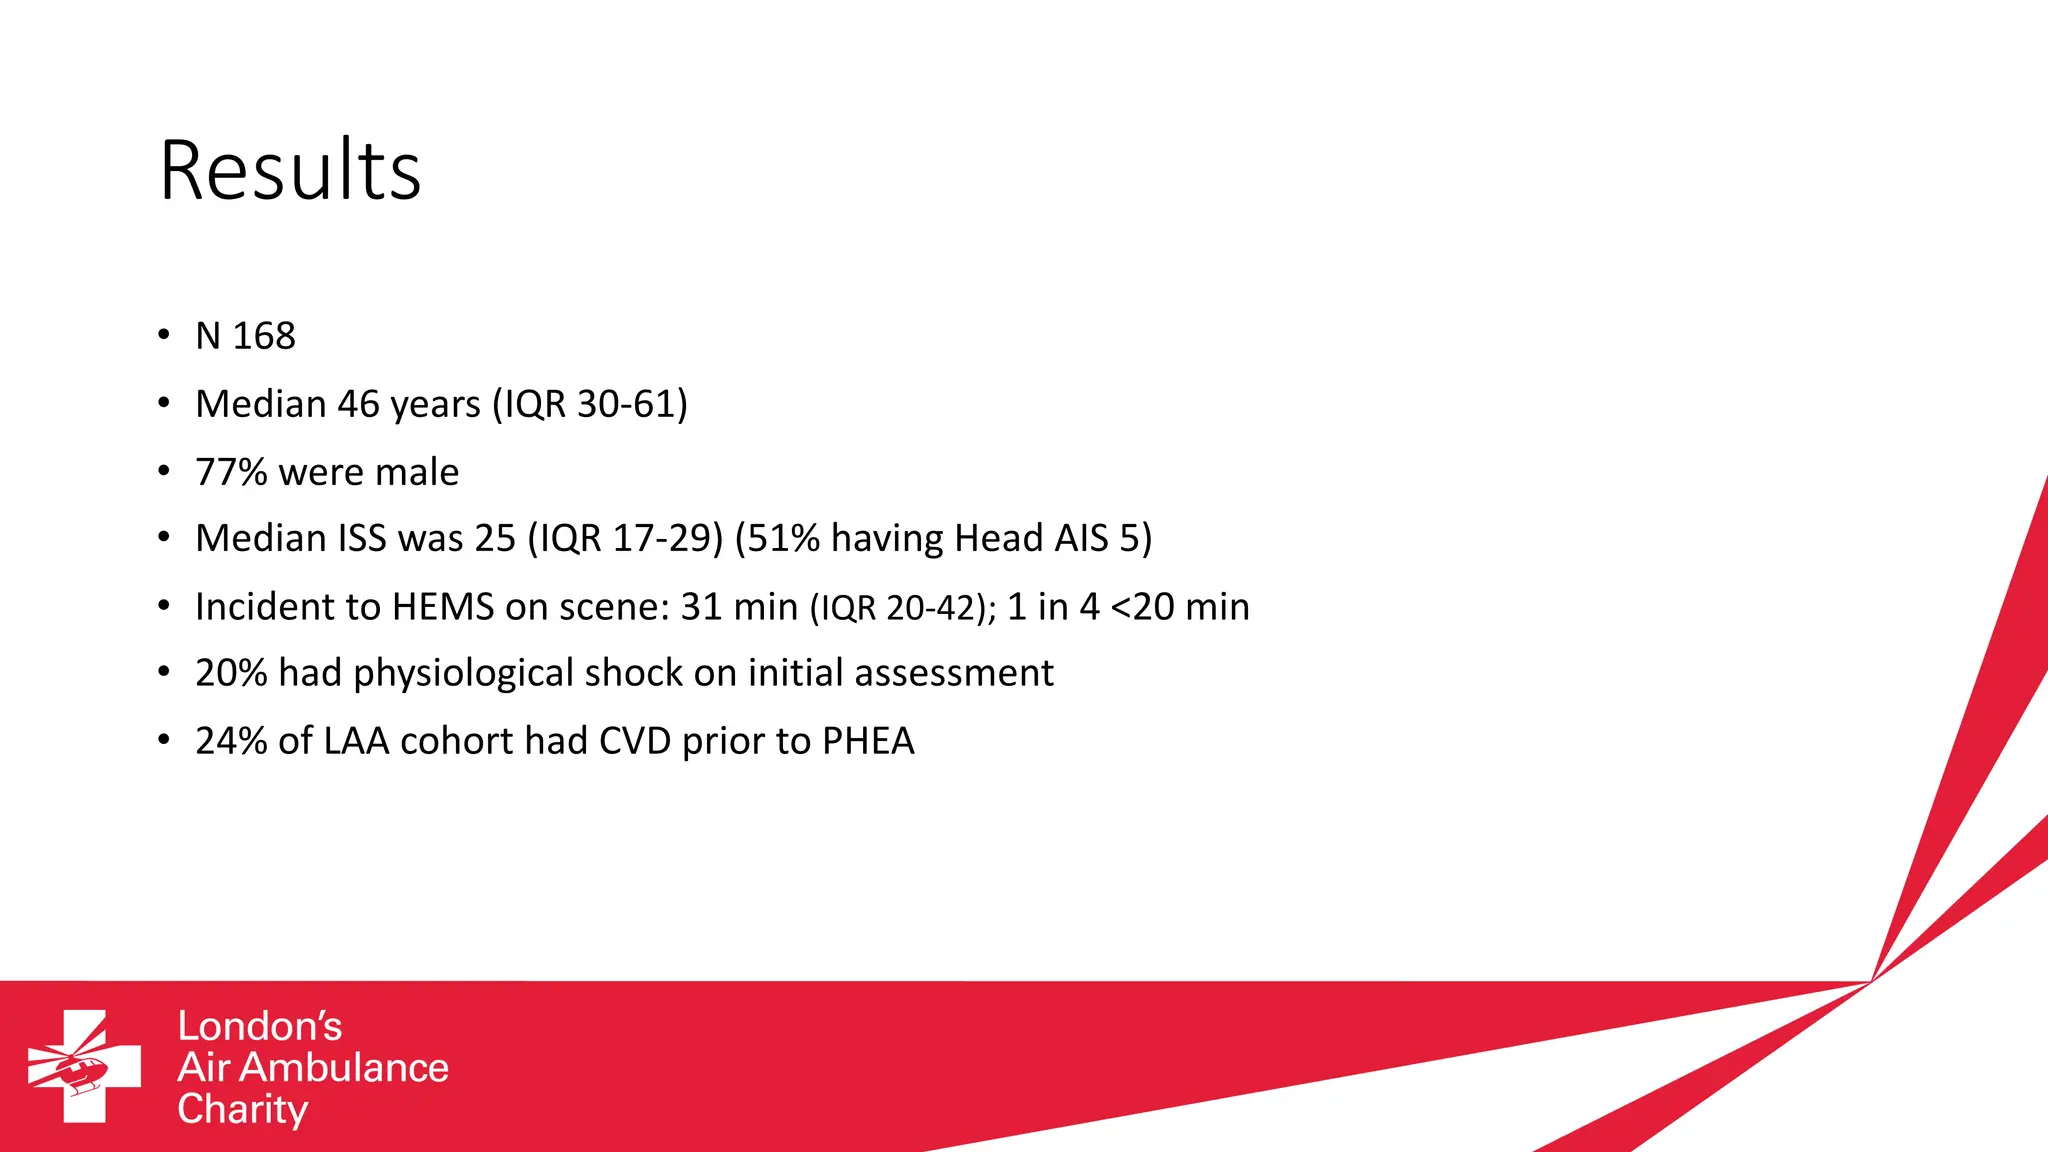

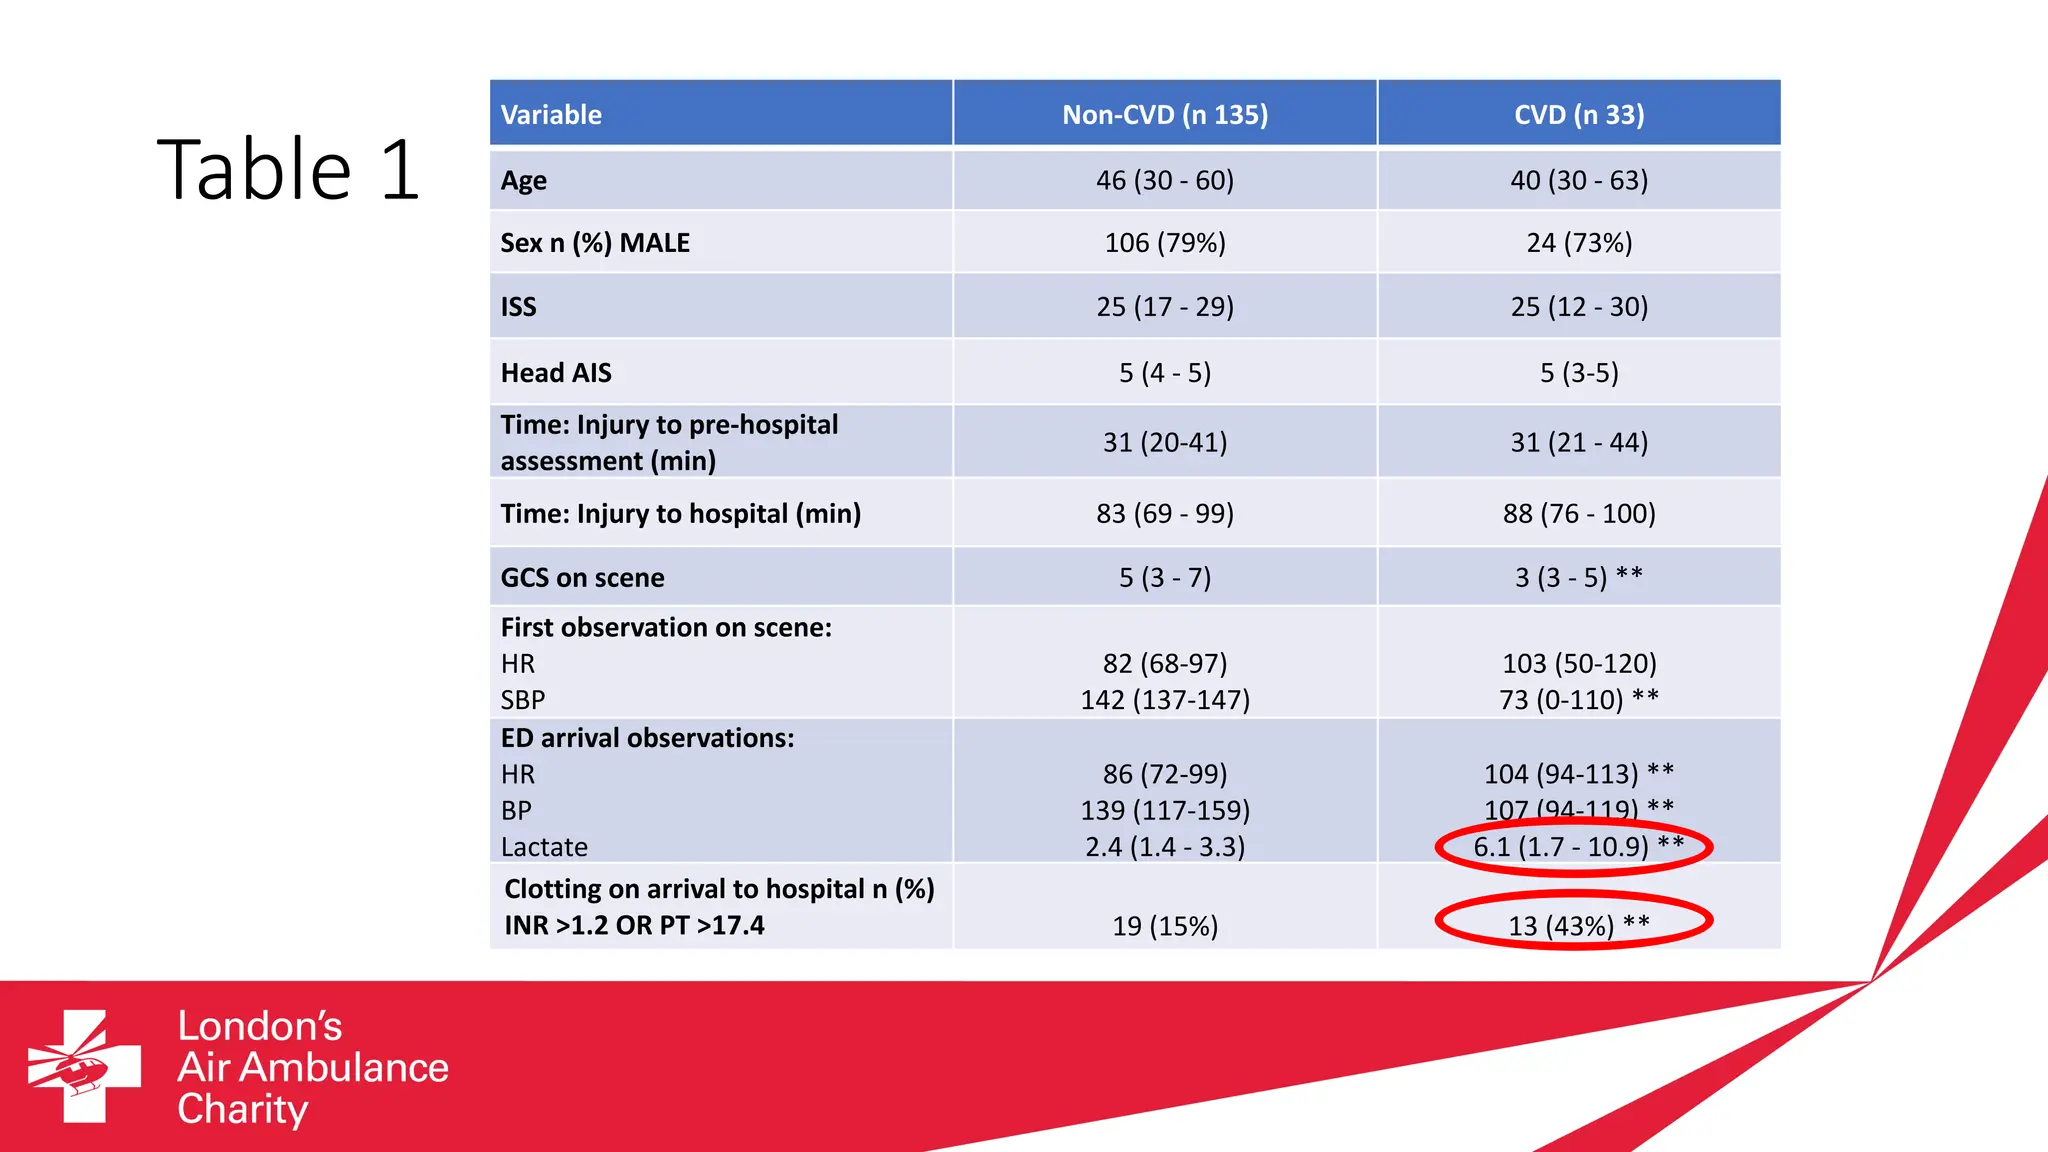

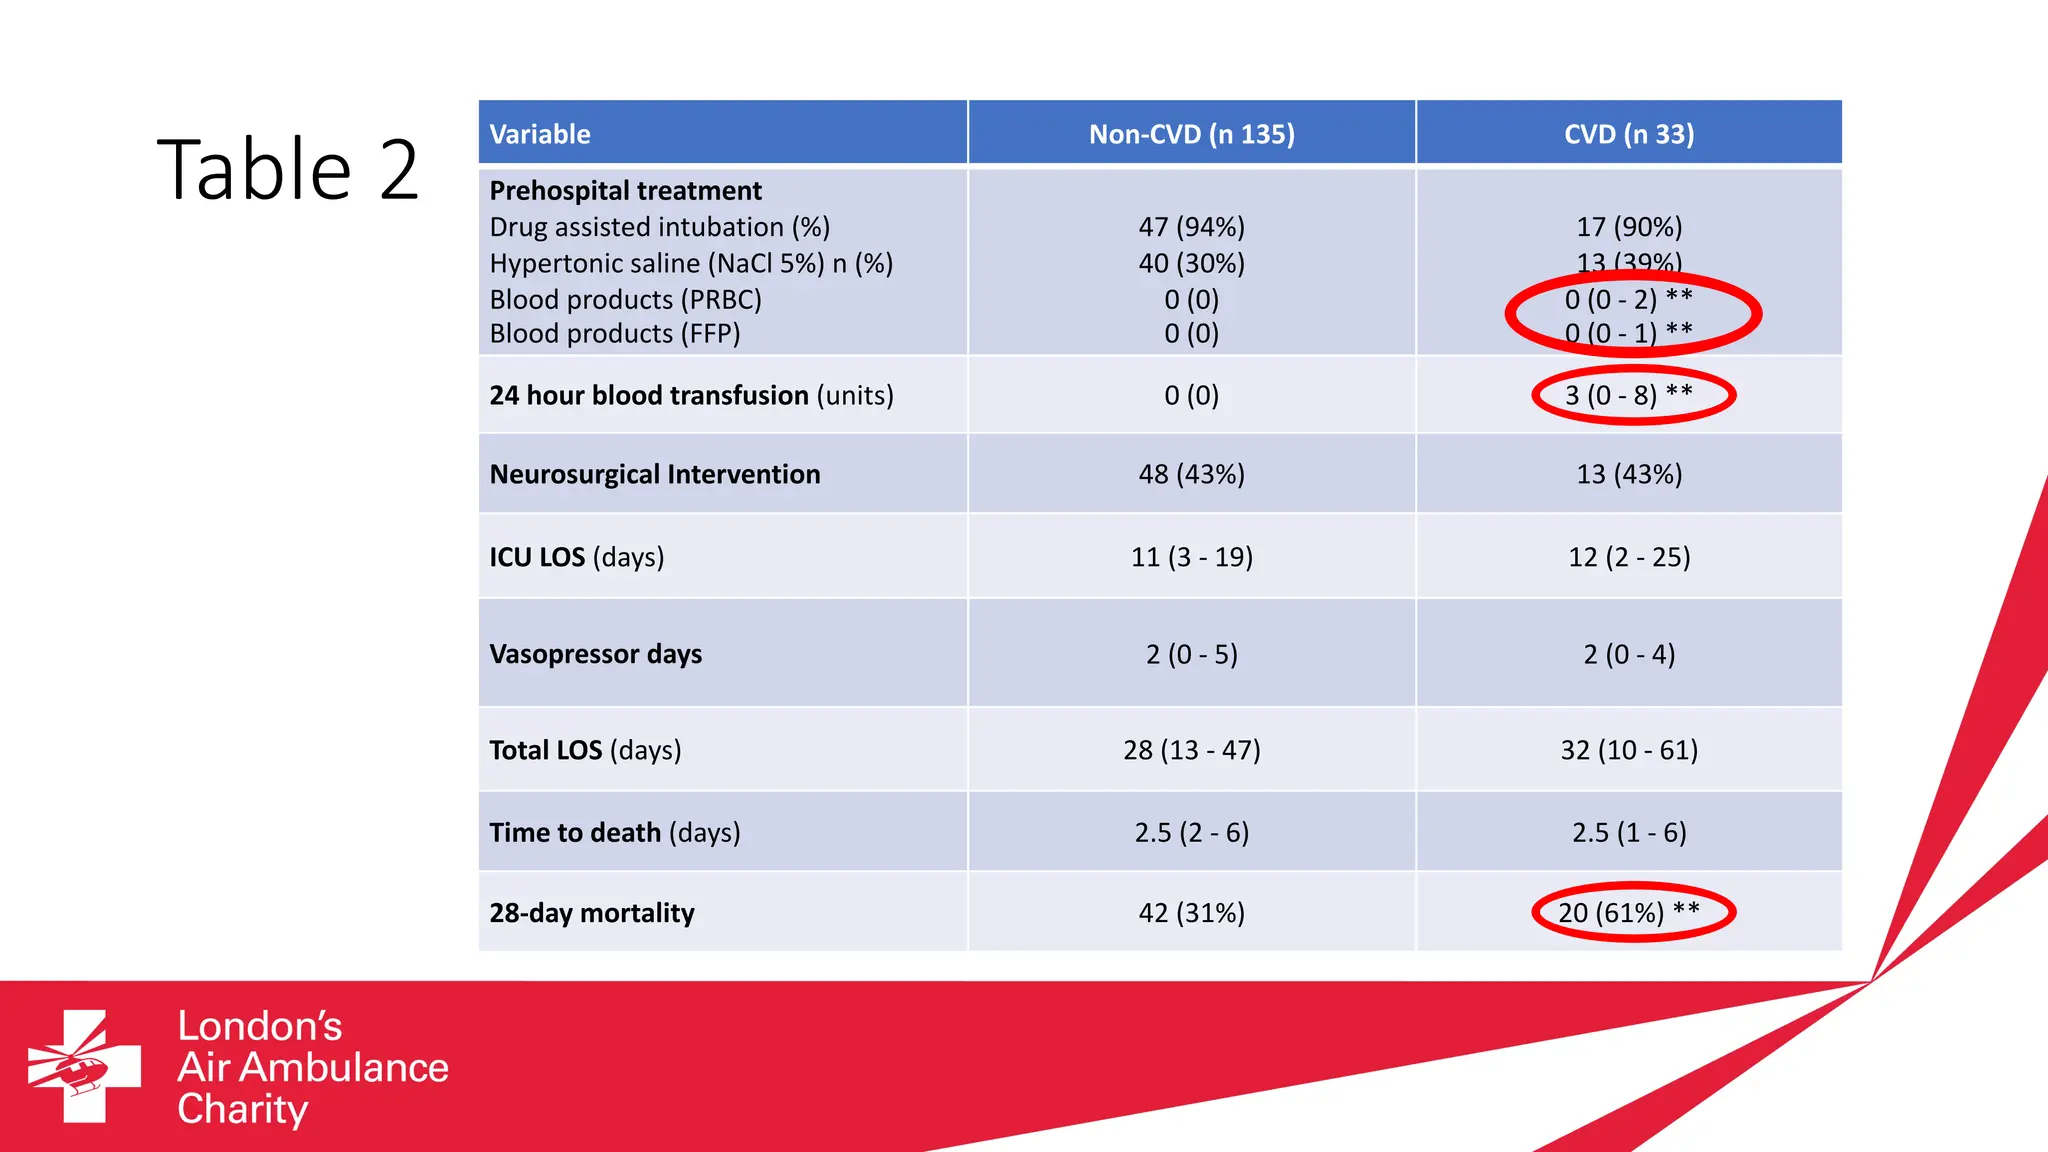
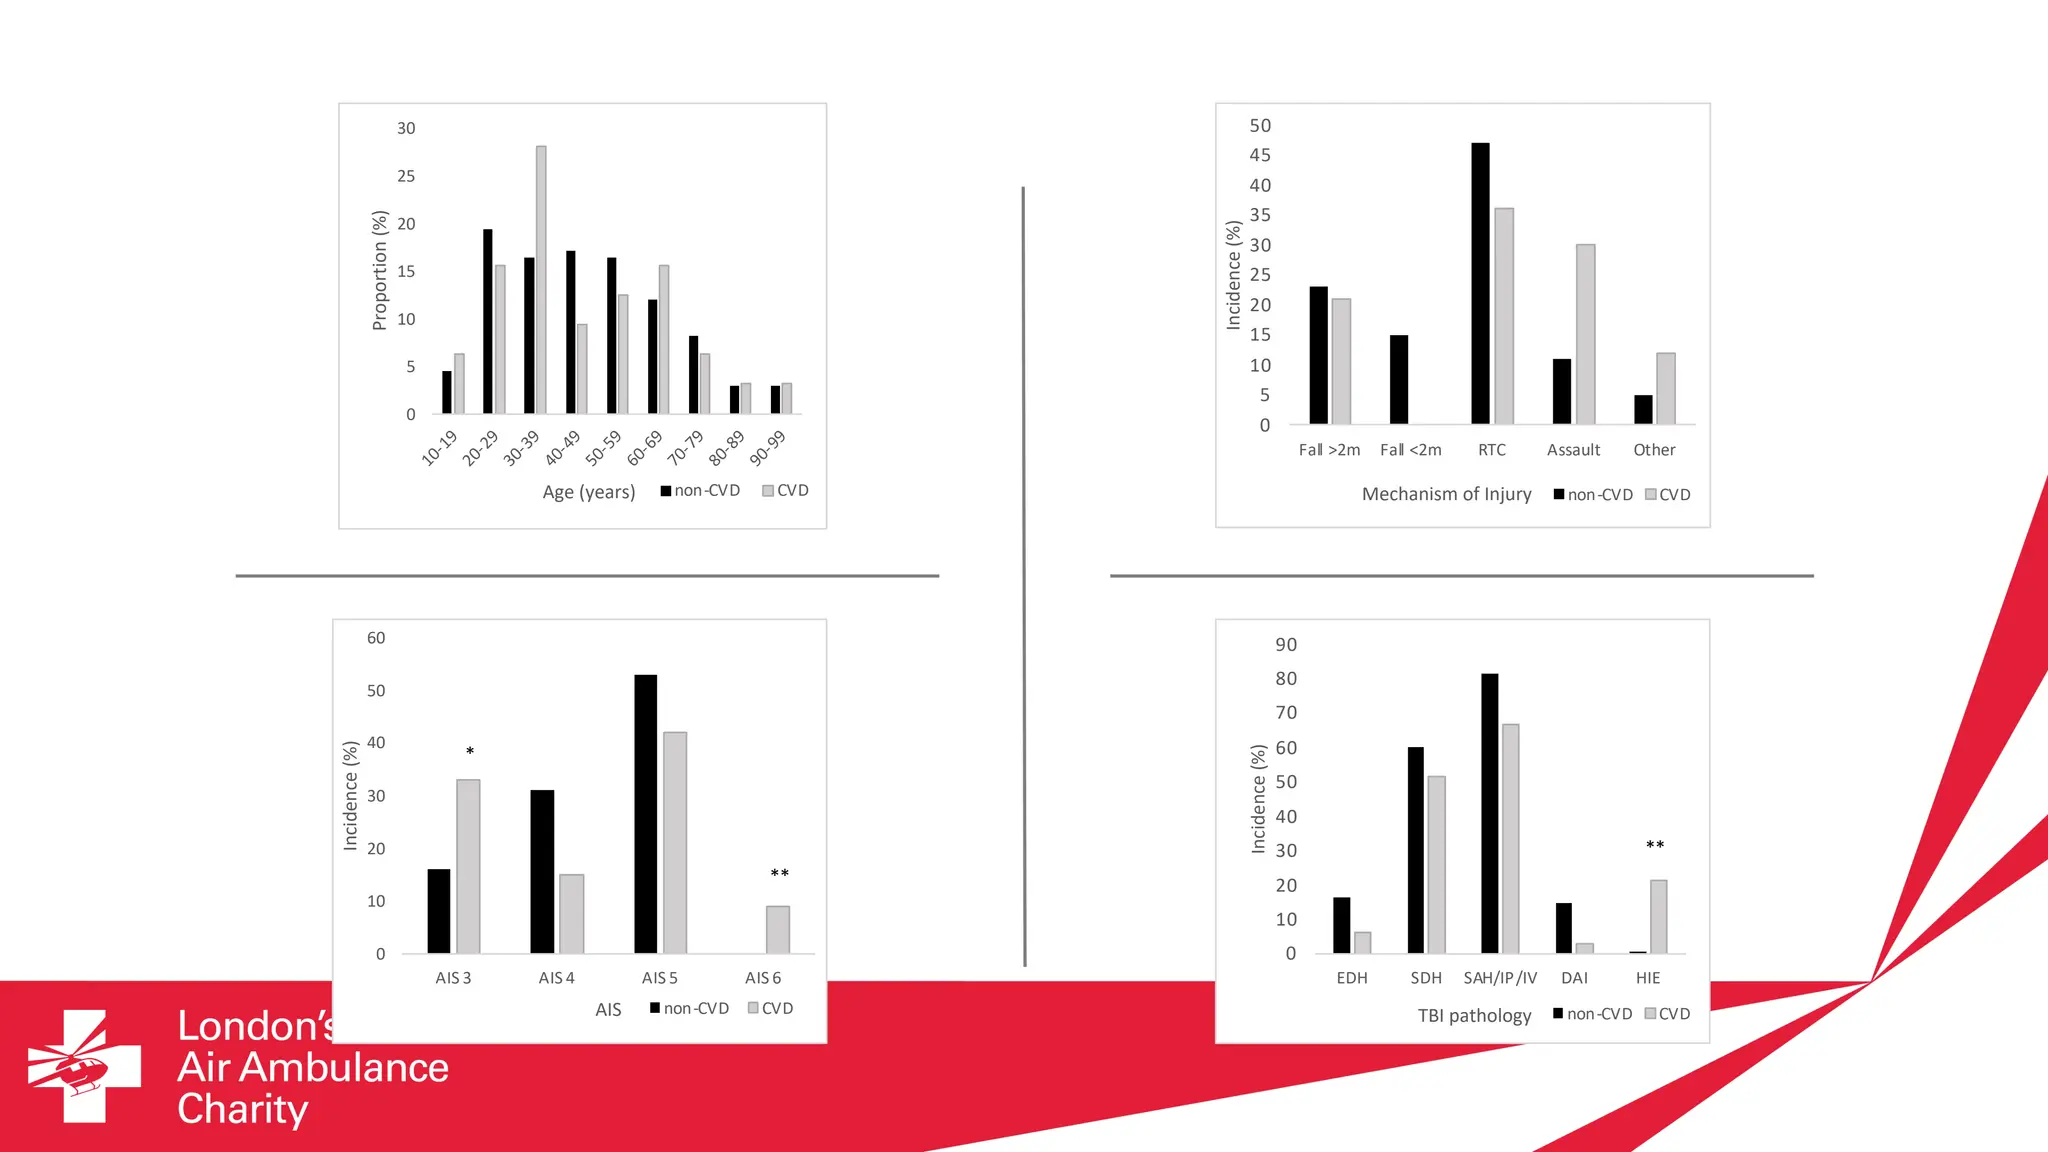


Traumatic brain injury (TBI) is a major global health problem and the leading cause of death and disability in people under 40 in many countries. Approximately 24% of patients with severe isolated TBI experience cardiovascular dysfunction prior to physician-led emergency helicopter assessment. These patients have lower GCS, higher heart rate and lactate, and worse coagulopathy compared to those without cardiovascular dysfunction. They also require more blood transfusions, have higher mortality, and are less likely to be discharged home. Further research is needed to better understand the pathophysiology of cardiovascular dysfunction following severe TBI in order to improve recognition and treatment in the critical hyperacute phase after injury.


![Red_Trauma_Management_Presentation[1].pptx](https://cdn.slidesharecdn.com/ss_thumbnails/redtraumamanagementpresentation1-250623235639-3b1285fd-thumbnail.jpg?width=640&height=640&fit=bounds)


