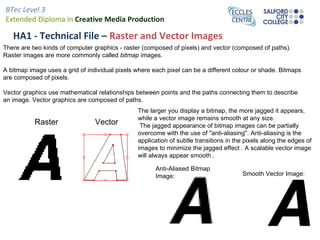
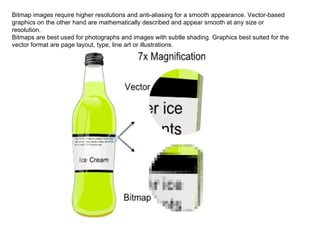
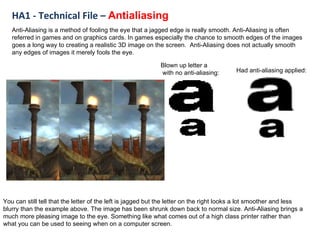
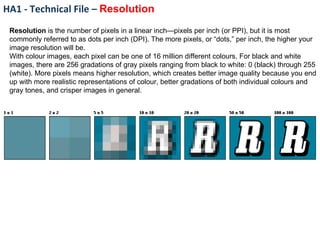
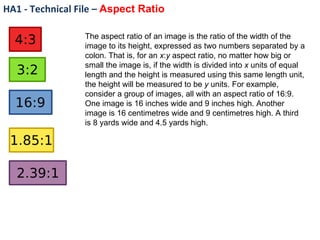
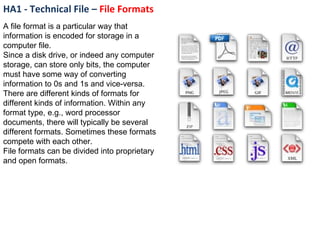
There are two main types of computer graphics - raster (bitmap) images composed of pixels and vector images composed of paths. Raster images look jagged when enlarged while vector images remain smooth at any size. Anti-aliasing can make raster images appear smoother by blending pixels along edges. Vector images are defined mathematically so they always appear smooth, while raster images require higher resolution and anti-aliasing. Different file formats encode information in different ways for storage on computers. Image editing programs like Adobe Photoshop, Illustrator, and InDesign allow creating and manipulating raster images, vector images, and other digital designs.
Key Trends Shaping the Future of Infrastructure.pdfCheryl Hung
Keynote at DIGIT West Expo, Glasgow on 29 May 2024.
Cheryl Hung, ochery.com
Sr Director, Infrastructure Ecosystem, Arm.
The key trends across hardware, cloud and open-source; exploring how these areas are likely to mature and develop over the short and long-term, and then considering how organisations can position themselves to adapt and thrive.
Builder.ai Founder Sachin Dev Duggal's Strategic Approach to Create an Innova...Ramesh Iyer
In today's fast-changing business world, Companies that adapt and embrace new ideas often need help to keep up with the competition. However, fostering a culture of innovation takes much work. It takes vision, leadership and willingness to take risks in the right proportion. Sachin Dev Duggal, co-founder of Builder.ai, has perfected the art of this balance, creating a company culture where creativity and growth are nurtured at each stage.
UiPath Test Automation using UiPath Test Suite series, part 3DianaGray10
Welcome to UiPath Test Automation using UiPath Test Suite series part 3. In this session, we will cover desktop automation along with UI automation.
Topics covered:
UI automation Introduction,
UI automation Sample
Desktop automation flow
Pradeep Chinnala, Senior Consultant Automation Developer @WonderBotz and UiPath MVP
Deepak Rai, Automation Practice Lead, Boundaryless Group and UiPath MVP
GraphRAG is All You need? LLM & Knowledge GraphGuy Korland
Guy Korland, CEO and Co-founder of FalkorDB, will review two articles on the integration of language models with knowledge graphs.
1. Unifying Large Language Models and Knowledge Graphs: A Roadmap.
https://arxiv.org/abs/2306.08302
2. Microsoft Research's GraphRAG paper and a review paper on various uses of knowledge graphs:
https://www.microsoft.com/en-us/research/blog/graphrag-unlocking-llm-discovery-on-narrative-private-data/
UiPath Test Automation using UiPath Test Suite series, part 4DianaGray10
Welcome to UiPath Test Automation using UiPath Test Suite series part 4. In this session, we will cover Test Manager overview along with SAP heatmap.
The UiPath Test Manager overview with SAP heatmap webinar offers a concise yet comprehensive exploration of the role of a Test Manager within SAP environments, coupled with the utilization of heatmaps for effective testing strategies.
Participants will gain insights into the responsibilities, challenges, and best practices associated with test management in SAP projects. Additionally, the webinar delves into the significance of heatmaps as a visual aid for identifying testing priorities, areas of risk, and resource allocation within SAP landscapes. Through this session, attendees can expect to enhance their understanding of test management principles while learning practical approaches to optimize testing processes in SAP environments using heatmap visualization techniques
What will you get from this session?
1. Insights into SAP testing best practices
2. Heatmap utilization for testing
3. Optimization of testing processes
4. Demo
Topics covered:
Execution from the test manager
Orchestrator execution result
Defect reporting
SAP heatmap example with demo
Speaker:
Deepak Rai, Automation Practice Lead, Boundaryless Group and UiPath MVP
LF Energy Webinar: Electrical Grid Modelling and Simulation Through PowSyBl -...DanBrown980551
Do you want to learn how to model and simulate an electrical network from scratch in under an hour?
Then welcome to this PowSyBl workshop, hosted by Rte, the French Transmission System Operator (TSO)!
During the webinar, you will discover the PowSyBl ecosystem as well as handle and study an electrical network through an interactive Python notebook.
PowSyBl is an open source project hosted by LF Energy, which offers a comprehensive set of features for electrical grid modelling and simulation. Among other advanced features, PowSyBl provides:
- A fully editable and extendable library for grid component modelling;
- Visualization tools to display your network;
- Grid simulation tools, such as power flows, security analyses (with or without remedial actions) and sensitivity analyses;
The framework is mostly written in Java, with a Python binding so that Python developers can access PowSyBl functionalities as well.
What you will learn during the webinar:
- For beginners: discover PowSyBl's functionalities through a quick general presentation and the notebook, without needing any expert coding skills;
- For advanced developers: master the skills to efficiently apply PowSyBl functionalities to your real-world scenarios.
JMeter webinar - integration with InfluxDB and GrafanaRTTS
Watch this recorded webinar about real-time monitoring of application performance. See how to integrate Apache JMeter, the open-source leader in performance testing, with InfluxDB, the open-source time-series database, and Grafana, the open-source analytics and visualization application.
In this webinar, we will review the benefits of leveraging InfluxDB and Grafana when executing load tests and demonstrate how these tools are used to visualize performance metrics.
Length: 30 minutes
Session Overview
-------------------------------------------
During this webinar, we will cover the following topics while demonstrating the integrations of JMeter, InfluxDB and Grafana:
- What out-of-the-box solutions are available for real-time monitoring JMeter tests?
- What are the benefits of integrating InfluxDB and Grafana into the load testing stack?
- Which features are provided by Grafana?
- Demonstration of InfluxDB and Grafana using a practice web application
To view the webinar recording, go to:
https://www.rttsweb.com/jmeter-integration-webinar
The Art of the Pitch: WordPress Relationships and SalesLaura Byrne
Clients don’t know what they don’t know. What web solutions are right for them? How does WordPress come into the picture? How do you make sure you understand scope and timeline? What do you do if sometime changes?
All these questions and more will be explored as we talk about matching clients’ needs with what your agency offers without pulling teeth or pulling your hair out. Practical tips, and strategies for successful relationship building that leads to closing the deal.
Encryption in Microsoft 365 - ExpertsLive Netherlands 2024Albert Hoitingh
In this session I delve into the encryption technology used in Microsoft 365 and Microsoft Purview. Including the concepts of Customer Key and Double Key Encryption.
Epistemic Interaction - tuning interfaces to provide information for AI supportAlan Dix
Paper presented at SYNERGY workshop at AVI 2024, Genoa, Italy. 3rd June 2024
https://alandix.com/academic/papers/synergy2024-epistemic/
As machine learning integrates deeper into human-computer interactions, the concept of epistemic interaction emerges, aiming to refine these interactions to enhance system adaptability. This approach encourages minor, intentional adjustments in user behaviour to enrich the data available for system learning. This paper introduces epistemic interaction within the context of human-system communication, illustrating how deliberate interaction design can improve system understanding and adaptation. Through concrete examples, we demonstrate the potential of epistemic interaction to significantly advance human-computer interaction by leveraging intuitive human communication strategies to inform system design and functionality, offering a novel pathway for enriching user-system engagements.
2. HA1 - Technical File – Raster and Vector Images There are two kinds of computer graphics - raster (composed of pixels) and vector (composed of paths). Raster images are more commonly called bitmap images. A bitmap image uses a grid of individual pixels where each pixel can be a different colour or shade. Bitmaps are composed of pixels. Vector graphics use mathematical relationships between points and the paths connecting them to describe an image. Vector graphics are composed of paths. Raster Vector The larger you display a bitmap, the more jagged it appears, while a vector image remains smooth at any size. The jagged appearance of bitmap images can be partially overcome with the use of "anti-aliasing". Anti-aliasing is the application of subtle transitions in the pixels along the edges of images to minimize the jagged effect . A scalable vector image will always appear smooth . Anti-Aliased Bitmap Image: Smooth Vector Image:
3. Bitmap images require higher resolutions and anti-aliasing for a smooth appearance. Vector-based graphics on the other hand are mathematically described and appear smooth at any size or resolution. Bitmaps are best used for photographs and images with subtle shading. Graphics best suited for the vector format are page layout, type, line art or illustrations.
4. HA1 - Technical File – Antialiasing Anti-Aliasing is a method of fooling the eye that a jagged edge is really smooth. Anti-Aliasing is often referred in games and on graphics cards. In games especially the chance to smooth edges of the images goes a long way to creating a realistic 3D image on the screen. Anti-Aliasing does not actually smooth any edges of images it merely fools the eye. Blown up letter a with no anti-aliasing: Had anti-aliasing applied: You can still tell that the letter of the left is jagged but the letter on the right looks a lot smoother and less blurry than the example above. The image has been shrunk down back to normal size. Anti-Aliasing brings a much more pleasing image to the eye. Something like what comes out of a high class printer rather than what you can be used to seeing when on a computer screen.
5. HA1 - Technical File – Resolution Resolution is the number of pixels in a linear inch—pixels per inch (or PPI), but it is most commonly referred to as dots per inch (DPI). The more pixels, or “dots,” per inch, the higher your image resolution will be. With colour images, each pixel can be one of 16 million different colours. For black and white images, there are 256 gradations of gray pixels ranging from black to white: 0 (black) through 255 (white). More pixels means higher resolution, which creates better image quality because you end up with more realistic representations of colour, better gradations of both individual colours and gray tones, and crisper images in general.
6. HA1 - Technical File – Aspect Ratio The aspect ratio of an image is the ratio of the width of the image to its height, expressed as two numbers separated by a colon. That is, for an x : y aspect ratio, no matter how big or small the image is, if the width is divided into x units of equal length and the height is measured using this same length unit, the height will be measured to be y units. For example, consider a group of images, all with an aspect ratio of 16:9. One image is 16 inches wide and 9 inches high. Another image is 16 centimetres wide and 9 centimetres high. A third is 8 yards wide and 4.5 yards high.
7. HA1 - Technical File – File Formats A file format is a particular way that information is encoded for storage in a computer file. Since a disk drive, or indeed any computer storage, can store only bits, the computer must have some way of converting information to 0s and 1s and vice-versa. There are different kinds of formats for different kinds of information. Within any format type, e.g., word processor documents, there will typically be several different formats. Sometimes these formats compete with each other. File formats can be divided into proprietary and open formats.
8. HA1 - Technical File – Colour Models A colour model is an abstract mathematical model describing the way colours can be represented as tuples of numbers, typically as three or four values or colour components. When this model is associated with a precise description of how the components are to be interpreted (viewing conditions, etc.), the resulting set of colours is called colour space. This section describes ways in which human colour vision can be modelled.
9. HA1 - Technical File – Adobe Photoshop Adobe Photoshop is a graphics editing program developed and published by Adobe Systems Incorporated. Adobe's 2003 "Creative Suite" rebranding led to Adobe Photoshop 8's renaming to Adobe Photoshop CS. Thus, Adobe Photoshop CS5 is the 12th major release of Adobe Photoshop. The CS rebranding also resulted in Adobe offering numerous software packages containing multiple Adobe programs for a reduced price. Adobe Photoshop is released in two editions: Adobe Photoshop, and Adobe Photoshop Extended, with the Extended having extra 3D image creation, motion graphics editing, and advanced image analysis features. Adobe Photoshop Extended is included in all of Adobe's Creative Suite offerings except Design Standard, which includes the Adobe Photoshop edition. Alongside Photoshop and Photoshop Extended, Adobe also publishes Photoshop Elements and Photoshop Light room, collectively called "The Adobe Photoshop Family". In 2008, Adobe released Adobe Photoshop Express, a free web-based image editing tool to edit photos directly on blogs and social networking sites; in 2011 a version was released for the Android operating system and the iphone.
10. HA1 - Technical File – Adobe Illustrator Sophisticated vector drawing tools Create distinctive designs with precise shape-building tools, fluid and painterly brushes, and advanced path controls. Beautiful Strokes Fully control variable-width strokes, arrowheads, dashes, and art brush scaling along a path. Perspective drawing Use perspective grids to draw shapes and scenes in accurate 1-, 2-, or 3-point linear perspective, creating the look of realistic depth and distance. Bristle Brush Paint with vectors that resemble real-world brush strokes. Achieve the expressiveness of natural media with the scalability of vector graphics. 3D effects Turn 2D shapes into fully editable 3D objects by extruding and revolving paths. Add lighting and wrap images around 3D shapes to easily create objects such as packaging mock-ups, and separate spot colours applied to 3D artwork. Clipping masks Use clipping masks to hide areas of an object or group, crop placed images, or cut intricate shapes. Quickly find the clipping mask options in the Control panel and work with masks more easily, thanks to new viewing choices for both masks and masked objects.
12. HA1 - Technical File – Adobe InDesign Adobe In Design is a software application produced by Adobe Systems. It can be used to create works such as posters, flyers, brochures, magazines, newspapers and books. In conjunction with Adobe Digital Publishing Suite In Design can publish content suitable for tablet devices. Graphic designers and production artists are the principal users, creating and laying out periodical publications, posters, and print media. It also supports export to EPUB and SWF formats to create digital publications, and content suitable for consumption on tablet computer devices. The Adobe In Copy word processor uses the same formatting engine as In Design.