Learning Objective: Increase professional effectiveness, data management, and analytical skills
With evolving technology, many people are overloaded and overwhelmed with information and data. Businesses now have access to large amounts of feedback from internal and external sources. How do we make sense of the all of the information? Is the data reliable? How can we manage and utilize the data in order to impact business goals, visions, mission? This seminar with help you turn your information overload into powerful and reliable data that you can use to meet organizational goals.
At the end of this seminar, participants will be able to:
a. Assess and categorize data and information.
b. Identify tools and techniques to organize and interpret data.
c. Explore productivity tools and techniques.
d. Examine common data management challenges and solutions.
The floods that devastated the hard disk industry in Thailand are now half a year old, and the prices per terabyte are finally dropping once again. That means data will start piling up and people around the office will wonder what can be done with it. Perhaps there are some insights in those log files? Perhaps a bit of statistical analysis will find some nuggets of gold buried in all of that noise? Maybe we can find enough change buried in the couch cushions of these files to give us all a raise?
Taming Big Data in the Reverse Logistics Supply ChainJonathan Pine
Best-in-Class companies capture, analyze and share repair and return data. But, not knowing what to look for and how to use the information could leave you drowning in Big Data.
Major points of this presentation include:
What type of data is valuable
Identifying and prioritizing trends
Benefits of analyzing and sharing data
Kennisalliantie Nieuwjaarsreceptie 31 januari 2013:
Prof. dr. Jacob de Vlieg: “Taming the Big Data Beast Together”
CEO en wetenschappelijk directeur van het Netherlands eScience Center (NLeSC)
Big Data kennen sehr viele IT-Experten, wenigstens haben Sie eine Vorstellung davon. In der Praxis arbeiten damit in Deutschland derzeit nur wenige. Dabei bringt Big Data ein ganz neues Momentum in moderne Softwarelösungen und ist im Kontext der Mobil-, Cloud- und Social-Veränderungen nicht wegzudenken. Big Data macht Software intelligent und damit auf eine ganz neue Art für die Benutzer erlebbar. Mit Big Data entstehen neue Softwarearchitekturen, weil Informationen völlig anders verarbeitet werden - nämlich schneller, differenzierter und oft mit dem Ziel, Schlüsse zu ziehen und Vorhersagen zu treffen.
In diesem Vortrag wird erläutert, wie moderne Softwarearchitekturen gestaltet werden, sodass Sie Big Data Paradigmen erfolgreich umsetzen und welche Vorteile sich für die zunehmend mobilen Softwarelösungen ergeben. Wir werfen zudem einen Blick auf die Potentiale und Optionen in Branchen wie Banken, Versicherung oder Handel.
My talk at the Winter School on Big Data in Tarragona, Spain.
Abstract: We have made much progress over the past decade toward harnessing the collective power of IT resources distributed across the globe. In high-energy physics, astronomy, and climate, thousands work daily within virtual computing systems with global scope. But we now face a far greater challenge: Exploding data volumes and powerful simulation tools mean that many more--ultimately most?--researchers will soon require capabilities not so different from those used by such big-science teams. How are we to meet these needs? Must every lab be filled with computers and every researcher become an IT specialist? Perhaps the solution is rather to move research IT out of the lab entirely: to leverage the “cloud” (whether private or public) to achieve economies of scale and reduce cognitive load. I explore the past, current, and potential future of large-scale outsourcing and automation for science, and suggest opportunities and challenges for today’s researchers.
Taming Social Data: How Social Data Framing liberates analysis and accelerate...DataSift
As potent as direct access to social data can be, the power multiplies many times over when social data is combined with your business data. When these data sets come together, insights pop out like fireworks. And the relevance of the social noise to your business becomes clear as day.
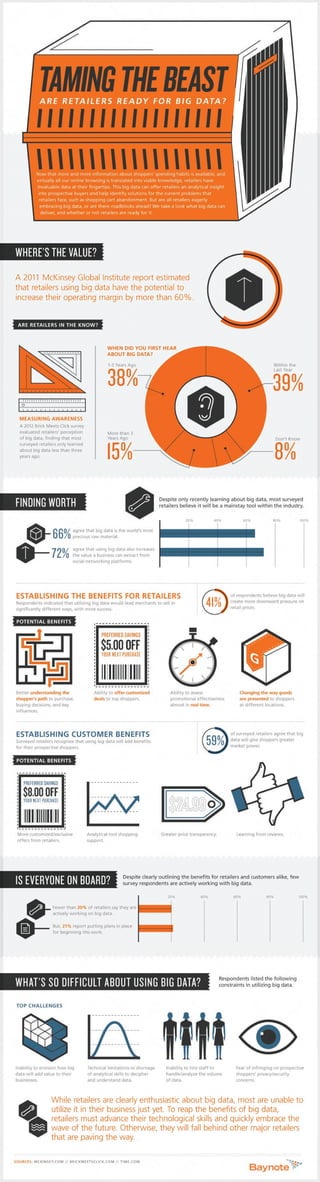
n our 4th Annual Holiday survey conducted with Lauren Freedman of the eTailing group, we surveyed 1,000 shoppers right after Cyber Monday in early December, 2013. With four years of holiday shopper surveys, we are really starting to see some interesting trends emerge.
In the United States, eCommerce is growing at 4x the growth of retail, while in China it grew a staggering 51% in 2013. Global leaders are well funded, well organized and driving massive changes in retail. http://www.baynote.com/infographic/infographics-world-according-to-ecommerce/
Taming Social Data: How Social Data Framing liberates analysis and accelerate...DataSift
As potent as direct access to social data can be, the power multiplies many times over when social data is combined with your business data. When these data sets come together, insights pop out like fireworks. And the relevance of the social noise to your business becomes clear as day.
n our 4th Annual Holiday survey conducted with Lauren Freedman of the eTailing group, we surveyed 1,000 shoppers right after Cyber Monday in early December, 2013. With four years of holiday shopper surveys, we are really starting to see some interesting trends emerge.
In the United States, eCommerce is growing at 4x the growth of retail, while in China it grew a staggering 51% in 2013. Global leaders are well funded, well organized and driving massive changes in retail. http://www.baynote.com/infographic/infographics-world-according-to-ecommerce/
Mobile commerce continues to grow for retailers and is fast becoming one of the most viable channels for promotional marketers. http://www.baynote.com/infographic/mcommerce-takes-off/
Transcript: Selling digital books in 2024: Insights from industry leaders - T...BookNet Canada
The publishing industry has been selling digital audiobooks and ebooks for over a decade and has found its groove. What’s changed? What has stayed the same? Where do we go from here? Join a group of leading sales peers from across the industry for a conversation about the lessons learned since the popularization of digital books, best practices, digital book supply chain management, and more.
Link to video recording: https://bnctechforum.ca/sessions/selling-digital-books-in-2024-insights-from-industry-leaders/
Presented by BookNet Canada on May 28, 2024, with support from the Department of Canadian Heritage.
Essentials of Automations: Optimizing FME Workflows with ParametersSafe Software
Are you looking to streamline your workflows and boost your projects’ efficiency? Do you find yourself searching for ways to add flexibility and control over your FME workflows? If so, you’re in the right place.
Join us for an insightful dive into the world of FME parameters, a critical element in optimizing workflow efficiency. This webinar marks the beginning of our three-part “Essentials of Automation” series. This first webinar is designed to equip you with the knowledge and skills to utilize parameters effectively: enhancing the flexibility, maintainability, and user control of your FME projects.
Here’s what you’ll gain:
- Essentials of FME Parameters: Understand the pivotal role of parameters, including Reader/Writer, Transformer, User, and FME Flow categories. Discover how they are the key to unlocking automation and optimization within your workflows.
- Practical Applications in FME Form: Delve into key user parameter types including choice, connections, and file URLs. Allow users to control how a workflow runs, making your workflows more reusable. Learn to import values and deliver the best user experience for your workflows while enhancing accuracy.
- Optimization Strategies in FME Flow: Explore the creation and strategic deployment of parameters in FME Flow, including the use of deployment and geometry parameters, to maximize workflow efficiency.
- Pro Tips for Success: Gain insights on parameterizing connections and leveraging new features like Conditional Visibility for clarity and simplicity.
We’ll wrap up with a glimpse into future webinars, followed by a Q&A session to address your specific questions surrounding this topic.
Don’t miss this opportunity to elevate your FME expertise and drive your projects to new heights of efficiency.
JMeter webinar - integration with InfluxDB and GrafanaRTTS
Watch this recorded webinar about real-time monitoring of application performance. See how to integrate Apache JMeter, the open-source leader in performance testing, with InfluxDB, the open-source time-series database, and Grafana, the open-source analytics and visualization application.
In this webinar, we will review the benefits of leveraging InfluxDB and Grafana when executing load tests and demonstrate how these tools are used to visualize performance metrics.
Length: 30 minutes
Session Overview
-------------------------------------------
During this webinar, we will cover the following topics while demonstrating the integrations of JMeter, InfluxDB and Grafana:
- What out-of-the-box solutions are available for real-time monitoring JMeter tests?
- What are the benefits of integrating InfluxDB and Grafana into the load testing stack?
- Which features are provided by Grafana?
- Demonstration of InfluxDB and Grafana using a practice web application
To view the webinar recording, go to:
https://www.rttsweb.com/jmeter-integration-webinar
"Impact of front-end architecture on development cost", Viktor TurskyiFwdays
I have heard many times that architecture is not important for the front-end. Also, many times I have seen how developers implement features on the front-end just following the standard rules for a framework and think that this is enough to successfully launch the project, and then the project fails. How to prevent this and what approach to choose? I have launched dozens of complex projects and during the talk we will analyze which approaches have worked for me and which have not.
Accelerate your Kubernetes clusters with Varnish CachingThijs Feryn
A presentation about the usage and availability of Varnish on Kubernetes. This talk explores the capabilities of Varnish caching and shows how to use the Varnish Helm chart to deploy it to Kubernetes.
This presentation was delivered at K8SUG Singapore. See https://feryn.eu/presentations/accelerate-your-kubernetes-clusters-with-varnish-caching-k8sug-singapore-28-2024 for more details.
UiPath Test Automation using UiPath Test Suite series, part 4DianaGray10
Welcome to UiPath Test Automation using UiPath Test Suite series part 4. In this session, we will cover Test Manager overview along with SAP heatmap.
The UiPath Test Manager overview with SAP heatmap webinar offers a concise yet comprehensive exploration of the role of a Test Manager within SAP environments, coupled with the utilization of heatmaps for effective testing strategies.
Participants will gain insights into the responsibilities, challenges, and best practices associated with test management in SAP projects. Additionally, the webinar delves into the significance of heatmaps as a visual aid for identifying testing priorities, areas of risk, and resource allocation within SAP landscapes. Through this session, attendees can expect to enhance their understanding of test management principles while learning practical approaches to optimize testing processes in SAP environments using heatmap visualization techniques
What will you get from this session?
1. Insights into SAP testing best practices
2. Heatmap utilization for testing
3. Optimization of testing processes
4. Demo
Topics covered:
Execution from the test manager
Orchestrator execution result
Defect reporting
SAP heatmap example with demo
Speaker:
Deepak Rai, Automation Practice Lead, Boundaryless Group and UiPath MVP
LF Energy Webinar: Electrical Grid Modelling and Simulation Through PowSyBl -...DanBrown980551
Do you want to learn how to model and simulate an electrical network from scratch in under an hour?
Then welcome to this PowSyBl workshop, hosted by Rte, the French Transmission System Operator (TSO)!
During the webinar, you will discover the PowSyBl ecosystem as well as handle and study an electrical network through an interactive Python notebook.
PowSyBl is an open source project hosted by LF Energy, which offers a comprehensive set of features for electrical grid modelling and simulation. Among other advanced features, PowSyBl provides:
- A fully editable and extendable library for grid component modelling;
- Visualization tools to display your network;
- Grid simulation tools, such as power flows, security analyses (with or without remedial actions) and sensitivity analyses;
The framework is mostly written in Java, with a Python binding so that Python developers can access PowSyBl functionalities as well.
What you will learn during the webinar:
- For beginners: discover PowSyBl's functionalities through a quick general presentation and the notebook, without needing any expert coding skills;
- For advanced developers: master the skills to efficiently apply PowSyBl functionalities to your real-world scenarios.
Connector Corner: Automate dynamic content and events by pushing a buttonDianaGray10
Here is something new! In our next Connector Corner webinar, we will demonstrate how you can use a single workflow to:
Create a campaign using Mailchimp with merge tags/fields
Send an interactive Slack channel message (using buttons)
Have the message received by managers and peers along with a test email for review
But there’s more:
In a second workflow supporting the same use case, you’ll see:
Your campaign sent to target colleagues for approval
If the “Approve” button is clicked, a Jira/Zendesk ticket is created for the marketing design team
But—if the “Reject” button is pushed, colleagues will be alerted via Slack message
Join us to learn more about this new, human-in-the-loop capability, brought to you by Integration Service connectors.
And...
Speakers:
Akshay Agnihotri, Product Manager
Charlie Greenberg, Host
Search and Society: Reimagining Information Access for Radical FuturesBhaskar Mitra
The field of Information retrieval (IR) is currently undergoing a transformative shift, at least partly due to the emerging applications of generative AI to information access. In this talk, we will deliberate on the sociotechnical implications of generative AI for information access. We will argue that there is both a critical necessity and an exciting opportunity for the IR community to re-center our research agendas on societal needs while dismantling the artificial separation between the work on fairness, accountability, transparency, and ethics in IR and the rest of IR research. Instead of adopting a reactionary strategy of trying to mitigate potential social harms from emerging technologies, the community should aim to proactively set the research agenda for the kinds of systems we should build inspired by diverse explicitly stated sociotechnical imaginaries. The sociotechnical imaginaries that underpin the design and development of information access technologies needs to be explicitly articulated, and we need to develop theories of change in context of these diverse perspectives. Our guiding future imaginaries must be informed by other academic fields, such as democratic theory and critical theory, and should be co-developed with social science scholars, legal scholars, civil rights and social justice activists, and artists, among others.
GraphRAG is All You need? LLM & Knowledge GraphGuy Korland
Guy Korland, CEO and Co-founder of FalkorDB, will review two articles on the integration of language models with knowledge graphs.
1. Unifying Large Language Models and Knowledge Graphs: A Roadmap.
https://arxiv.org/abs/2306.08302
2. Microsoft Research's GraphRAG paper and a review paper on various uses of knowledge graphs:
https://www.microsoft.com/en-us/research/blog/graphrag-unlocking-llm-discovery-on-narrative-private-data/