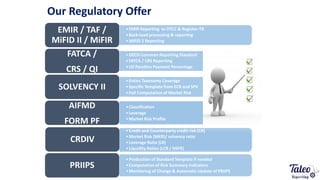
Specialized Advisory Firm in FINANCIAL SERVICES
Focus on our Expertise in Regulatory & Standard
Tripartite Reporting Services
AGENDA
1) Taleo Reporting
2) Our Regulatory Offer
3) TALEO Reporting by module
4) TALEO Reporting added-value
AGENDA
1) Taleo Reporting
2) Our Regulatory Offer
3) TALEO Reporting by module
Focus on :
4) TALEO Reporting added-value
TALEO group will allow, by its Advisory Services, to sustain TALEO Reporting
activities by its existing markets and partners
TALEO Reporting by TALEO
CustomersConsultants
Commercial Development
- Network
- Prospections
- Bid & Delivery
Technical development
- Staffing
- Permanent Task Force
Available
Our combined expertise allow us to assist our Clients on all phases linked to
current and ongoing regulations
An Association covering the entire Regulatory Chain
New Regulation
Regulation Analysis
- Gap Analysis
- « As Is » Analysis
- « To Be » Proposal
Consultants at your
disposal:
- Business Analysts
- Project Managers
- Change Managers
Operational
Implementation
- Targetted Process defined
- Communication with IT
- System Adjustments
- Testing
Consultants at your
disposal:
- Project Managers
- Change Managers
- Business Analysts
- Technical Analysts
- Developers
- Testers
Regulatory Reporting
- Data Mapping
- Control Checks
- Reportings Creation
- Taxonomy Release Management
Consultants at your
disposal:
- Risk Managers
- Report Production Coordinators
- Developers
- Quality Auditors
Phase 1 Phase 3Phase 2
Advisory Services Reporting Services
AGENDA
1) Taleo Reporting
2) Our Regulatory Offer
3) TALEO Reporting by module
Focus on :
4) TALEO Reporting added-value
Our Regulatory Offer
•EMIR Reporting to DTCC & Register-TR
•Back-load processing & reporting
•MIFID 2 Reporting
•
EMIR / TAF /
MiFID II / MiFIR
•OECD Common Reporting Standard
•FATCA / CRS Reporting
•US Passthru Payment Percentage
FATCA /
CRS / QI
•Entire Taxonomy Coverage
•Specific Template from ECB and SPV
•Full Computation of Market Risk
SOLVENCY II
•Classification
•Leverage
•Market Risk Profile
AIFMD
FORM PF
•Credit and Counterparty credit risk (CR)
•Market Risk (MKR)/ solvency ratio
•Leverage Ratio (LR)
•Liquidity Ratios (LCR / NSFR)
CRDIV
PRIIPS
•Production of Standard Template if needed
•Computation of Risk Summary Indicators
•Monitoring of Change & Automatic Update of PRIIPS
Standard Tripartite Offer
• Standard Tripartite Template for performance and
risk reporting
• Defines common principles, metrics, aggregation
of risk information and taxonomy
• Developed and maintained by the industry
OPERA
• Solvency II Tripartite Standard Template from AM /
FA to undertakings
• Validated by AFG (FR), BVI (DE) and IMA (UK)
SII for
Funds
• Liquidity Report
• Risk ReportADHOC
Different Regulations Out-of-the-Box
1.) Connect
Ebable mapping
between client’s
data & application
data model
2.) Compute
Process calculation
algorythms based on
precise regulatory
methods
3.) Analyse
Check consistency
regarding entry data
& computed results
4.) Generate
Extract filled reports
into several file
formats
Positions
Transactions
Customer
Financial
Data
AuM
Leverage
Client
Computed
Values
Market Data
Exchanges I Reuters
Regulatory
Calculation
Specifications
ESMA I EBA Adhoc Methodologies
Reports
Solva 2 I FATCA
AIFMD I CRDIV
AMPERE I OPERA
MIFID 2 I CRS
PRIIPS
XML I XBRL
PDF I XLSX
File Format
AGENDA
1) Taleo Reporting
2) Our Regulatory Offer
3) TALEO Reporting by moduleFocus on :
4) TALEO Reporting added-value
AIFMD Module
11
Production by AIF and at AIFM level of:
• Classifications,
• Risk Indicators,
• Liquidity Profiles,
• Leverages & Exposures,
• Counterparty Risks
• etc
AIFMD Dashboards Production
Spot check and variances by:
• Derivatives,
• Leverages and Exposures,
• AuM,
• Risk indicators,
• Counterparty Risks
• etc
AIFMD Dashboards Controls
12
Various analysis tools by AIF and at AIFM:
• Audit trail for commitment exposure computation
• Automatic comparison of users and computed figures
• Display of underlying used data
AIFMD Module
AIFMD Computations Analysis
-
FATCA / CRS / QI Overview
FATCA / CRS Reporting:
• TALEO Reporting is a Registered ISV at IRS
• FATCA implementation for France & Luxembourg
• Flexible Business Rules Maintenance
• Multiple Reporting : FATCA & CRS & QI
• Weekly Regulation watching
FATCA / CRS / QI Module
-
FATCA / CRS / QI Simulations
FATCA / CRS Reporting:
• Simulations based on Business Rules
• Clients Tax Reports in XLS & PDF
• Scability to meet high Volume
FATCA / CRS / QI Module
-
FATCA / CRS / QI – XML Reports in One Click
Few Steps to Comply with FATCA / CRS / QI :
1. Data Mapping
2. Data Import
3. Validation & Review of Imported Data
4. XML Production in One Click
5. XLS Production to review XML content
6. PDF Reports available to send to clients
7. Transmission to ACD
FATCA / CRS / QI Module
-
SII / Look-Through Overview
Solvency II / Look-Through Reporting:
• Solvency II Tripartite Standard Template from AM / FA to undertakings
• Validated by AFG (Fr), BVI (De) & IMA (UK)
• No Levels Limit
• Data Captured & Enriched from various
Solvency II / Look-Through Module
Position Name
Position
Quantity
PL Ccy Mid NAV Look-Through SCR Amount
SCR Amount
%
Level
%
Coverage
EUR 524,756,021.68 165,215,464.56 31.48% 100.00%
FRANCE SMALL CAP 800.00 EUR 529.91 423,928.00 Yes 134,053.23 31.62% 1 100.00%
INSTITUTIONS 7,600.00 EUR 2,551.13 19,388,588.00 Yes 534,766.64 2.76% 1 100.00%
FRANCE MID CAP 6,000.00 EUR 2,036.12 12,216,720.00 Yes 3,758,029.22 30.76% 2 100.00%
EXPORT EUROPE 16,000.00 EUR 181.65 2,906,400.00 Yes 830,195.64 28.56% 6 100.00%
489,820,385.68 160,105,606.40
-
SII / Look-Through Overview
Look-Through Process to Manage Levels :
• Automatic Insertion of All Funds
• Automatic Insertion of Held Assets per Fund
• Upload of All Inventories of Inserted Assets
• Enrichment of the Positions
• Computations & Reporting
Solvency II / Look-Through Module
Few Steps to Comply with Solvency II / Look-Through:
1. Data Mapping with Sources
2. Data Import
3. Validation & Review of Imported Data
4. Set-Up of the Look-Through Process
5. XBRL or XML Production in One Click
6. XLS Production to review XBRL or XML content
-
SII / Look-Through Illustration
Solvency II / Look-Through Module
-
SII / Look-Through Inventories & Data Enrichment
Solvency II / Look-Through Module
Find a Source of Funds’ Raw Inventories :
• In-House Source
• External Providers (MorningStar, Lipper, Telekurs,
Barclays, etc.)
Find a Source of Funds’ Raw Inventories & Enriched their
Assets :
• In-House Source or External Providers
• TALEO Reporting to Enrich the Positions
Find a Source of Funds’ Enriched Inventories :
• In-House Source
• External Providers (MorningStar, Lipper ?, Telekurs,
Barclays ?, etc.)
Option 2:
Option 1:
Option 3:
-
EMIR • Filling to TRO : Regis-TR, DTCC…
• Realized with 2 Clients
• XML Reporting
• Leveraged with existing Technology & EMIR
EMIR / TAF / MiFID II / MiFIR Module
• Filling to: Target National Authority
• Being tested with 2 Clients
• XML Reporting
• Leveraged with Existing Technology & MiFID II
TAF / MiFID II /
MiFIR
-
EMIR / TAF / MiFID II / MiFIR Module
EMIR / TAF / MiFID II / MiFIR Overview
Few Steps to Comply with EMIR / TAF / MiFID II / MiFIR :
1. Data Mapping
2. Data Import
3. Validation & Review of Imported Data
4. CSV / XML Production in One Click
5. XLS Production to review XML Content
6. Reporting Transmission to TRO or TNA…
PRIIPs Module
PRIIPs Categorisation
Category Description Methodology Parameters
Category I
a) All PRIIPs: up to 5 years; Capital Protected at 100%.
b) All PRIIPs where investors could lose more than the amount
they invested.
c) Derivatives that qualify as PRIIPs.
MRM = 1
MRM = 7
MRM = 7
N / A
Category II
AIFs ; UCITS; and similar
Unit-linked insurance products
Based on a 2,5% VaR, approximated by the Cornish
Fisher expansion, calibrated using 5 years’ historical
performance data for the PRIIPs
Histo 5 Y
Freq: W
Proxies
Category III
PRIIPS with products with at least 2 years of historical daily prices or
4 years of historical weekly prices are available.
Or a natural benchmark or proxy exists
Based on a statistical approach, using forward
simulation of the PRIIP’s performance calibrated on
historical data
Histo 5 Y
Freq: W
Proxies
Category IV PRIIPs not fall under Category II or Category III PRIIPs. Alternative N / A
Category V
Insufficient data are available so as to accurately estimate the
market risk based on the methodology implemented for Category II
or Category III PRIIPs
Alternative N / A
: Insurances
PRIIPs Module
PRIIPs : Summary Risk Indicator (SRI)
: Insurances
Category
Risk
Class
Methodo. Param.
Category I 1 - 7 Qualititative N / A
Category II 1 - 7 CF VaR 97.5
Histo 5 Y
Freq: W
Proxies
Category III 1 - 7 MC 97.5
Histo 5 Y
Freq: W
Proxies
Category IV 1 - 7 Alternative N / A
Category V 1 - 7 Alternative N / A
Market Risk Measure (MRM)
Credit
Quality
Steps
Credit
Risk
Class
0 1
1 1
2 1
3 2
4 3
5 4
6 5
MRM
1
2
3
4
5
6
7
(Obligors / Manufacturers)
Credit Risk Measure (CRM)
CRM  MRM MR1 MR2 MR3 MR4 MR5 MR6 MR7
CR1 1 2 3 4 5 6 7
CR2 1 2 3 4 5 6 7
CR3 3 3 3 4 5 6 7
CR4 5 5 5 5 5 6 7
CR5 6 6 6 6 6 6 7
Insurance in Luxembourg :
• The Triparty Agreement among the
Insurance, the CAA & the Banks
guarantees the Insurers with no
Limit. CR = 1
• However, the Credit Risk exists for
the Depository
=> Look-Through to Level 1 only ?
Summary Risk Indicator (SRI)
PRIIPs Module
PRIIPs : SRI Results
Holder Policy
Policies Profiles
• Notation Vs Profile Alerts if only
Current Risk is above Contractual Risk
• Daily Computations & Alerts
PRIIPs Module
PRIIPs : Summary Risk Indicator (SRI)
 Methodology: Compute policies volatilities:
• Get composition of each policy
 Compute funds volatilities:
• Historical NAV & dividends: 5 years
• Frequency: weekly
• If historical data is missing: use proxies
 Compute policies volatilities:
• Get composition of each policy
• Compute policies volatilities
• Allocate the volatilities to their relevant
Market Risk Classes
 Aggregation with Credit Risk and SRI
• Look-Through to the obligors
• Get their Ratings
• Convert to CQS
• Determine the SRI
 Monitoring of SRI:
• On daily basis: repeat the computation of
SRI
• Monitor the changes and produce the new
PRIIPs if the SRI changes
Credit Risk needed for :
• Manufacturers
• All Obligors when PRIIPs are
embedded
• Counterparty of Non Cleared
Derivative PRIIPs if Exposure > 10%
• Any Counterparty that should make
Payment
Exclude AIFs & UCITS
Fitch PD
1 year
5
years
Ratings CQS
0.04% 0.28% AAA Y AA 0 or 1
0.08% 0.69% A 2
0.22% 1.96% BBB 3
1.15% 8.10% BB 4
2.22% 15.37% B 5
28.07% 58.70% CCC or less 6
(Multi-Obligors: Equally weighted PD and CQS)
Solvency II Module
Solvency II Reporting : FULL STP WORKFLOW
Solvency II reporting :
• Entire Taxonomy Coverage (DPM 2.0)
• Additional Local Reports (CAA XLS)
• Full Automation of Reporting Generation &
Transmission through SOFIE
Solvency II Module
Solvency II Reporting Overview
Few Steps to Comply with Solvency II Reporting :
1. Data Mapping
2. Data Import
3. Validation & Review of Imported Data
4. XBRL Production in One Click
5. XLS Production to review XBRL Content
6. Transmission to CAA through SOFIE
Solvency II Module
Controls Features : EIOPA & BR Controls
Controls are Mandatory to
guarantee Accurate Reporting:
• Already all EIOPA
Controls are
implemented (148 B.
Rules)
• Additional BR are
being implemented and
can be extended upon
request
ID Rule Assertion InstitutionType ReportingType Frequency
CAS 1 S.02.01.03.R0500C0010=Sum(S.02.02.01.R0100C0050[CUR]) S.02.01.b.A30 = Sum(S.02.02.b.A7A[CUR]) Solo SolvencyIIReporting Annual
CAS 2 S.02.01.03.R0900C0010=Sum(S.02.02.01.R0200C0050[CUR]) S.02.01.b.L25A = Sum(S.02.02.b.A15[CUR]) Solo SolvencyIIReporting Annual
CAS 3 S.02.01.03.R0070C0010=Sum(S.02.02.01.R0020C0050[CUR]) S.02.01.b.A4 = Sum(S.02.02.b.A3[CUR]) Solo SolvencyIIReporting Annual
CAS 4 S.02.01.03.R0060C0010+S.02.01.03.R0420C0010+S.02.01.03.R0240C0010+S.02.01.03.R0250C0010+S.02.01.03.R0260C0010=Sum(S.02.02.01.R0030C0050[CUR])S.02.01.b.A3+S.02.01.b.A27 + S.02.01.b.A14A + S.02.01.b.A14B + S.02.01.b.A14BC = Sum(S.02.02.b.A4[CUR])Solo SolvencyIIReporting Annual
CAS 5 S.02.01.03.R0220C0010=Sum(S.02.02.01.R0040C0050[CUR]) S.02.01.b.A12 = Sum(S.02.02.b.A5[CUR]) Solo SolvencyIIReporting Annual
CAS 6 S.02.01.03.R0270C0010=Sum(S.02.02.01.R0050C0050[CUR]) S.02.01.b.A16 = Sum(S.02.02.b.A5A[CUR]) Solo SolvencyIIReporting Annual
CAS 7 S.02.01.03.R0360C0010+S.02.01.03.R0370C0010+S.02.01.03.R0380C0010=Sum(S.02.02.01.R0060C0050[CUR])S.02.01.b.A13+S.02.01.b.A21+S.02.01.b.A20 = Sum(S.02.02.b.A6[CUR])Solo SolvencyIIReporting Annual
CAS 8 S.02.01.03.R0030C0010+S.02.01.03.R0040C0010+S.02.01.03.R0050C0010+S.02.01.03.R0390C0010+S.02.01.03.R0430C0010+S.02.01.03.R0400C0010+S.02.01.03.R0410C0010=Sum(S.02.02.01.R0070C0050[CUR])S.02.01.b.A2+S.02.01.b.A26+S.02.01.b.A25B+S.02.01.b.A23+S.02.01.b.A29 + S.02.01.b.A28A + S.02.01.b.A28B = Sum(S.02.02.b.A7[CUR])Solo SolvencyIIReporting Annual
CAS 9 S.02.01.03.R0520C0010+S.02.01.03.R0560C0010+S.02.01.03.R0610C0010+S.02.01.03.R0650C0010=Sum(S.02.02.01.R0110C0050[CUR])S.02.01.b.L1+S.02.01.b.L4+S.02.01.b.L6B+S.02.01.b.L7 = Sum(S.02.02.b.A8[CUR])Solo SolvencyIIReporting Annual
CAS 10 S.02.01.03.R0690C0010=Sum(S.02.02.01.R0120C0050[CUR]) S.02.01.b.L10 = Sum(S.02.02.b.A9[CUR]) Solo SolvencyIIReporting Annual
CAS 11 S.02.01.03.R0770C0010+S.02.01.03.R0820C0010+S.02.01.03.R0830C0010=Sum(S.02.02.01.R0130C0050[CUR])S.02.01.b.L13+S.02.01.b.L15A+S.02.01.b.L15B = Sum(S.02.02.b.A10[CUR])Solo SolvencyIIReporting Annual
CAS 12 S.02.01.03.R0790C0010=Sum(S.02.02.01.R0140C0050[CUR]) S.02.01.b.L16 = Sum(S.02.02.b.A11[CUR]) Solo SolvencyIIReporting Annual
CAS 13 S.02.01.03.R0800C0010+S.02.01.03.R0810C0010=Sum(S.02.02.01.R0150C0050[CUR])S.02.01.b.L19+S.02.01.b.L20 = Sum(S.02.02.b.A12[CUR])Solo SolvencyIIReporting Annual
CAS 14 S.02.01.03.R0740C0010=Sum(S.02.02.01.R0160C0050[CUR]) S.02.01.b.L23 = Sum(S.02.02.b.A13[CUR]) Solo SolvencyIIReporting Annual
CAS 15 S.02.01.03.R0750C0010+S.02.01.03.R0760C0010+S.02.01.03.R0780C0010+S.02.01.03.R0840C0010+S.02.01.03.R0880C0010+S.02.01.03.R0870C0010+S.02.01.03.R0860C0010=Sum(S.02.02.01.R0170C0050[CUR])S.02.01.b.L18+S.02.01.b.L22+S.02.01.b.L17+S.02.01.b.L15C+S.02.01.b.L25+S.02.01.b.L26+S.02.01.b.L15D = Sum(S.02.02.b.A14[CUR])Solo SolvencyIIReporting Annual
CAS 16 S.02.01.03.R0290C0010=S.17.01.01.R0330C0050+S.17.01.01.R0330C0060+S.17.01.01.R0330C0070+S.17.01.01.R0330C0080+S.17.01.01.R0330C0090+S.17.01.01.R0330C0100+S.17.01.01.R0330C0110+S.17.01.01.R0330C0120+S.17.01.01.R0330C0130+S.02.01.b.A17 = S.17.01.b.D27+S.17.01.b.E27+S.17.01.b.F27+S.17.01.b.G27+S.17.01.b.H27+S.17.01.b.I27+S.17.01.b.J27+S.17.01.b.K27+S.17.01.b.L27+S.17.01.b.N27+S.17.01.b.O27+S.Solo SolvencyIIReporting Annual
CAS 17 S.02.01.03.R0300C0010=S.17.01.01.R0330C0020+S.17.01.01.R0330C0030+S.17.01.01.R0330C0040+S.17.01.01.R0330C0140S.02.01.b.A18 = S.17.01.b.A27+S.17.01.b.B27+S.17.01.b.C27+S.17.01.b.M27Solo SolvencyIIReporting Annual
CAS 18 S.02.01.03.R0320C0010=S.12.01.01.R0080C0170+S.12.01.01.R0080C0180+S.12.01.01.R0080C0190+S.12.01.01.R0080C0200S.02.01.b.A18A = Sum(S.12.01.b.C10…C13) Solo SolvencyIIReporting Annual
CAS 19 S.02.01.03.R0330C0010=S.12.01.01.R0080C0020+S.12.01.01.R0080C0070+S.12.01.01.R0080C0080+S.12.01.01.R0080C0090+S.12.01.01.R0080C0100S.02.01.b.A19 = S.12.01.b.C1+S.12.01.b.C4+S.12.01.b.C5+S.12.01.b.C6+S.12.01.b.C7Solo SolvencyIIReporting Annual
CAS 20 S.02.01.03.R0340C0010=S.12.01.01.R0080C0040+S.12.01.01.R0080C0050S.02.01.b.A19A = S.12.01.b.C2 + S.12.01.b.C3 Solo SolvencyIIReporting Annual
CAS 21 S.02.01.03.R0530C0010=S.17.01.01.R0010C0050+S.17.01.01.R0010C0060+S.17.01.01.R0010C0070+S.17.01.01.R0010C0080+S.17.01.01.R0010C0090+S.17.01.01.R0010C0100+S.17.01.01.R0010C0110+S.17.01.01.R0010C0120+S.17.01.01.R0010C0130+S.02.01.b.L1A = S.17.01.b.D1+S.17.01.b.E1+S.17.01.b.F1+S.17.01.b.G1+S.17.01.b.H1+S.17.01.b.I1+S.17.01.b.J1+S.17.01.b.K1+S.17.01.b.L1+S.17.01.b.N1+S.17.01.b.O1+S.17.01.b.P1Solo SolvencyIIReporting Annual
CAS 22 S.02.01.03.R0540C0010=S.17.01.01.R0260C0050+S.17.01.01.R0260C0060+S.17.01.01.R0260C0070+S.17.01.01.R0260C0080+S.17.01.01.R0260C0090+S.17.01.01.R0260C0100+S.17.01.01.R0260C0110+S.17.01.01.R0260C0120+S.17.01.01.R0260C0130+S.02.01.b.L2 = S.17.01.b.D23+S.17.01.b.E23+S.17.01.b.F23+S.17.01.b.G23+S.17.01.b.H23+S.17.01.b.I23+S.17.01.b.J23+S.17.01.b.K23+S.17.01.b.L23+S.17.01.b.N23+S.17.01.b.O23+S.1Solo SolvencyIIReporting Annual
CAS 23 S.02.01.03.R0550C0010=S.17.01.01.R0280C0050+S.17.01.01.R0280C0060+S.17.01.01.R0280C0070+S.17.01.01.R0280C0080+S.17.01.01.R0280C0090+S.17.01.01.R0280C0100+S.17.01.01.R0280C0110+S.17.01.01.R0280C0120+S.17.01.01.R0280C0130+S.02.01.b.L3 = S.17.01.b.D25+S.17.01.b.E25+S.17.01.b.F25+S.17.01.b.G25+S.17.01.b.H25+S.17.01.b.I25+S.17.01.b.J25+S.17.01.b.K25+S.17.01.b.L25+S.17.01.b.N25+S.17.01.b.O25+S.1Solo SolvencyIIReporting Annual
AGENDA
1) Taleo Reporting
2) Our Regulatory Offer
3) TALEO Reporting by module
Focus on : 4) TALEO Reporting added-value
Solution Delivery
A 3 Steps Approach :
1 ) What is needed ?
• 1 server or 1 VM
No specific infrastructure project needed
No software / hardware acquisition
No recurring cost (soft, hard, maintenance, people)
Simple infrastructure for a shorter production
3 ) Reporting Delivery
• On site or outsourcing with Cetrel Securities
• Customer resources or TALEO Reporting resources
• Automatic controls on output (content and format)
2 ) Speeding up your Data Collection
• Pre-defined templates for required data
• Mapping data with regulatory indicators
• Multi-source data aggregation
• Pre-defined procedures and documentation
• Integration with Company Active Directory (AD)
• 4 Profiles linked to information Criticity & Treatment
Data
Mapping
Data
Processing
Reports
Creation
Reports
Validation
LOG MANAGEMENT
Profile 1 : Application Administrator
- Full Access
Profile 2 : Compliance Officer
- Validation of Reports Content
- Send report to authorities
Profile 3 : Risk Management
- Control & Validation of Reports
Content
Profile 4 : Accounting
- Control & Validation of Reports
Content
Our Support – WE DO IT FOR YOU !
32
Security features : Audit log & Traceability
Log Database enables to
see :
•Who… viewed,
modified,
exported…
• When, what,
where ?
Audit Log & Traceability:
Product Key Features
 DASHBOARD PRODUCTION
• Real Time Import Follow-up
• Instant Accuracy Measurement
• Visual Status Metrics
• Key Metrics at Company Level (ie: Exposure, Leverage, Counterparty Risk, Main
Items, …)
 DASHBOARD CONTROL
• Variance Analysis (ie: Change in NAV, AuM, Leverage, …)
• Product Analysis (ie: Number of Derivatives, …)
 AUDIT TRAIL
• Real Time Access to All Assets by Fund
• Tailored Business Views by Fund
• New Instruments Report
 SINGLE ACCESS TO REPORTS
Delivery Model : a 3-steps approach
34
1. WHAT IS NEEDED ? (IT Security Fully Compliant)
• In sourcing -> 1 server or 1 VM
o No specific infrastructure project need
o No software / hardware acquisition
o No recurring cost (soft, hard, maintenance, people)
o Simple infrastructure for a shorter production time
• Out sourcing -> CETREL Securities
2. SPEEDING UP YOUR DATA COLLECTION
• Pre-defined templates for required data
• Mapping data with regulatory indicators
• Multi-source data aggregation
• Pre-defined procedures and documentation
3. REPORTING DELIVERY
• On site
• Customer resources or TALEO Reporting resources
• Automatic controls on output (content and format)
Optimize your Regulatory TCO
35
 DELIVERY
• First Step: Client’s Data Assessment / Initial System Setup (time-to-
delivery : 1-2 months)
• Second Step: Monthly Reporting
 ROI
• No recurring costs (IT infrastructure)
• Savings average of +/- 55% vs. multi-silo reporting
environments/activities
Our Value Added
36
 EXPERTISE
• Strong expertise in the regulatory field
• Used by Big Four Company
• FATCA Agreement from French authorities, ACD and FIN IRS
• Best practices
 RELIABLE PRODUCT
• More than 1000 funds, outputs in few minutes
• Secured production process
 REGULATORY AT CONTROLLED COST
• For customers, avoid implementing different reporting systems
and manage less complexity
• One solution designed to fit with different regulations

TALEO_Reporting_Global_VF

  • 1.
    Specialized Advisory Firmin FINANCIAL SERVICES Focus on our Expertise in Regulatory & Standard Tripartite Reporting Services
  • 2.
    AGENDA 1) Taleo Reporting 2)Our Regulatory Offer 3) TALEO Reporting by module 4) TALEO Reporting added-value
  • 3.
    AGENDA 1) Taleo Reporting 2)Our Regulatory Offer 3) TALEO Reporting by module Focus on : 4) TALEO Reporting added-value
  • 4.
    TALEO group willallow, by its Advisory Services, to sustain TALEO Reporting activities by its existing markets and partners TALEO Reporting by TALEO CustomersConsultants Commercial Development - Network - Prospections - Bid & Delivery Technical development - Staffing - Permanent Task Force Available
  • 5.
    Our combined expertiseallow us to assist our Clients on all phases linked to current and ongoing regulations An Association covering the entire Regulatory Chain New Regulation Regulation Analysis - Gap Analysis - « As Is » Analysis - « To Be » Proposal Consultants at your disposal: - Business Analysts - Project Managers - Change Managers Operational Implementation - Targetted Process defined - Communication with IT - System Adjustments - Testing Consultants at your disposal: - Project Managers - Change Managers - Business Analysts - Technical Analysts - Developers - Testers Regulatory Reporting - Data Mapping - Control Checks - Reportings Creation - Taxonomy Release Management Consultants at your disposal: - Risk Managers - Report Production Coordinators - Developers - Quality Auditors Phase 1 Phase 3Phase 2 Advisory Services Reporting Services
  • 6.
    AGENDA 1) Taleo Reporting 2)Our Regulatory Offer 3) TALEO Reporting by module Focus on : 4) TALEO Reporting added-value
  • 7.
    Our Regulatory Offer •EMIRReporting to DTCC & Register-TR •Back-load processing & reporting •MIFID 2 Reporting • EMIR / TAF / MiFID II / MiFIR •OECD Common Reporting Standard •FATCA / CRS Reporting •US Passthru Payment Percentage FATCA / CRS / QI •Entire Taxonomy Coverage •Specific Template from ECB and SPV •Full Computation of Market Risk SOLVENCY II •Classification •Leverage •Market Risk Profile AIFMD FORM PF •Credit and Counterparty credit risk (CR) •Market Risk (MKR)/ solvency ratio •Leverage Ratio (LR) •Liquidity Ratios (LCR / NSFR) CRDIV PRIIPS •Production of Standard Template if needed •Computation of Risk Summary Indicators •Monitoring of Change & Automatic Update of PRIIPS
  • 8.
    Standard Tripartite Offer •Standard Tripartite Template for performance and risk reporting • Defines common principles, metrics, aggregation of risk information and taxonomy • Developed and maintained by the industry OPERA • Solvency II Tripartite Standard Template from AM / FA to undertakings • Validated by AFG (FR), BVI (DE) and IMA (UK) SII for Funds • Liquidity Report • Risk ReportADHOC
  • 9.
    Different Regulations Out-of-the-Box 1.)Connect Ebable mapping between client’s data & application data model 2.) Compute Process calculation algorythms based on precise regulatory methods 3.) Analyse Check consistency regarding entry data & computed results 4.) Generate Extract filled reports into several file formats Positions Transactions Customer Financial Data AuM Leverage Client Computed Values Market Data Exchanges I Reuters Regulatory Calculation Specifications ESMA I EBA Adhoc Methodologies Reports Solva 2 I FATCA AIFMD I CRDIV AMPERE I OPERA MIFID 2 I CRS PRIIPS XML I XBRL PDF I XLSX File Format
  • 10.
    AGENDA 1) Taleo Reporting 2)Our Regulatory Offer 3) TALEO Reporting by moduleFocus on : 4) TALEO Reporting added-value
  • 11.
    AIFMD Module 11 Production byAIF and at AIFM level of: • Classifications, • Risk Indicators, • Liquidity Profiles, • Leverages & Exposures, • Counterparty Risks • etc AIFMD Dashboards Production Spot check and variances by: • Derivatives, • Leverages and Exposures, • AuM, • Risk indicators, • Counterparty Risks • etc AIFMD Dashboards Controls
  • 12.
    12 Various analysis toolsby AIF and at AIFM: • Audit trail for commitment exposure computation • Automatic comparison of users and computed figures • Display of underlying used data AIFMD Module AIFMD Computations Analysis
  • 13.
    - FATCA / CRS/ QI Overview FATCA / CRS Reporting: • TALEO Reporting is a Registered ISV at IRS • FATCA implementation for France & Luxembourg • Flexible Business Rules Maintenance • Multiple Reporting : FATCA & CRS & QI • Weekly Regulation watching FATCA / CRS / QI Module
  • 14.
    - FATCA / CRS/ QI Simulations FATCA / CRS Reporting: • Simulations based on Business Rules • Clients Tax Reports in XLS & PDF • Scability to meet high Volume FATCA / CRS / QI Module
  • 15.
    - FATCA / CRS/ QI – XML Reports in One Click Few Steps to Comply with FATCA / CRS / QI : 1. Data Mapping 2. Data Import 3. Validation & Review of Imported Data 4. XML Production in One Click 5. XLS Production to review XML content 6. PDF Reports available to send to clients 7. Transmission to ACD FATCA / CRS / QI Module
  • 16.
    - SII / Look-ThroughOverview Solvency II / Look-Through Reporting: • Solvency II Tripartite Standard Template from AM / FA to undertakings • Validated by AFG (Fr), BVI (De) & IMA (UK) • No Levels Limit • Data Captured & Enriched from various Solvency II / Look-Through Module Position Name Position Quantity PL Ccy Mid NAV Look-Through SCR Amount SCR Amount % Level % Coverage EUR 524,756,021.68 165,215,464.56 31.48% 100.00% FRANCE SMALL CAP 800.00 EUR 529.91 423,928.00 Yes 134,053.23 31.62% 1 100.00% INSTITUTIONS 7,600.00 EUR 2,551.13 19,388,588.00 Yes 534,766.64 2.76% 1 100.00% FRANCE MID CAP 6,000.00 EUR 2,036.12 12,216,720.00 Yes 3,758,029.22 30.76% 2 100.00% EXPORT EUROPE 16,000.00 EUR 181.65 2,906,400.00 Yes 830,195.64 28.56% 6 100.00% 489,820,385.68 160,105,606.40
  • 17.
    - SII / Look-ThroughOverview Look-Through Process to Manage Levels : • Automatic Insertion of All Funds • Automatic Insertion of Held Assets per Fund • Upload of All Inventories of Inserted Assets • Enrichment of the Positions • Computations & Reporting Solvency II / Look-Through Module Few Steps to Comply with Solvency II / Look-Through: 1. Data Mapping with Sources 2. Data Import 3. Validation & Review of Imported Data 4. Set-Up of the Look-Through Process 5. XBRL or XML Production in One Click 6. XLS Production to review XBRL or XML content
  • 18.
    - SII / Look-ThroughIllustration Solvency II / Look-Through Module
  • 19.
    - SII / Look-ThroughInventories & Data Enrichment Solvency II / Look-Through Module Find a Source of Funds’ Raw Inventories : • In-House Source • External Providers (MorningStar, Lipper, Telekurs, Barclays, etc.) Find a Source of Funds’ Raw Inventories & Enriched their Assets : • In-House Source or External Providers • TALEO Reporting to Enrich the Positions Find a Source of Funds’ Enriched Inventories : • In-House Source • External Providers (MorningStar, Lipper ?, Telekurs, Barclays ?, etc.) Option 2: Option 1: Option 3:
  • 20.
    - EMIR • Fillingto TRO : Regis-TR, DTCC… • Realized with 2 Clients • XML Reporting • Leveraged with existing Technology & EMIR EMIR / TAF / MiFID II / MiFIR Module • Filling to: Target National Authority • Being tested with 2 Clients • XML Reporting • Leveraged with Existing Technology & MiFID II TAF / MiFID II / MiFIR
  • 21.
    - EMIR / TAF/ MiFID II / MiFIR Module EMIR / TAF / MiFID II / MiFIR Overview Few Steps to Comply with EMIR / TAF / MiFID II / MiFIR : 1. Data Mapping 2. Data Import 3. Validation & Review of Imported Data 4. CSV / XML Production in One Click 5. XLS Production to review XML Content 6. Reporting Transmission to TRO or TNA…
  • 22.
    PRIIPs Module PRIIPs Categorisation CategoryDescription Methodology Parameters Category I a) All PRIIPs: up to 5 years; Capital Protected at 100%. b) All PRIIPs where investors could lose more than the amount they invested. c) Derivatives that qualify as PRIIPs. MRM = 1 MRM = 7 MRM = 7 N / A Category II AIFs ; UCITS; and similar Unit-linked insurance products Based on a 2,5% VaR, approximated by the Cornish Fisher expansion, calibrated using 5 years’ historical performance data for the PRIIPs Histo 5 Y Freq: W Proxies Category III PRIIPS with products with at least 2 years of historical daily prices or 4 years of historical weekly prices are available. Or a natural benchmark or proxy exists Based on a statistical approach, using forward simulation of the PRIIP’s performance calibrated on historical data Histo 5 Y Freq: W Proxies Category IV PRIIPs not fall under Category II or Category III PRIIPs. Alternative N / A Category V Insufficient data are available so as to accurately estimate the market risk based on the methodology implemented for Category II or Category III PRIIPs Alternative N / A : Insurances
  • 23.
    PRIIPs Module PRIIPs :Summary Risk Indicator (SRI) : Insurances Category Risk Class Methodo. Param. Category I 1 - 7 Qualititative N / A Category II 1 - 7 CF VaR 97.5 Histo 5 Y Freq: W Proxies Category III 1 - 7 MC 97.5 Histo 5 Y Freq: W Proxies Category IV 1 - 7 Alternative N / A Category V 1 - 7 Alternative N / A Market Risk Measure (MRM) Credit Quality Steps Credit Risk Class 0 1 1 1 2 1 3 2 4 3 5 4 6 5 MRM 1 2 3 4 5 6 7 (Obligors / Manufacturers) Credit Risk Measure (CRM) CRM MRM MR1 MR2 MR3 MR4 MR5 MR6 MR7 CR1 1 2 3 4 5 6 7 CR2 1 2 3 4 5 6 7 CR3 3 3 3 4 5 6 7 CR4 5 5 5 5 5 6 7 CR5 6 6 6 6 6 6 7 Insurance in Luxembourg : • The Triparty Agreement among the Insurance, the CAA & the Banks guarantees the Insurers with no Limit. CR = 1 • However, the Credit Risk exists for the Depository => Look-Through to Level 1 only ? Summary Risk Indicator (SRI)
  • 24.
    PRIIPs Module PRIIPs :SRI Results Holder Policy Policies Profiles • Notation Vs Profile Alerts if only Current Risk is above Contractual Risk • Daily Computations & Alerts
  • 25.
    PRIIPs Module PRIIPs :Summary Risk Indicator (SRI)  Methodology: Compute policies volatilities: • Get composition of each policy  Compute funds volatilities: • Historical NAV & dividends: 5 years • Frequency: weekly • If historical data is missing: use proxies  Compute policies volatilities: • Get composition of each policy • Compute policies volatilities • Allocate the volatilities to their relevant Market Risk Classes  Aggregation with Credit Risk and SRI • Look-Through to the obligors • Get their Ratings • Convert to CQS • Determine the SRI  Monitoring of SRI: • On daily basis: repeat the computation of SRI • Monitor the changes and produce the new PRIIPs if the SRI changes Credit Risk needed for : • Manufacturers • All Obligors when PRIIPs are embedded • Counterparty of Non Cleared Derivative PRIIPs if Exposure > 10% • Any Counterparty that should make Payment Exclude AIFs & UCITS Fitch PD 1 year 5 years Ratings CQS 0.04% 0.28% AAA Y AA 0 or 1 0.08% 0.69% A 2 0.22% 1.96% BBB 3 1.15% 8.10% BB 4 2.22% 15.37% B 5 28.07% 58.70% CCC or less 6 (Multi-Obligors: Equally weighted PD and CQS)
  • 26.
    Solvency II Module SolvencyII Reporting : FULL STP WORKFLOW Solvency II reporting : • Entire Taxonomy Coverage (DPM 2.0) • Additional Local Reports (CAA XLS) • Full Automation of Reporting Generation & Transmission through SOFIE
  • 27.
    Solvency II Module SolvencyII Reporting Overview Few Steps to Comply with Solvency II Reporting : 1. Data Mapping 2. Data Import 3. Validation & Review of Imported Data 4. XBRL Production in One Click 5. XLS Production to review XBRL Content 6. Transmission to CAA through SOFIE
  • 28.
    Solvency II Module ControlsFeatures : EIOPA & BR Controls Controls are Mandatory to guarantee Accurate Reporting: • Already all EIOPA Controls are implemented (148 B. Rules) • Additional BR are being implemented and can be extended upon request ID Rule Assertion InstitutionType ReportingType Frequency CAS 1 S.02.01.03.R0500C0010=Sum(S.02.02.01.R0100C0050[CUR]) S.02.01.b.A30 = Sum(S.02.02.b.A7A[CUR]) Solo SolvencyIIReporting Annual CAS 2 S.02.01.03.R0900C0010=Sum(S.02.02.01.R0200C0050[CUR]) S.02.01.b.L25A = Sum(S.02.02.b.A15[CUR]) Solo SolvencyIIReporting Annual CAS 3 S.02.01.03.R0070C0010=Sum(S.02.02.01.R0020C0050[CUR]) S.02.01.b.A4 = Sum(S.02.02.b.A3[CUR]) Solo SolvencyIIReporting Annual CAS 4 S.02.01.03.R0060C0010+S.02.01.03.R0420C0010+S.02.01.03.R0240C0010+S.02.01.03.R0250C0010+S.02.01.03.R0260C0010=Sum(S.02.02.01.R0030C0050[CUR])S.02.01.b.A3+S.02.01.b.A27 + S.02.01.b.A14A + S.02.01.b.A14B + S.02.01.b.A14BC = Sum(S.02.02.b.A4[CUR])Solo SolvencyIIReporting Annual CAS 5 S.02.01.03.R0220C0010=Sum(S.02.02.01.R0040C0050[CUR]) S.02.01.b.A12 = Sum(S.02.02.b.A5[CUR]) Solo SolvencyIIReporting Annual CAS 6 S.02.01.03.R0270C0010=Sum(S.02.02.01.R0050C0050[CUR]) S.02.01.b.A16 = Sum(S.02.02.b.A5A[CUR]) Solo SolvencyIIReporting Annual CAS 7 S.02.01.03.R0360C0010+S.02.01.03.R0370C0010+S.02.01.03.R0380C0010=Sum(S.02.02.01.R0060C0050[CUR])S.02.01.b.A13+S.02.01.b.A21+S.02.01.b.A20 = Sum(S.02.02.b.A6[CUR])Solo SolvencyIIReporting Annual CAS 8 S.02.01.03.R0030C0010+S.02.01.03.R0040C0010+S.02.01.03.R0050C0010+S.02.01.03.R0390C0010+S.02.01.03.R0430C0010+S.02.01.03.R0400C0010+S.02.01.03.R0410C0010=Sum(S.02.02.01.R0070C0050[CUR])S.02.01.b.A2+S.02.01.b.A26+S.02.01.b.A25B+S.02.01.b.A23+S.02.01.b.A29 + S.02.01.b.A28A + S.02.01.b.A28B = Sum(S.02.02.b.A7[CUR])Solo SolvencyIIReporting Annual CAS 9 S.02.01.03.R0520C0010+S.02.01.03.R0560C0010+S.02.01.03.R0610C0010+S.02.01.03.R0650C0010=Sum(S.02.02.01.R0110C0050[CUR])S.02.01.b.L1+S.02.01.b.L4+S.02.01.b.L6B+S.02.01.b.L7 = Sum(S.02.02.b.A8[CUR])Solo SolvencyIIReporting Annual CAS 10 S.02.01.03.R0690C0010=Sum(S.02.02.01.R0120C0050[CUR]) S.02.01.b.L10 = Sum(S.02.02.b.A9[CUR]) Solo SolvencyIIReporting Annual CAS 11 S.02.01.03.R0770C0010+S.02.01.03.R0820C0010+S.02.01.03.R0830C0010=Sum(S.02.02.01.R0130C0050[CUR])S.02.01.b.L13+S.02.01.b.L15A+S.02.01.b.L15B = Sum(S.02.02.b.A10[CUR])Solo SolvencyIIReporting Annual CAS 12 S.02.01.03.R0790C0010=Sum(S.02.02.01.R0140C0050[CUR]) S.02.01.b.L16 = Sum(S.02.02.b.A11[CUR]) Solo SolvencyIIReporting Annual CAS 13 S.02.01.03.R0800C0010+S.02.01.03.R0810C0010=Sum(S.02.02.01.R0150C0050[CUR])S.02.01.b.L19+S.02.01.b.L20 = Sum(S.02.02.b.A12[CUR])Solo SolvencyIIReporting Annual CAS 14 S.02.01.03.R0740C0010=Sum(S.02.02.01.R0160C0050[CUR]) S.02.01.b.L23 = Sum(S.02.02.b.A13[CUR]) Solo SolvencyIIReporting Annual CAS 15 S.02.01.03.R0750C0010+S.02.01.03.R0760C0010+S.02.01.03.R0780C0010+S.02.01.03.R0840C0010+S.02.01.03.R0880C0010+S.02.01.03.R0870C0010+S.02.01.03.R0860C0010=Sum(S.02.02.01.R0170C0050[CUR])S.02.01.b.L18+S.02.01.b.L22+S.02.01.b.L17+S.02.01.b.L15C+S.02.01.b.L25+S.02.01.b.L26+S.02.01.b.L15D = Sum(S.02.02.b.A14[CUR])Solo SolvencyIIReporting Annual CAS 16 S.02.01.03.R0290C0010=S.17.01.01.R0330C0050+S.17.01.01.R0330C0060+S.17.01.01.R0330C0070+S.17.01.01.R0330C0080+S.17.01.01.R0330C0090+S.17.01.01.R0330C0100+S.17.01.01.R0330C0110+S.17.01.01.R0330C0120+S.17.01.01.R0330C0130+S.02.01.b.A17 = S.17.01.b.D27+S.17.01.b.E27+S.17.01.b.F27+S.17.01.b.G27+S.17.01.b.H27+S.17.01.b.I27+S.17.01.b.J27+S.17.01.b.K27+S.17.01.b.L27+S.17.01.b.N27+S.17.01.b.O27+S.Solo SolvencyIIReporting Annual CAS 17 S.02.01.03.R0300C0010=S.17.01.01.R0330C0020+S.17.01.01.R0330C0030+S.17.01.01.R0330C0040+S.17.01.01.R0330C0140S.02.01.b.A18 = S.17.01.b.A27+S.17.01.b.B27+S.17.01.b.C27+S.17.01.b.M27Solo SolvencyIIReporting Annual CAS 18 S.02.01.03.R0320C0010=S.12.01.01.R0080C0170+S.12.01.01.R0080C0180+S.12.01.01.R0080C0190+S.12.01.01.R0080C0200S.02.01.b.A18A = Sum(S.12.01.b.C10…C13) Solo SolvencyIIReporting Annual CAS 19 S.02.01.03.R0330C0010=S.12.01.01.R0080C0020+S.12.01.01.R0080C0070+S.12.01.01.R0080C0080+S.12.01.01.R0080C0090+S.12.01.01.R0080C0100S.02.01.b.A19 = S.12.01.b.C1+S.12.01.b.C4+S.12.01.b.C5+S.12.01.b.C6+S.12.01.b.C7Solo SolvencyIIReporting Annual CAS 20 S.02.01.03.R0340C0010=S.12.01.01.R0080C0040+S.12.01.01.R0080C0050S.02.01.b.A19A = S.12.01.b.C2 + S.12.01.b.C3 Solo SolvencyIIReporting Annual CAS 21 S.02.01.03.R0530C0010=S.17.01.01.R0010C0050+S.17.01.01.R0010C0060+S.17.01.01.R0010C0070+S.17.01.01.R0010C0080+S.17.01.01.R0010C0090+S.17.01.01.R0010C0100+S.17.01.01.R0010C0110+S.17.01.01.R0010C0120+S.17.01.01.R0010C0130+S.02.01.b.L1A = S.17.01.b.D1+S.17.01.b.E1+S.17.01.b.F1+S.17.01.b.G1+S.17.01.b.H1+S.17.01.b.I1+S.17.01.b.J1+S.17.01.b.K1+S.17.01.b.L1+S.17.01.b.N1+S.17.01.b.O1+S.17.01.b.P1Solo SolvencyIIReporting Annual CAS 22 S.02.01.03.R0540C0010=S.17.01.01.R0260C0050+S.17.01.01.R0260C0060+S.17.01.01.R0260C0070+S.17.01.01.R0260C0080+S.17.01.01.R0260C0090+S.17.01.01.R0260C0100+S.17.01.01.R0260C0110+S.17.01.01.R0260C0120+S.17.01.01.R0260C0130+S.02.01.b.L2 = S.17.01.b.D23+S.17.01.b.E23+S.17.01.b.F23+S.17.01.b.G23+S.17.01.b.H23+S.17.01.b.I23+S.17.01.b.J23+S.17.01.b.K23+S.17.01.b.L23+S.17.01.b.N23+S.17.01.b.O23+S.1Solo SolvencyIIReporting Annual CAS 23 S.02.01.03.R0550C0010=S.17.01.01.R0280C0050+S.17.01.01.R0280C0060+S.17.01.01.R0280C0070+S.17.01.01.R0280C0080+S.17.01.01.R0280C0090+S.17.01.01.R0280C0100+S.17.01.01.R0280C0110+S.17.01.01.R0280C0120+S.17.01.01.R0280C0130+S.02.01.b.L3 = S.17.01.b.D25+S.17.01.b.E25+S.17.01.b.F25+S.17.01.b.G25+S.17.01.b.H25+S.17.01.b.I25+S.17.01.b.J25+S.17.01.b.K25+S.17.01.b.L25+S.17.01.b.N25+S.17.01.b.O25+S.1Solo SolvencyIIReporting Annual
  • 29.
    AGENDA 1) Taleo Reporting 2)Our Regulatory Offer 3) TALEO Reporting by module Focus on : 4) TALEO Reporting added-value
  • 30.
    Solution Delivery A 3Steps Approach : 1 ) What is needed ? • 1 server or 1 VM No specific infrastructure project needed No software / hardware acquisition No recurring cost (soft, hard, maintenance, people) Simple infrastructure for a shorter production 3 ) Reporting Delivery • On site or outsourcing with Cetrel Securities • Customer resources or TALEO Reporting resources • Automatic controls on output (content and format) 2 ) Speeding up your Data Collection • Pre-defined templates for required data • Mapping data with regulatory indicators • Multi-source data aggregation • Pre-defined procedures and documentation
  • 31.
    • Integration withCompany Active Directory (AD) • 4 Profiles linked to information Criticity & Treatment Data Mapping Data Processing Reports Creation Reports Validation LOG MANAGEMENT Profile 1 : Application Administrator - Full Access Profile 2 : Compliance Officer - Validation of Reports Content - Send report to authorities Profile 3 : Risk Management - Control & Validation of Reports Content Profile 4 : Accounting - Control & Validation of Reports Content Our Support – WE DO IT FOR YOU !
  • 32.
    32 Security features :Audit log & Traceability Log Database enables to see : •Who… viewed, modified, exported… • When, what, where ? Audit Log & Traceability:
  • 33.
    Product Key Features DASHBOARD PRODUCTION • Real Time Import Follow-up • Instant Accuracy Measurement • Visual Status Metrics • Key Metrics at Company Level (ie: Exposure, Leverage, Counterparty Risk, Main Items, …)  DASHBOARD CONTROL • Variance Analysis (ie: Change in NAV, AuM, Leverage, …) • Product Analysis (ie: Number of Derivatives, …)  AUDIT TRAIL • Real Time Access to All Assets by Fund • Tailored Business Views by Fund • New Instruments Report  SINGLE ACCESS TO REPORTS
  • 34.
    Delivery Model :a 3-steps approach 34 1. WHAT IS NEEDED ? (IT Security Fully Compliant) • In sourcing -> 1 server or 1 VM o No specific infrastructure project need o No software / hardware acquisition o No recurring cost (soft, hard, maintenance, people) o Simple infrastructure for a shorter production time • Out sourcing -> CETREL Securities 2. SPEEDING UP YOUR DATA COLLECTION • Pre-defined templates for required data • Mapping data with regulatory indicators • Multi-source data aggregation • Pre-defined procedures and documentation 3. REPORTING DELIVERY • On site • Customer resources or TALEO Reporting resources • Automatic controls on output (content and format)
  • 35.
    Optimize your RegulatoryTCO 35  DELIVERY • First Step: Client’s Data Assessment / Initial System Setup (time-to- delivery : 1-2 months) • Second Step: Monthly Reporting  ROI • No recurring costs (IT infrastructure) • Savings average of +/- 55% vs. multi-silo reporting environments/activities
  • 36.
    Our Value Added 36 EXPERTISE • Strong expertise in the regulatory field • Used by Big Four Company • FATCA Agreement from French authorities, ACD and FIN IRS • Best practices  RELIABLE PRODUCT • More than 1000 funds, outputs in few minutes • Secured production process  REGULATORY AT CONTROLLED COST • For customers, avoid implementing different reporting systems and manage less complexity • One solution designed to fit with different regulations