More Related Content

PDF

PPT
Matematicas 1324 1317 1330 
ODP

PPTX

PPTX

PPTX

PPT

DOCX
Aplicaciones de las áreas de los polígonos Viewers also liked

PPTX
Tema 5: Operaciones con números decimales 
PPSX
Cuerpos y figuras geométricas 
PPTX
Formulación de explicaciones de la aplicacioón sucesiva de factores constante... 
PPT
Ecuaciones de primer_grado 
PPTX
Tema 6 los números decimales 
PPTX

PPT

PPTX
Tema 5: Operaciones con números decimales 
PPT

PPTX

PPTX

PPTX
Repaso de fracciones de números decimales infinitas y división de decimales 6to 
PPT
Ecuaciones de primer grado 
PDF

PPT
Division decimales bria gozalo_fran 
PPTX

PPT

ODP
3 ESO Tema10-Figuras y cuerpos geometricos 
PPT

PPT
More from lauritatg18

DOCX

DOC

DOC

DOC

DOC

DOC

DOC

DOC

DOC

DOC

DOC

DOC

DOC

DOC

DOC

DOC

DOCX

DOCX

DOCX

DOCX
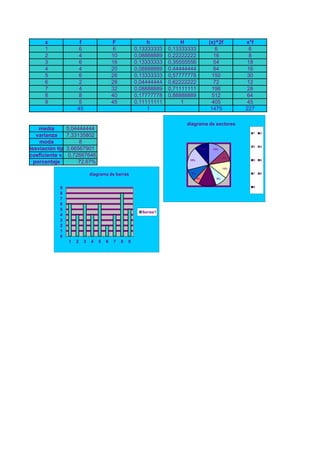
Tablas y diagramas
- 1.
x f Fh H (x)^2f x*f
1 6 6 0,13333333 0,13333333 6 6
2 4 10 0,08888889 0,22222222 16 8
3 6 16 0,13333333 0,35555556 54 18
4 4 20 0,08888889 0,44444444 64 16
5 6 26 0,13333333 0,57777778 150 30
6 2 28 0,04444444 0,62222222 72 12
7 4 32 0,08888889 0,71111111 196 28
8 8 40 0,17777778 0,88888889 512 64
9 5 45 0,11111111 1 405 45
45 1 1475 227
media 5,04444444
varianza 7,33135802
moda 8
desviación tip. 3,66567901
coeficiente v. 0,72667646
porcentaje 72,67%
13%
9%
13%
9%
13%
5%
9%
18%
11%
diagrama de sectores
1 2
3 4
5 6
7 8
9
0
1
2
3
4
5
6
7
8
9
1 2 3 4 5 6 7 8 9
diagrama de barras
Series1