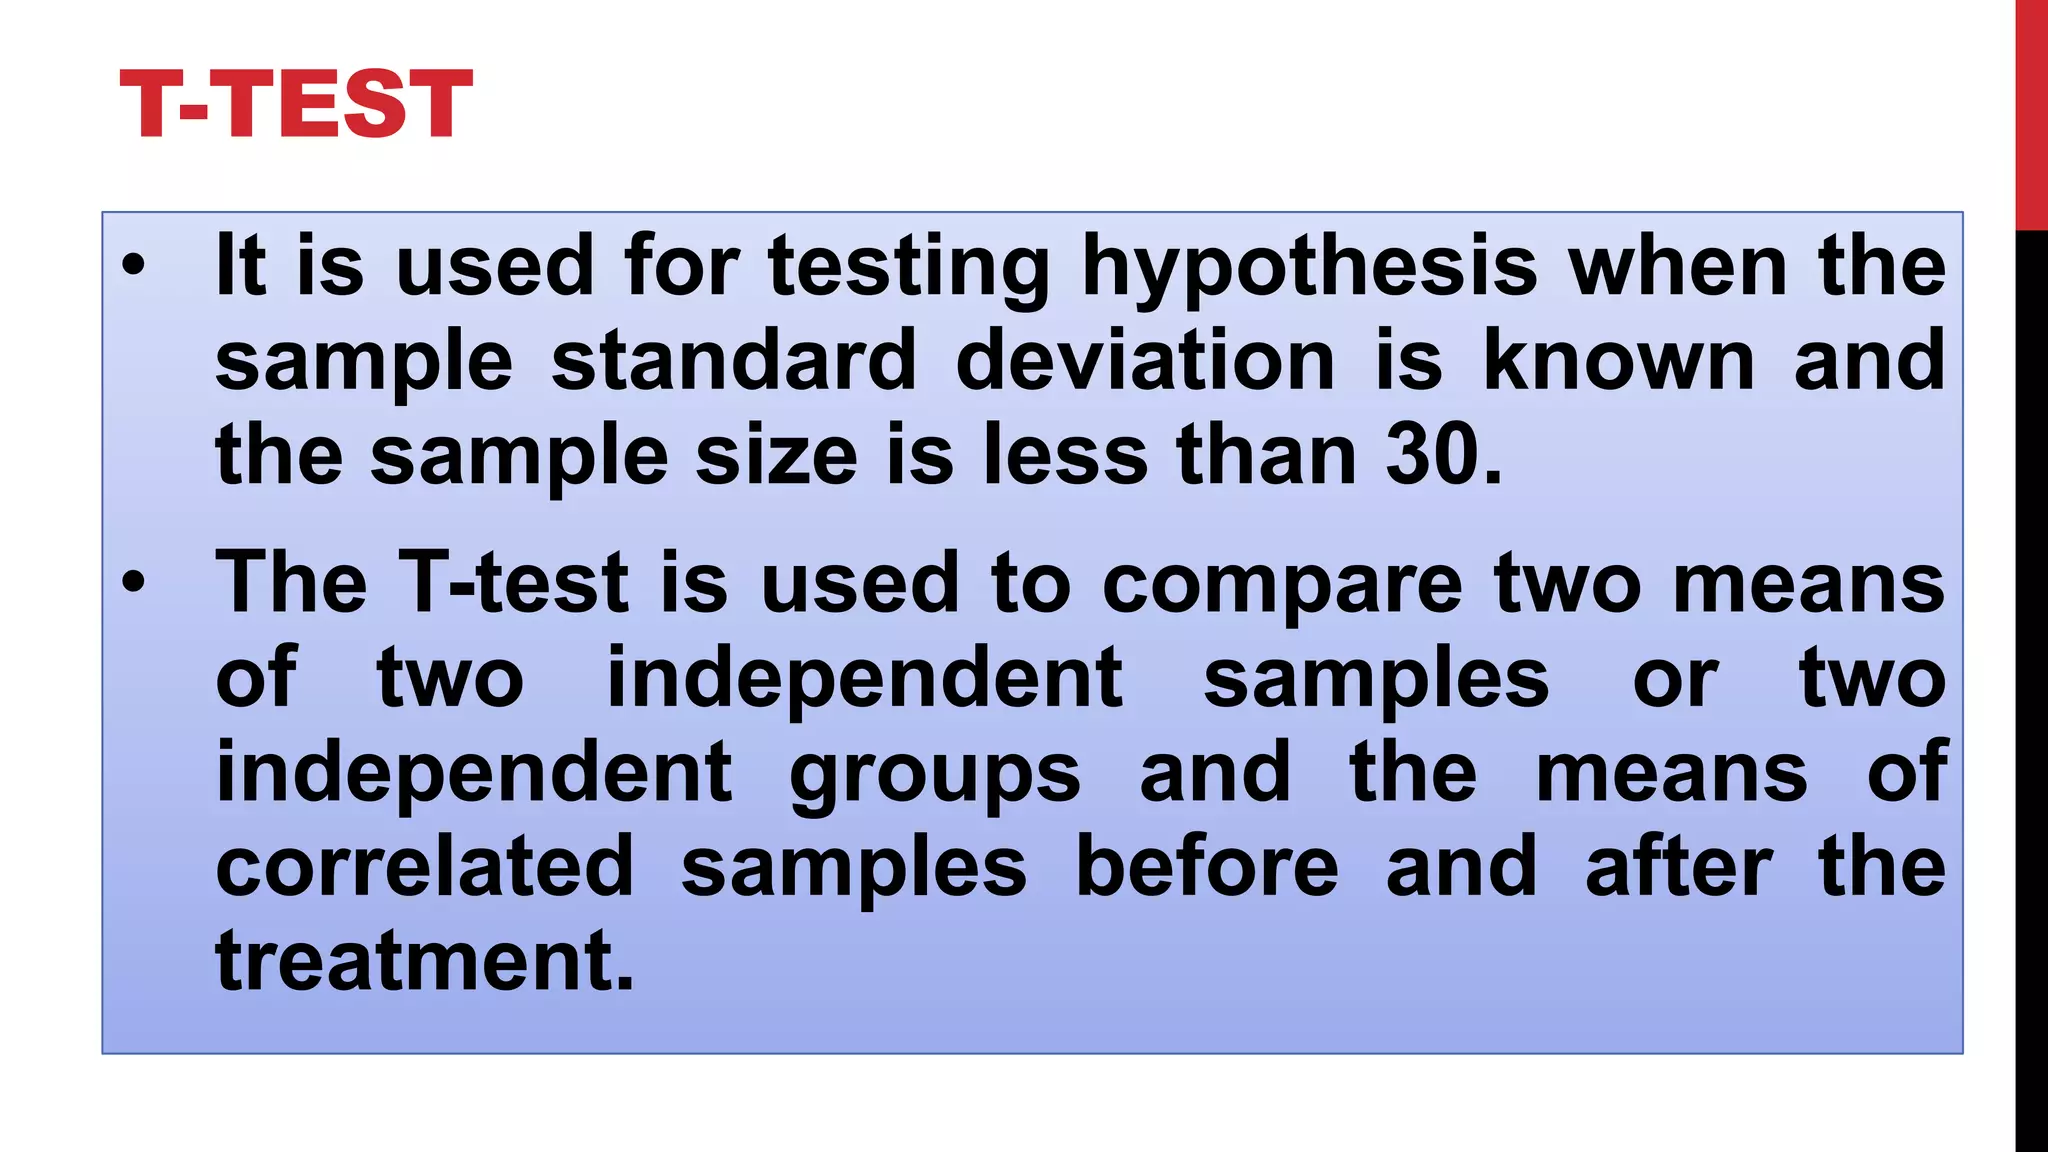
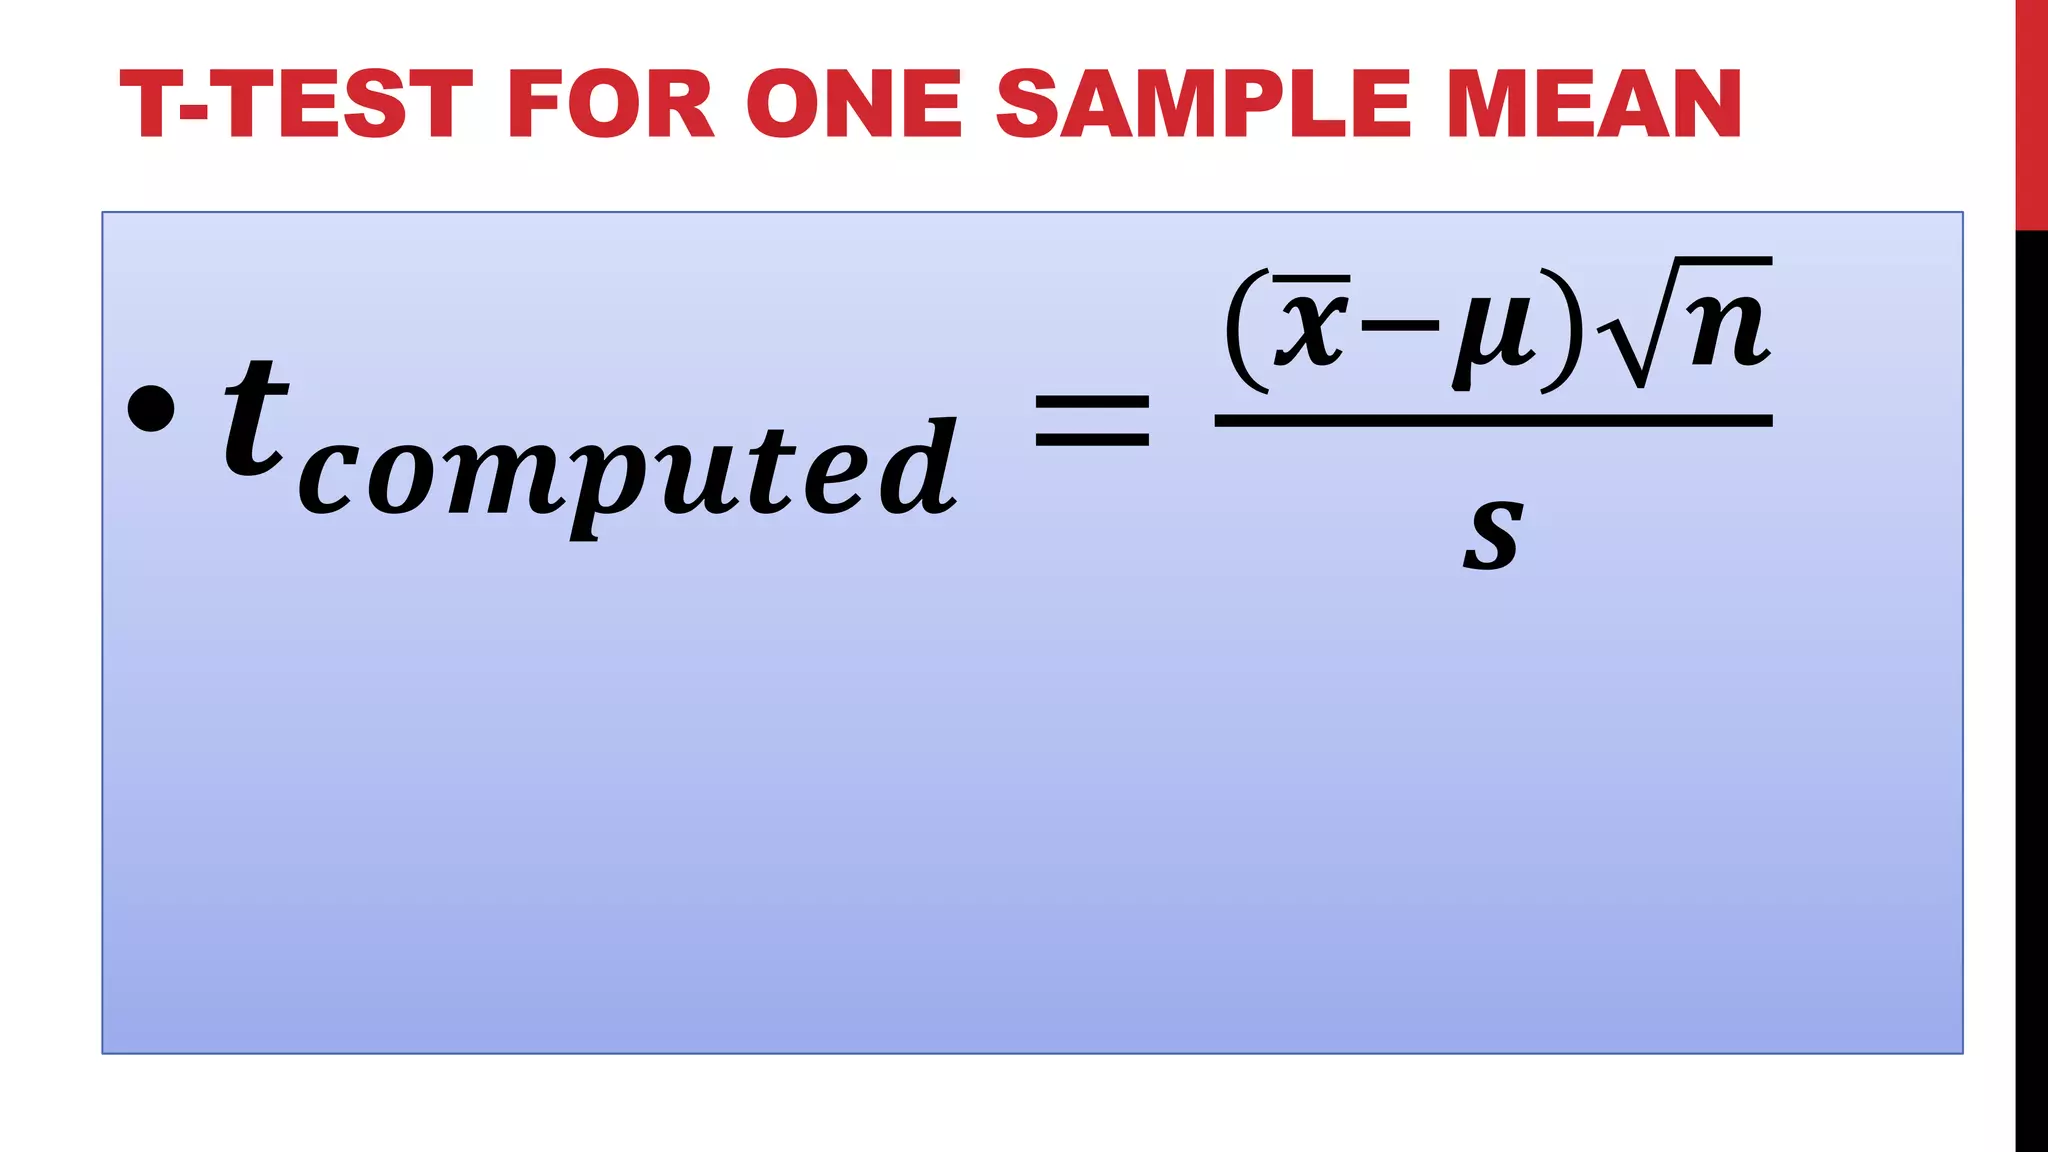
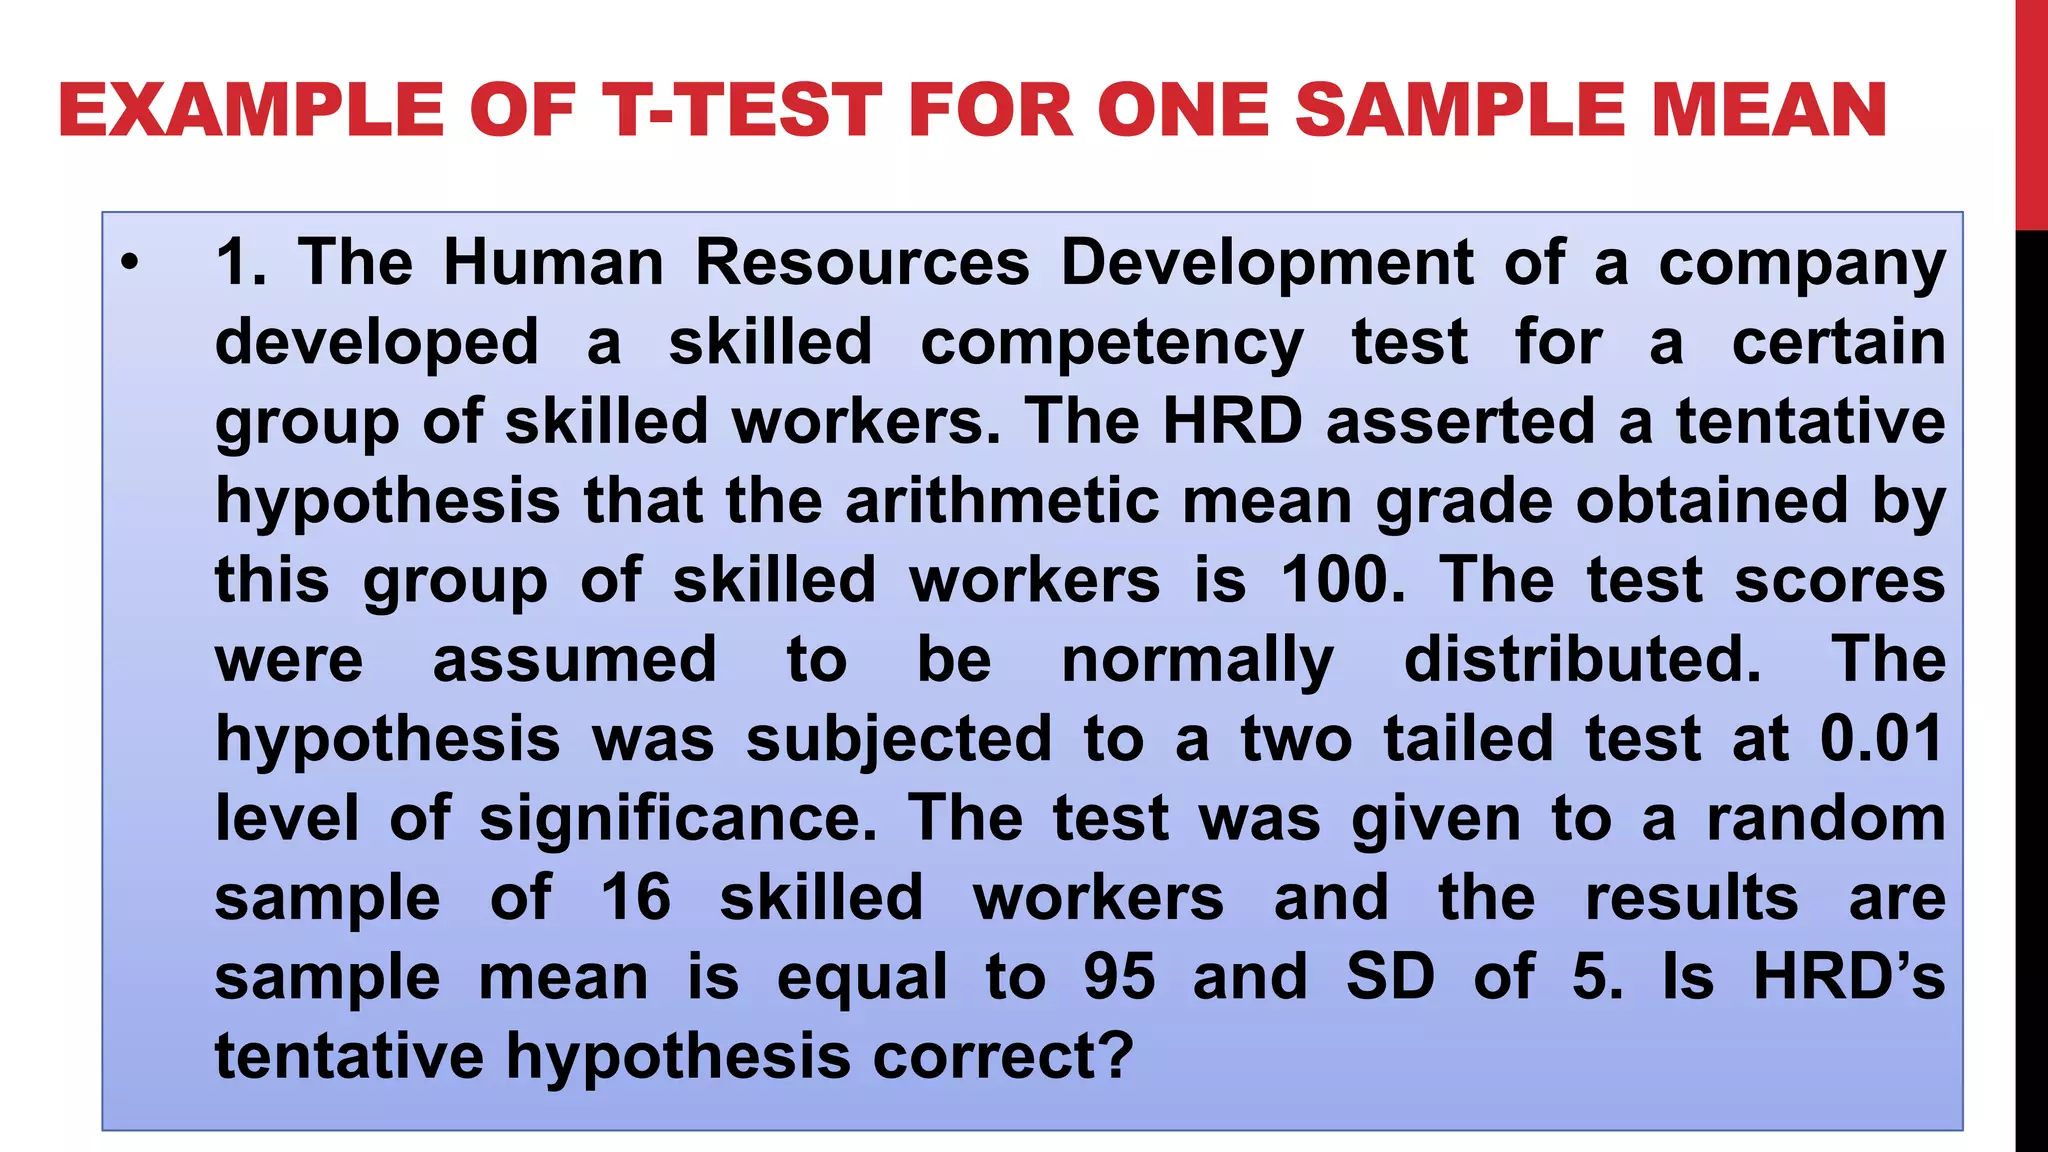
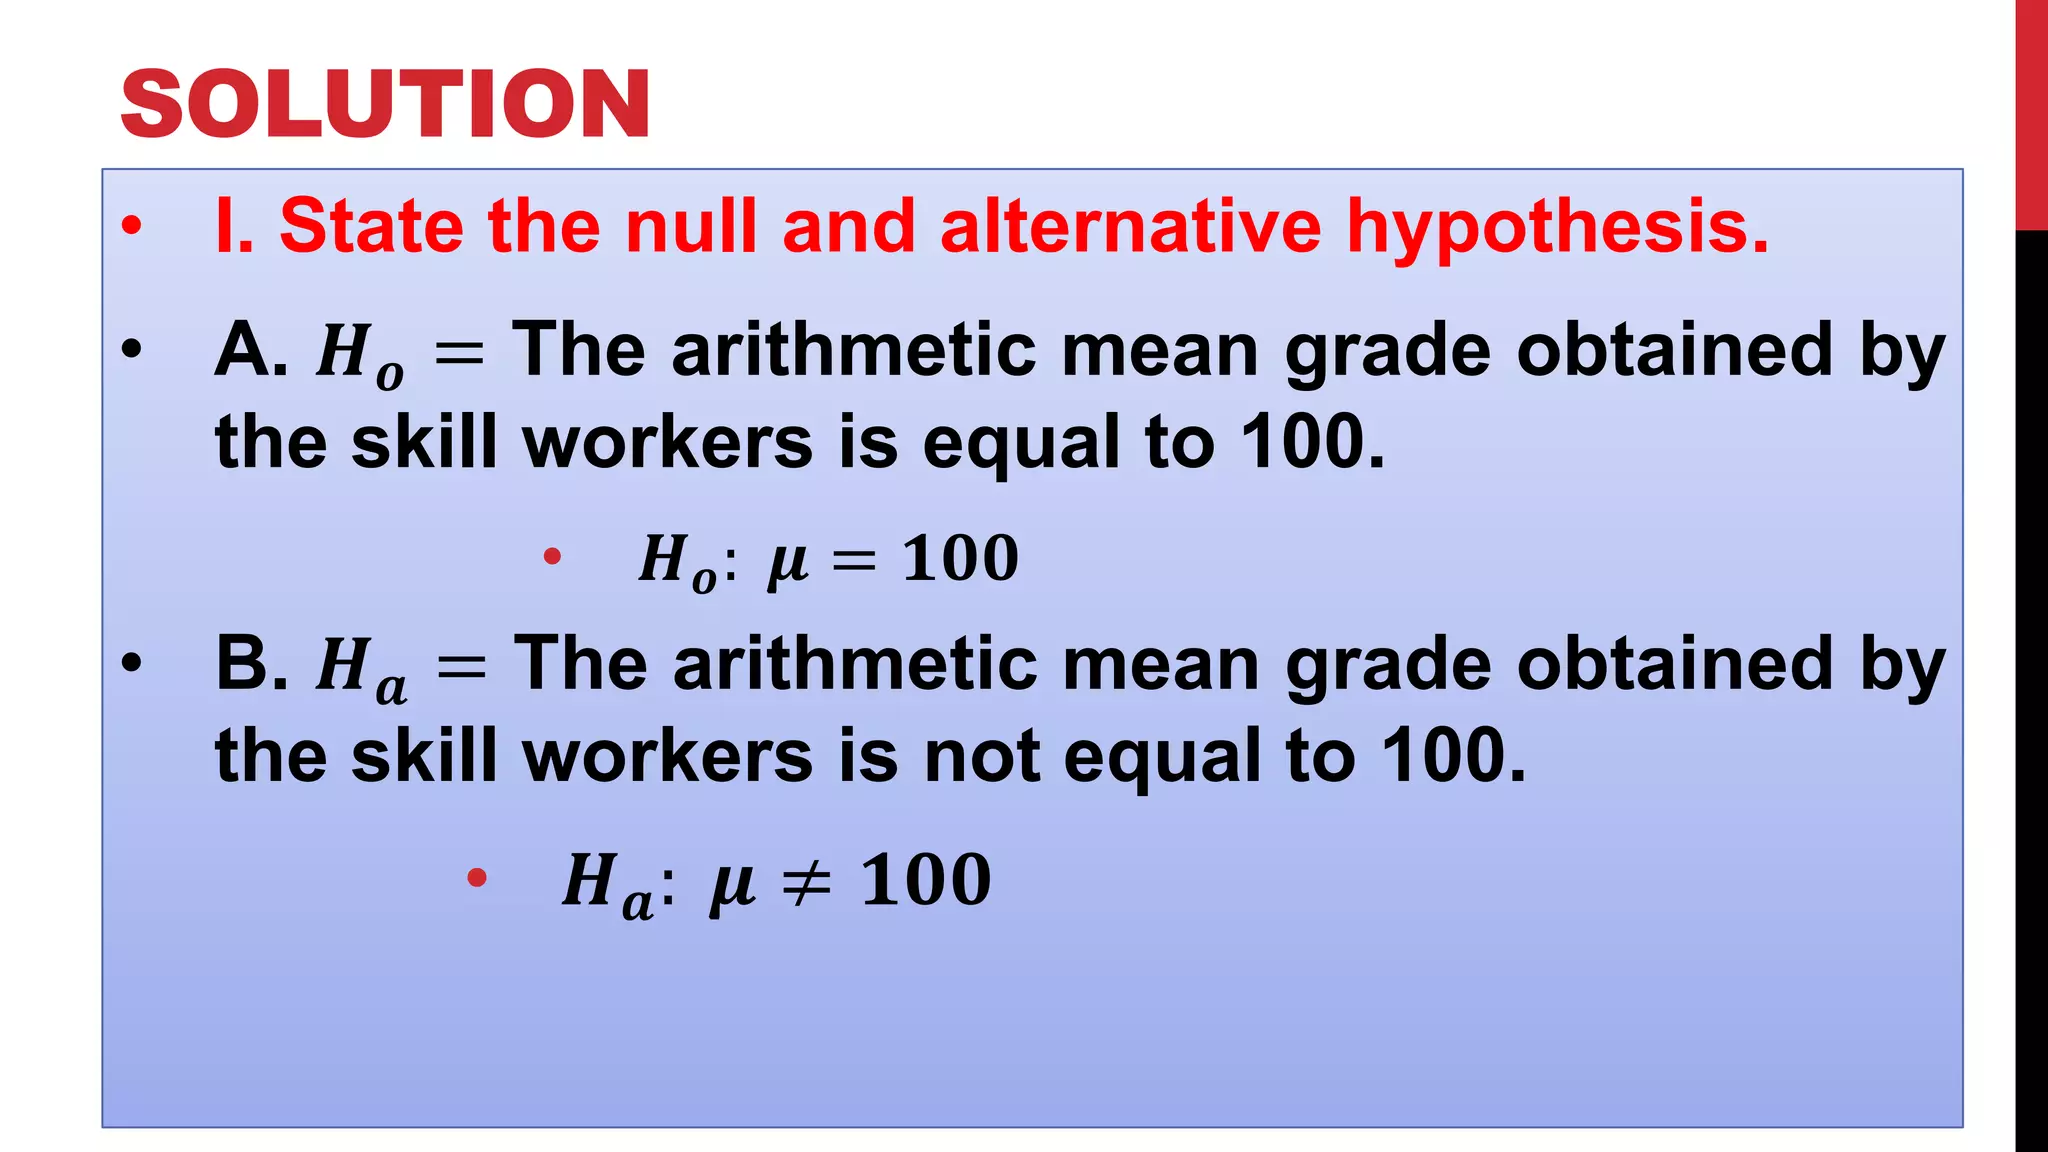
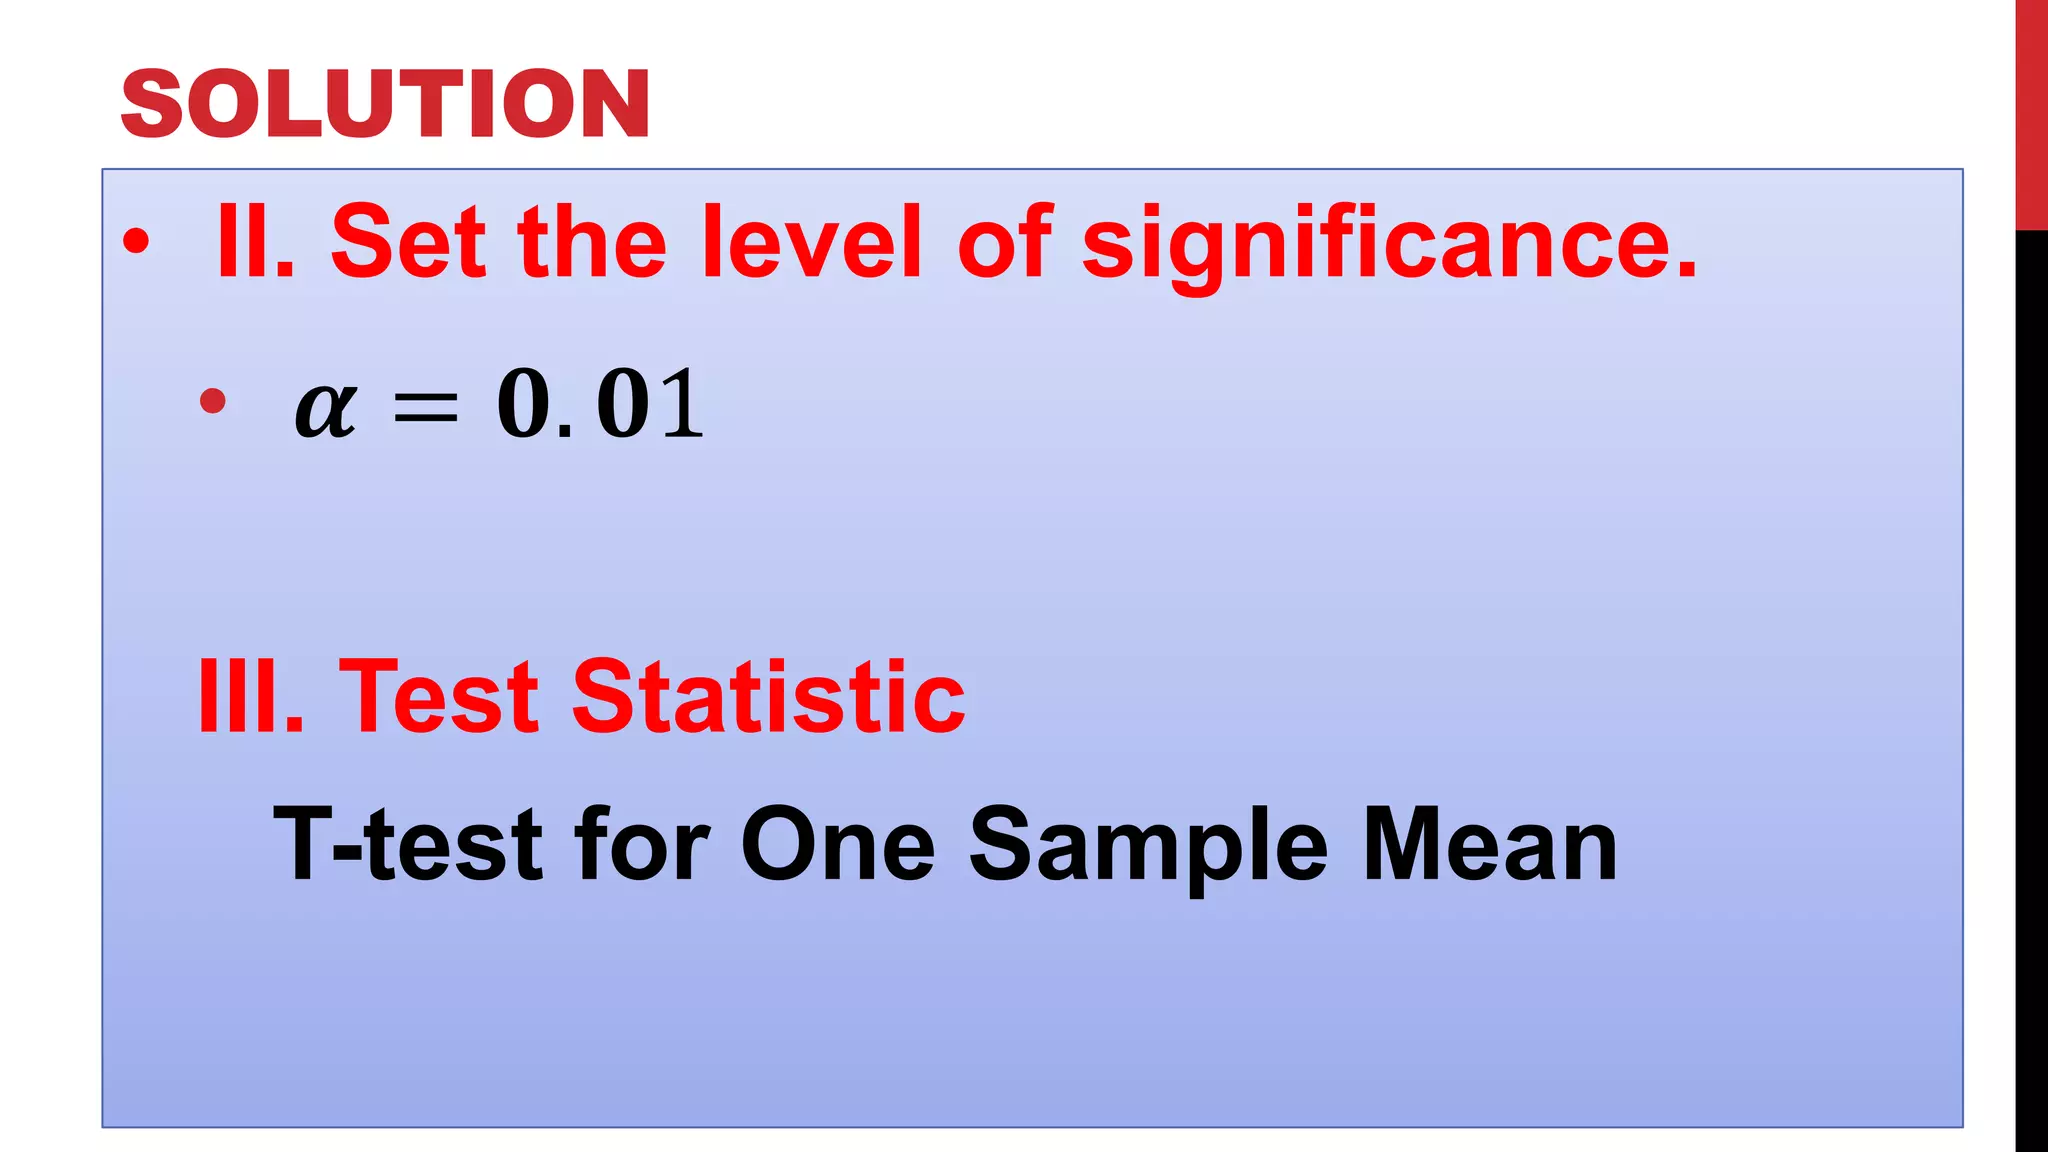
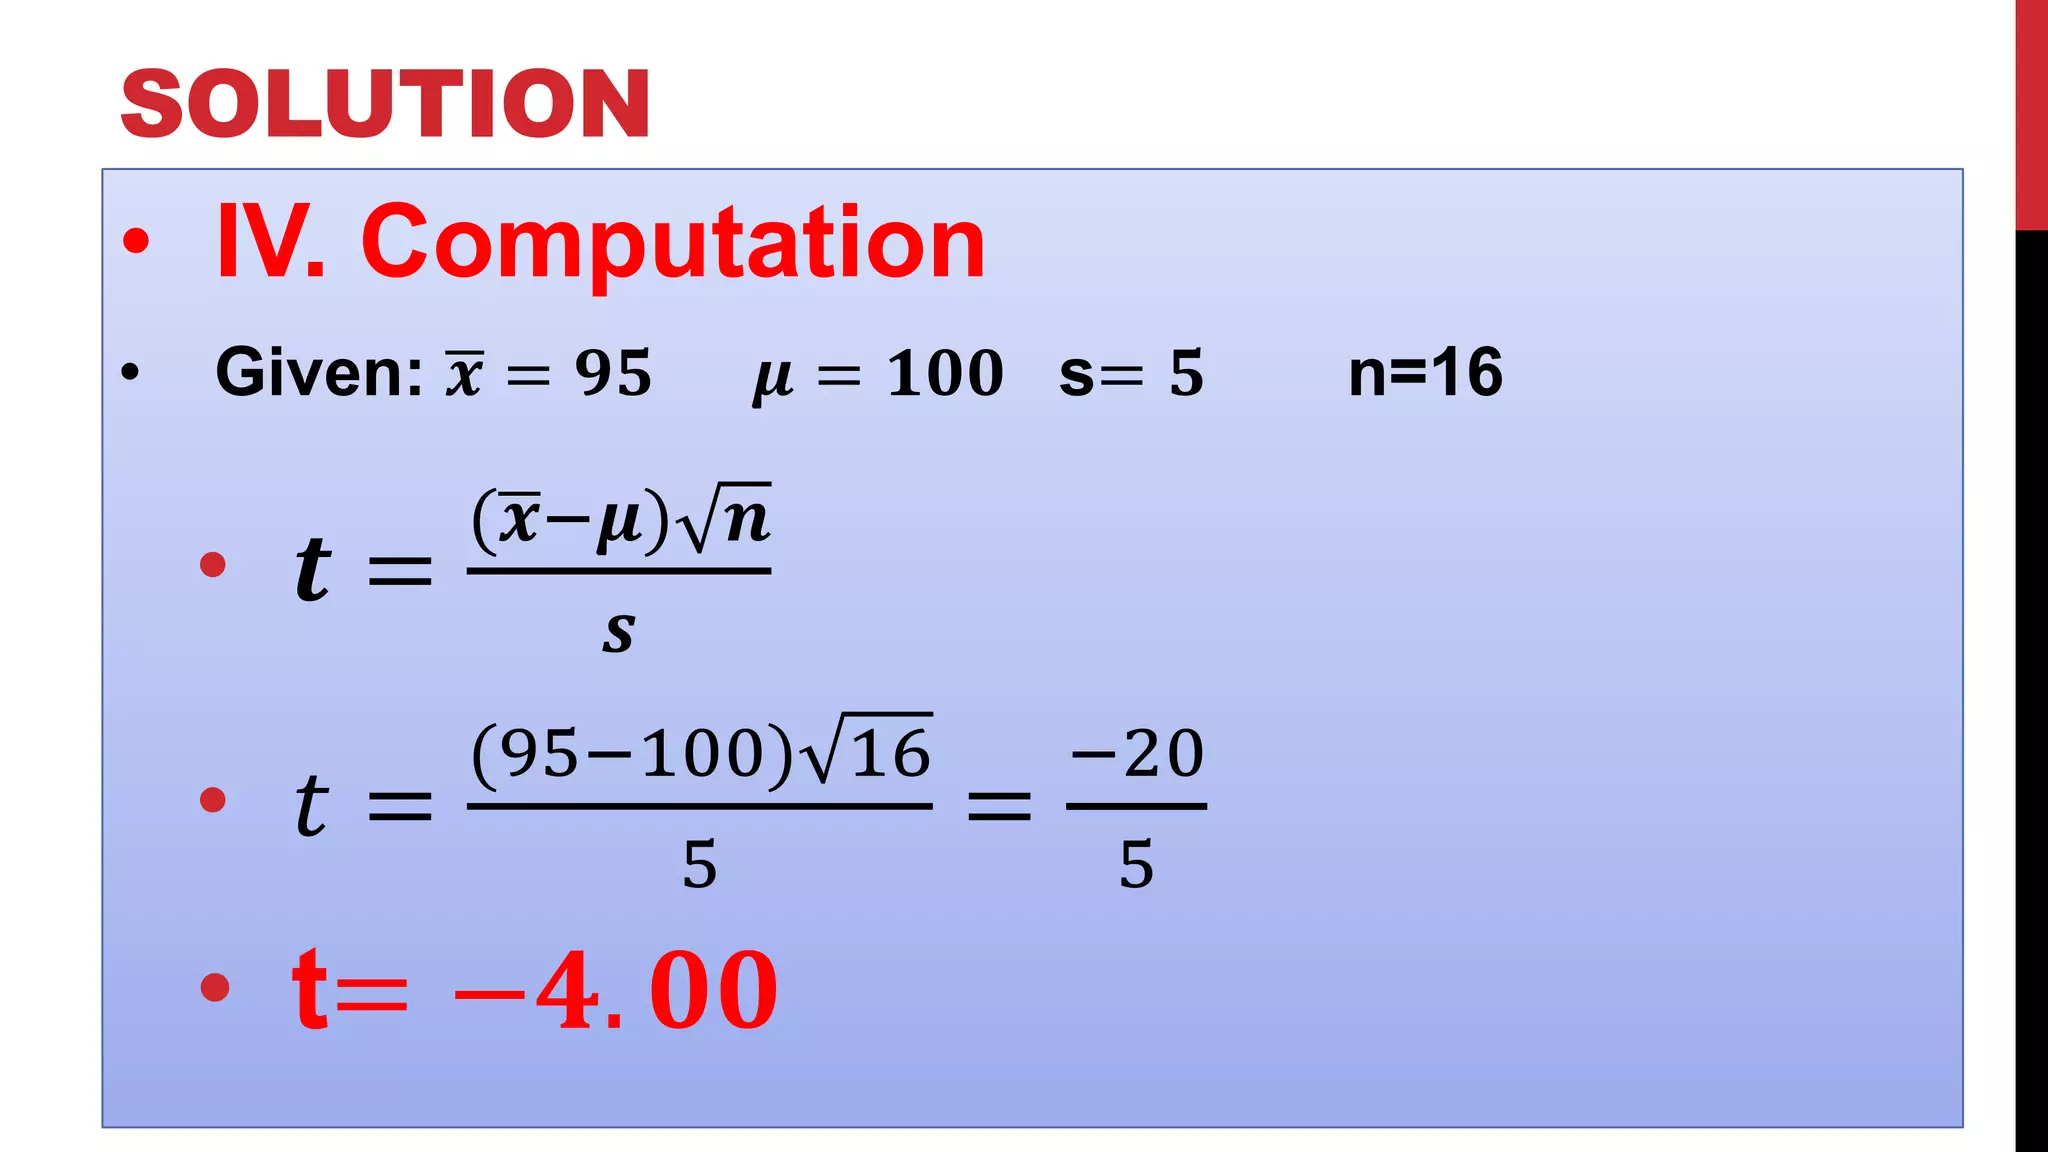
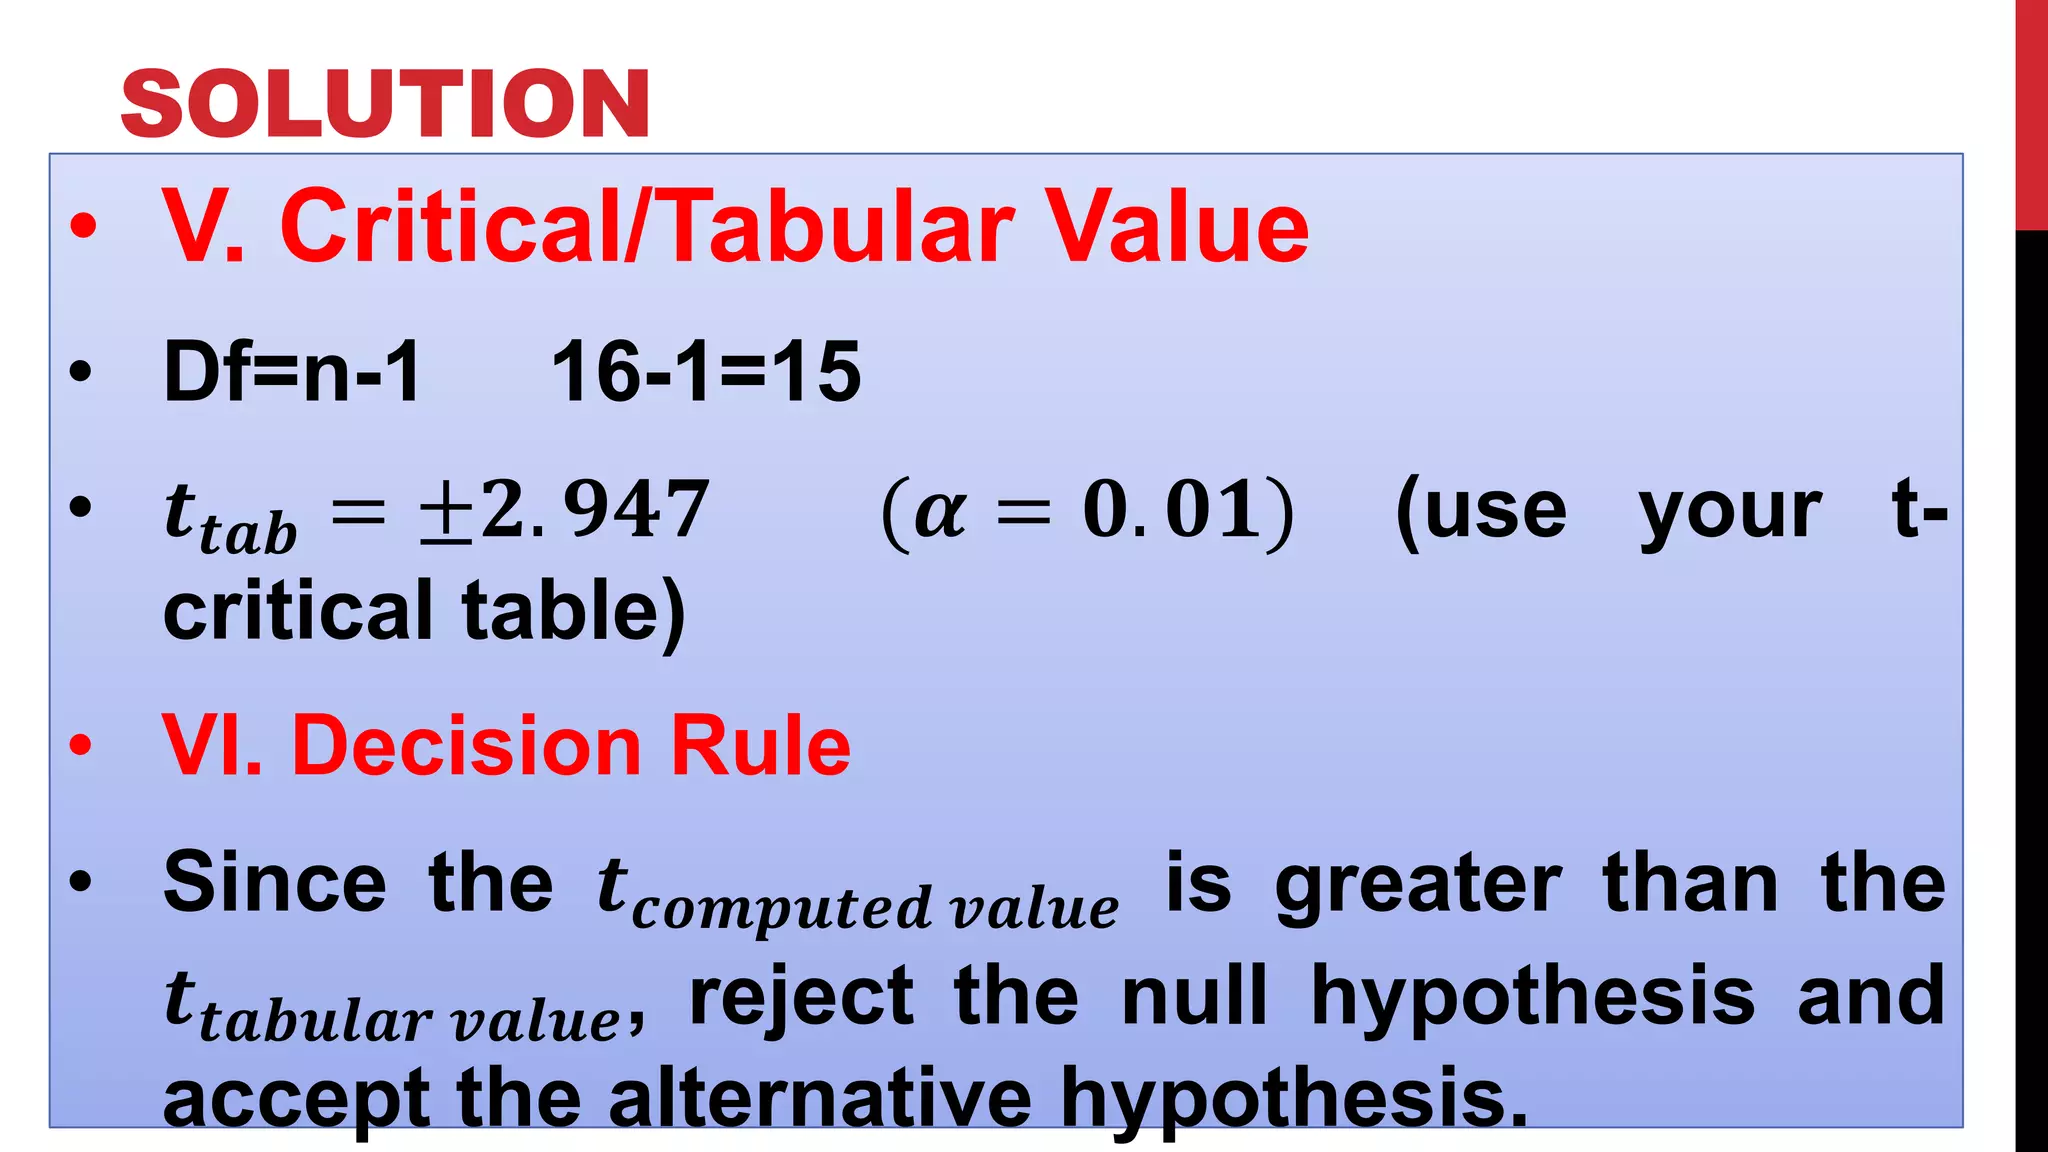
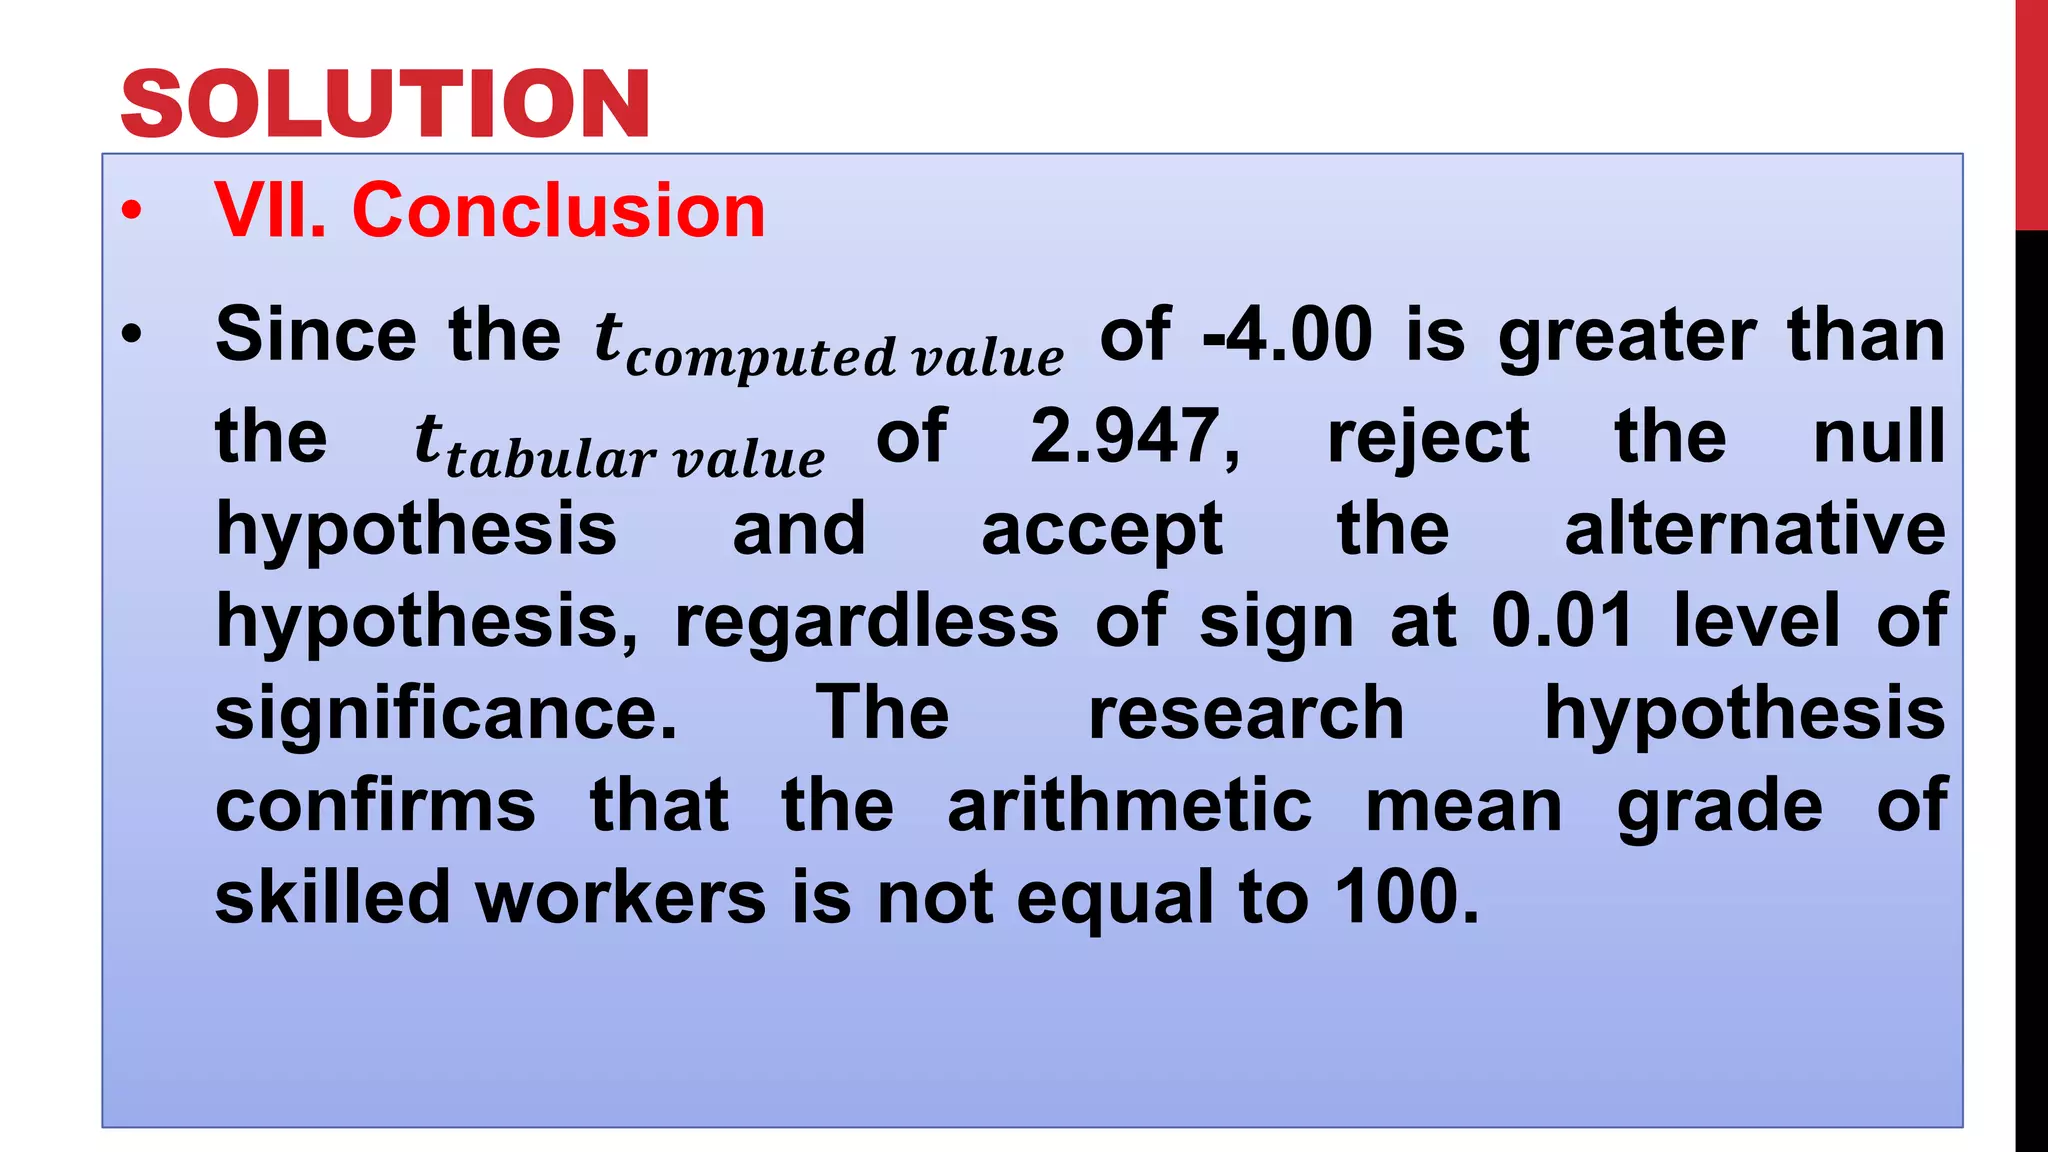
T-TEST
• It is used for testing hypothesis when the
sample standard deviation is known and
the sample size is less than 30.
• The T-test is used to compare two means
of two independent samples or two
independent groups and the means of
correlated samples before and after the
treatment.
T-TEST FOR ONE SAMPLE MEAN
• 𝒕 𝒄𝒐𝒎𝒑𝒖𝒕𝒆𝒅 =
( 𝒙−𝝁) 𝒏
𝒔
EXAMPLE OF T-TEST FOR ONE SAMPLE MEAN
• 1. The Human Resources Development of a company
developed a skilled competency test for a certain
group of skilled workers. The HRD asserted a tentative
hypothesis that the arithmetic mean grade obtained by
this group of skilled workers is 100. The test scores
were assumed to be normally distributed. The
hypothesis was subjected to a two tailed test at 0.01
level of significance. The test was given to a random
sample of 16 skilled workers and the results are
sample mean is equal to 95 and SD of 5. Is HRD’s
tentative hypothesis correct?
SOLUTION
• I. State the null and alternative hypothesis.
• A. 𝑯 𝒐 = The arithmetic mean grade obtained by
the skill workers is equal to 100.
• 𝑯 𝒐: 𝝁 = 𝟏𝟎𝟎
• B. 𝑯 𝒂 = The arithmetic mean grade obtained by
the skill workers is not equal to 100.
• 𝑯 𝒂: 𝝁 ≠ 𝟏𝟎𝟎
SOLUTION
• II. Set the level of significance.
• 𝜶 = 𝟎. 𝟎1
III. Test Statistic
T-test for One Sample Mean
SOLUTION
• IV. Computation
• Given: 𝒙 = 𝟗𝟓 𝝁 = 𝟏𝟎𝟎 s= 𝟓 n=16
• 𝒕 =
( 𝒙−𝝁) 𝒏
𝒔
• 𝑡 =
(95−100) 16
5
=
−20
5
• t= −𝟒. 𝟎𝟎
SOLUTION
• V. Critical/Tabular Value
• Df=n-1 16-1=15
• 𝒕 𝒕𝒂𝒃 = ±𝟐. 𝟗𝟒𝟕 (𝜶 = 𝟎. 𝟎𝟏) (use your t-
critical table)
• VI. Decision Rule
• Since the 𝒕 𝒄𝒐𝒎𝒑𝒖𝒕𝒆𝒅 𝒗𝒂𝒍𝒖𝒆 is greater than the
𝒕 𝒕𝒂𝒃𝒖𝒍𝒂𝒓 𝒗𝒂𝒍𝒖𝒆, reject the null hypothesis and
accept the alternative hypothesis.
SOLUTION
• VII. Conclusion
• Since the 𝒕 𝒄𝒐𝒎𝒑𝒖𝒕𝒆𝒅 𝒗𝒂𝒍𝒖𝒆 of -4.00 is greater than
the 𝒕 𝒕𝒂𝒃𝒖𝒍𝒂𝒓 𝒗𝒂𝒍𝒖𝒆 of 2.947, reject the null
hypothesis and accept the alternative
hypothesis, regardless of sign at 0.01 level of
significance. The research hypothesis
confirms that the arithmetic mean grade of
skilled workers is not equal to 100.
QUIZ 3
1. A researcher knows that the average height of
Filipino women is 1.525 meters. A random sample
of 26 women was taken and was found to have a
mean height of 1.56 meters, with standard
deviation of .10 meters. Is there reason to believe
that the sample are significantly taller than the
others at 0.05 significance level?

T test for one sample mean

  • 3.
    T-TEST • It isused for testing hypothesis when the sample standard deviation is known and the sample size is less than 30. • The T-test is used to compare two means of two independent samples or two independent groups and the means of correlated samples before and after the treatment.
  • 4.
    T-TEST FOR ONESAMPLE MEAN • 𝒕 𝒄𝒐𝒎𝒑𝒖𝒕𝒆𝒅 = ( 𝒙−𝝁) 𝒏 𝒔
  • 5.
    EXAMPLE OF T-TESTFOR ONE SAMPLE MEAN • 1. The Human Resources Development of a company developed a skilled competency test for a certain group of skilled workers. The HRD asserted a tentative hypothesis that the arithmetic mean grade obtained by this group of skilled workers is 100. The test scores were assumed to be normally distributed. The hypothesis was subjected to a two tailed test at 0.01 level of significance. The test was given to a random sample of 16 skilled workers and the results are sample mean is equal to 95 and SD of 5. Is HRD’s tentative hypothesis correct?
  • 6.
    SOLUTION • I. Statethe null and alternative hypothesis. • A. 𝑯 𝒐 = The arithmetic mean grade obtained by the skill workers is equal to 100. • 𝑯 𝒐: 𝝁 = 𝟏𝟎𝟎 • B. 𝑯 𝒂 = The arithmetic mean grade obtained by the skill workers is not equal to 100. • 𝑯 𝒂: 𝝁 ≠ 𝟏𝟎𝟎
  • 7.
    SOLUTION • II. Setthe level of significance. • 𝜶 = 𝟎. 𝟎1 III. Test Statistic T-test for One Sample Mean
  • 8.
    SOLUTION • IV. Computation •Given: 𝒙 = 𝟗𝟓 𝝁 = 𝟏𝟎𝟎 s= 𝟓 n=16 • 𝒕 = ( 𝒙−𝝁) 𝒏 𝒔 • 𝑡 = (95−100) 16 5 = −20 5 • t= −𝟒. 𝟎𝟎
  • 9.
    SOLUTION • V. Critical/TabularValue • Df=n-1 16-1=15 • 𝒕 𝒕𝒂𝒃 = ±𝟐. 𝟗𝟒𝟕 (𝜶 = 𝟎. 𝟎𝟏) (use your t- critical table) • VI. Decision Rule • Since the 𝒕 𝒄𝒐𝒎𝒑𝒖𝒕𝒆𝒅 𝒗𝒂𝒍𝒖𝒆 is greater than the 𝒕 𝒕𝒂𝒃𝒖𝒍𝒂𝒓 𝒗𝒂𝒍𝒖𝒆, reject the null hypothesis and accept the alternative hypothesis.
  • 10.
    SOLUTION • VII. Conclusion •Since the 𝒕 𝒄𝒐𝒎𝒑𝒖𝒕𝒆𝒅 𝒗𝒂𝒍𝒖𝒆 of -4.00 is greater than the 𝒕 𝒕𝒂𝒃𝒖𝒍𝒂𝒓 𝒗𝒂𝒍𝒖𝒆 of 2.947, reject the null hypothesis and accept the alternative hypothesis, regardless of sign at 0.01 level of significance. The research hypothesis confirms that the arithmetic mean grade of skilled workers is not equal to 100.
  • 11.
    QUIZ 3 1. Aresearcher knows that the average height of Filipino women is 1.525 meters. A random sample of 26 women was taken and was found to have a mean height of 1.56 meters, with standard deviation of .10 meters. Is there reason to believe that the sample are significantly taller than the others at 0.05 significance level?