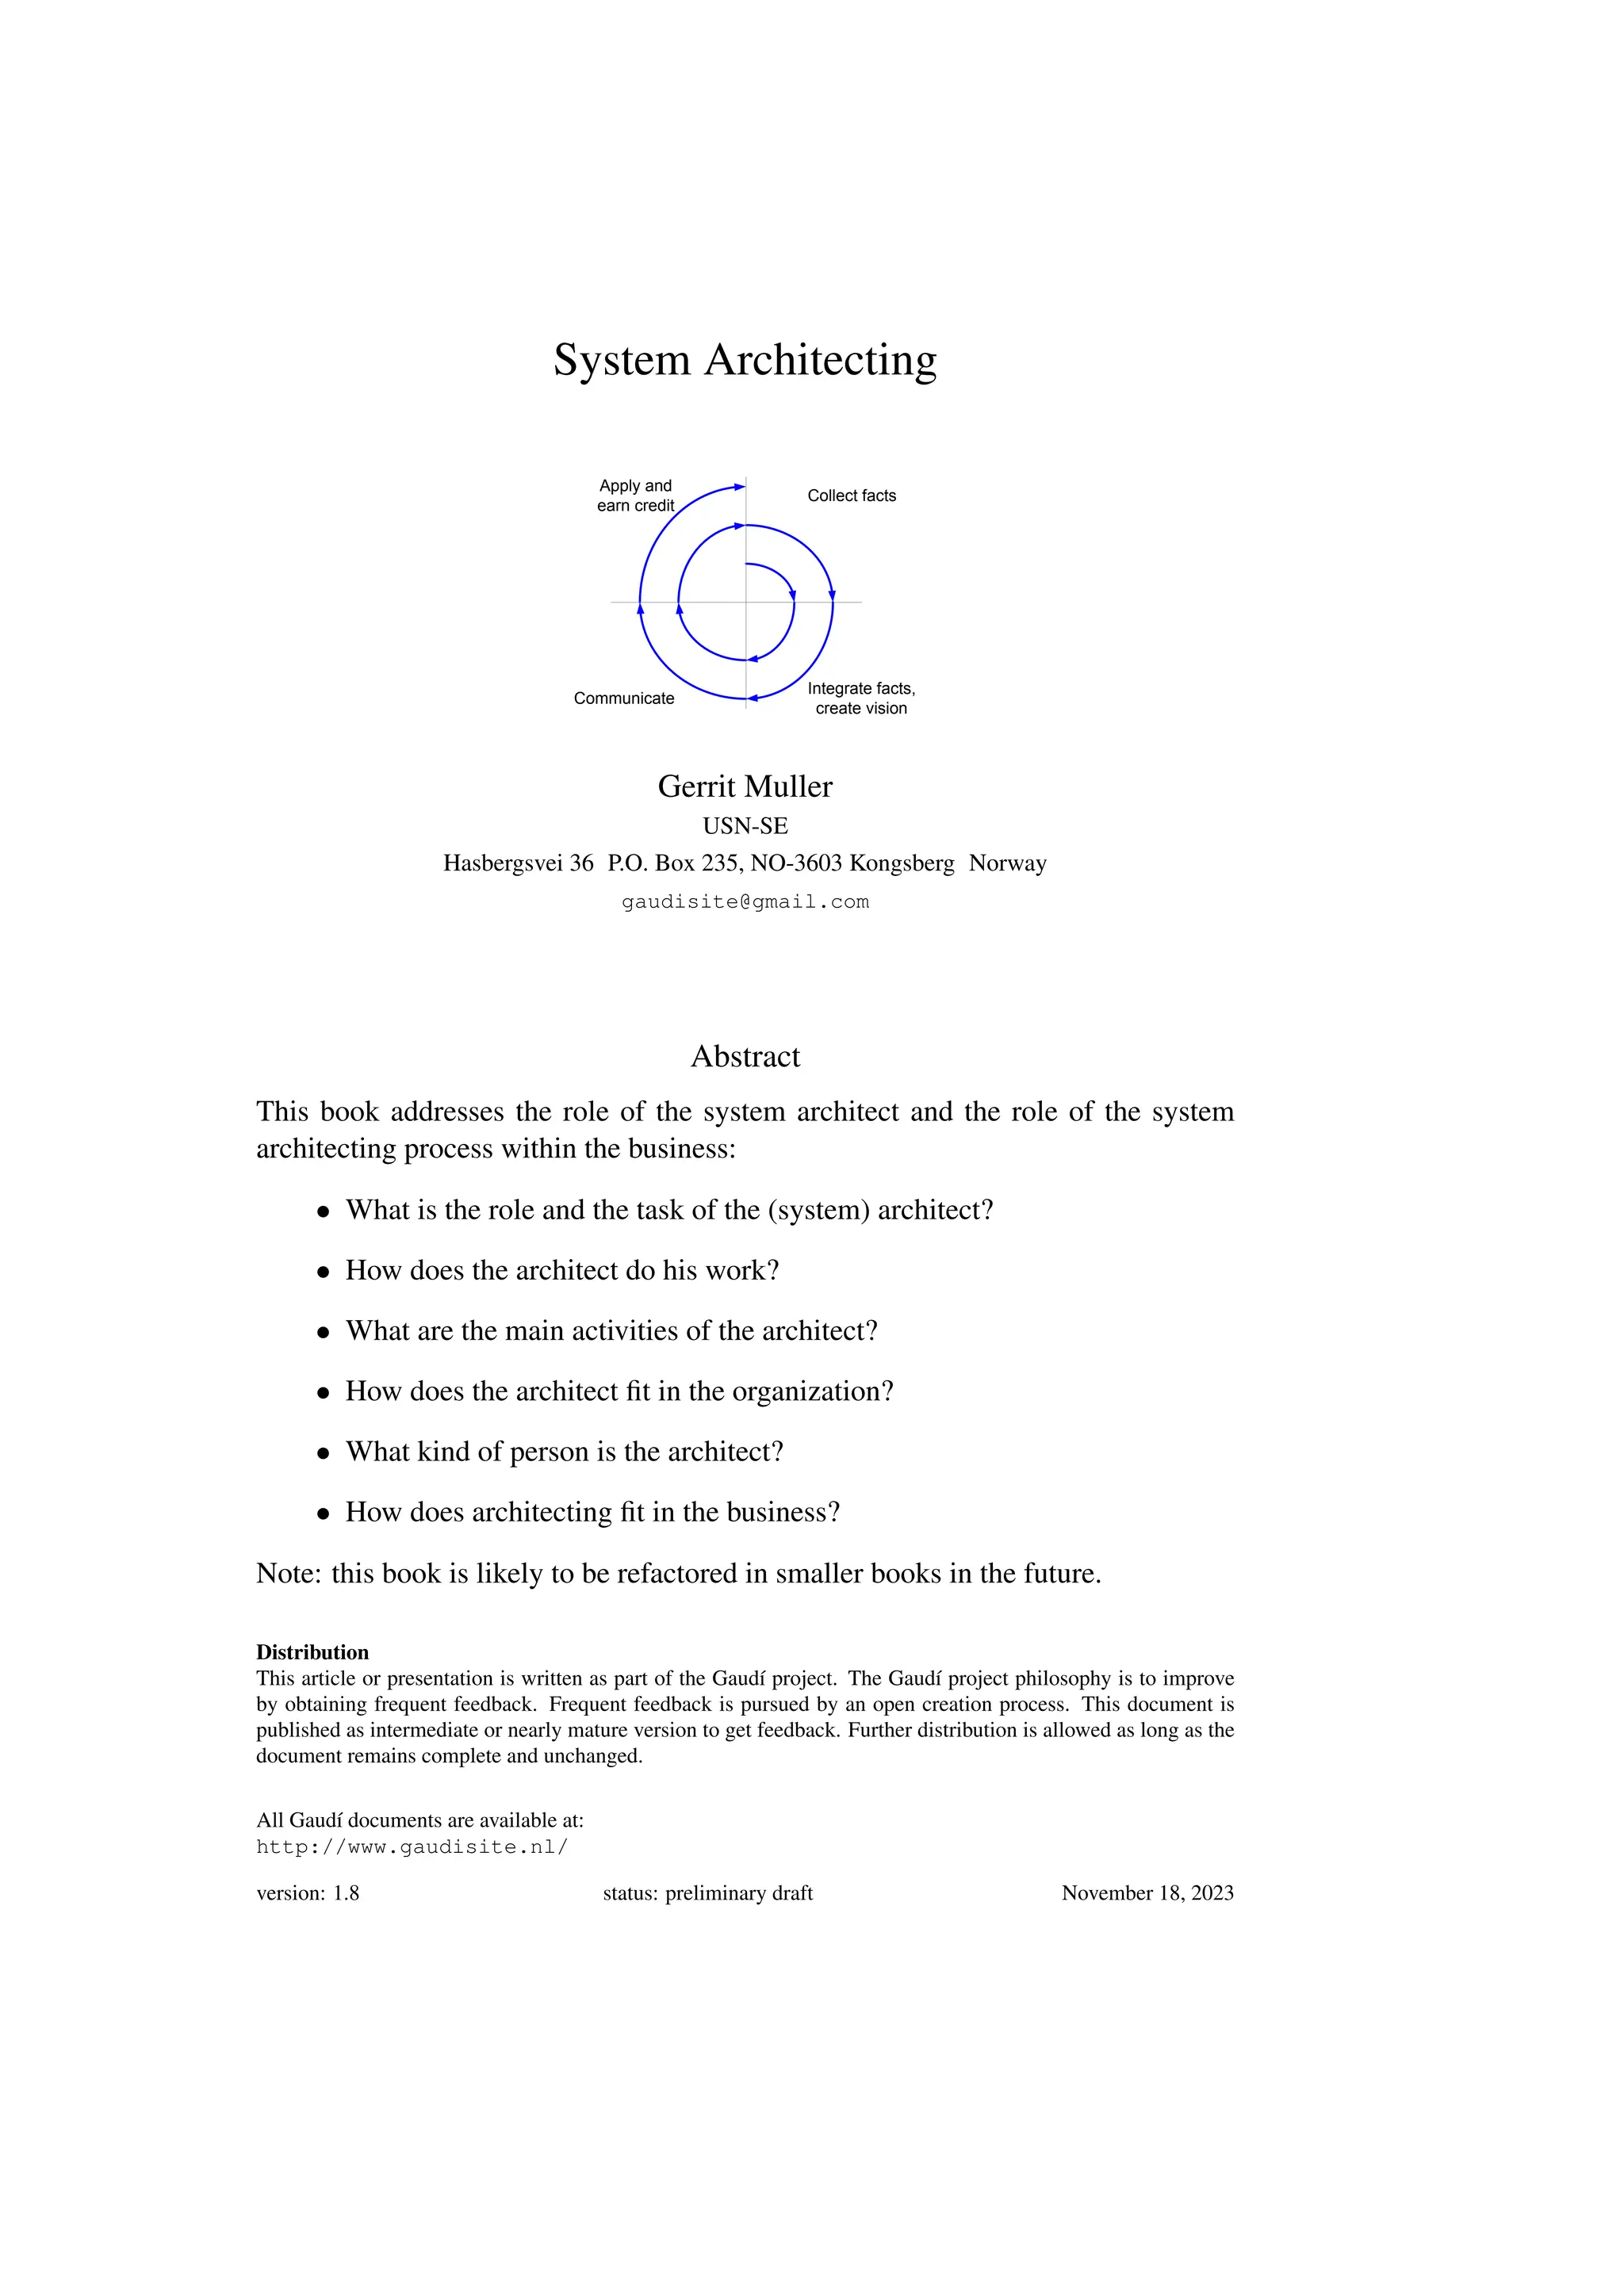
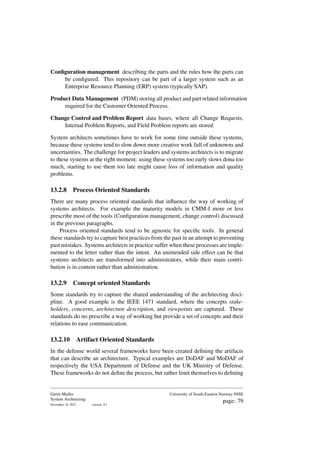
This document outlines the role and tasks of system architects within organizations, emphasizing the importance of system architecture processes in creating efficient and effective systems. It discusses the skepticism surrounding system architecture and aims to set realistic expectations while identifying critical success factors for successful implementation. The document is part of the Gaudí project, which encourages feedback to continually improve its content and structure.

![Introduction
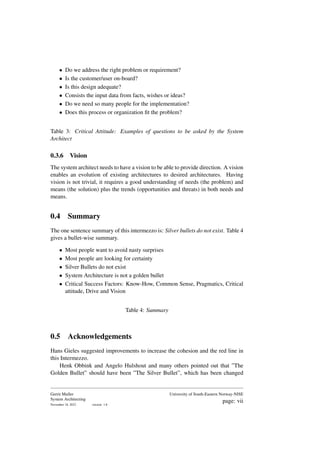
This book bundles the articles and intermezzo’s produced by the Gaudí project.
At this moment the book is in its early infancy. Most articles are updated
based on feedback from readers and students. The most up to date version of the
articles can always be found at [16]. The same information can be found here in
presentation format.
Chapters can be read as autonomous units. The sequence choosen here is more
or less top down, hopping from one viewpoint to the next. On a regular base
a sidestep ("Intermezzo") is being made, either to describe a more fundamental
notion, or to propose a more challenging point of view.
Note: this book is likely to be refactored in smaller books in the future.](https://image.slidesharecdn.com/systemarchitecturebook-250106045108-30a869df/85/SystemArchitectureBook-pdfffffffffffffffffffffffffff-2-320.jpg)
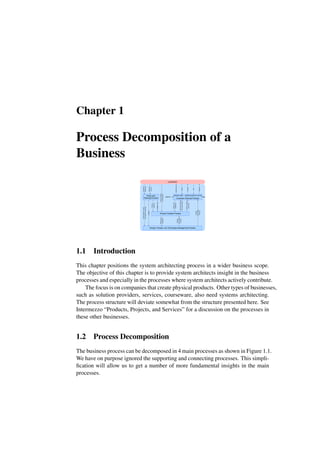
![Unfortunately System Architecting will never remove all uncertainties, see
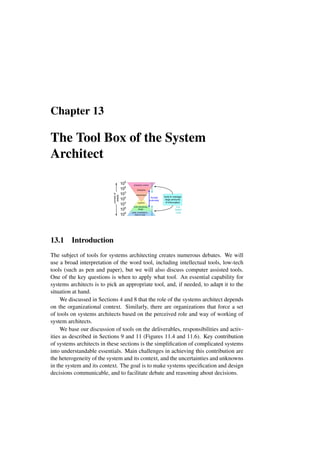
subsection 0.2.2. The application of a system architecture process can help in the
risk management, amongst others by prevention, and by minimizing impact.
Successful application of system architecture is far from trivial, section 0.3
describes how the System Architecture Process should be applied to meet the goals
of efficiency and effectively.
0.2.1 The Quest for Certainty
This section provides a caricatural view on human behavior based on a free inter-
pretation of the Maslow Hierarchy of Needs, as discussed for instance in [7]. This
exaggerated view matches with the security needs in the lower Maslow Hierarchy.
Note that less defensive behavior can be triggered by needs in the higher layers,
were words such as adventurous en explorative are being used.
The majority of people, including managers and engineers, have a need for
certainty. Their ideal is to have stable, unchangeable sets of specifications, schedules
et cetera. This (hopefully) isolates them from the nasty surprises of reality see
table 1.
• incompetent people
• human mistakes
• lack of collaboration or synergy
• misunderstanding or miscommunication
• changing markets
• fast moving competition
• unforeseen physical, chemical, mechanical properties
• mother nature (illnesses, floods)
Table 1: Nasty Surprises of Reality
Unfortunately these nasty surprises are a fact of life. Our human capability to
control these phenomena is quite limited.
Risk management can help to be more robust. However risk management
certainly does not remove these phenomena and it also does not reduce the conse-
quences to zero. Risk management balances probability, effect, and cost.
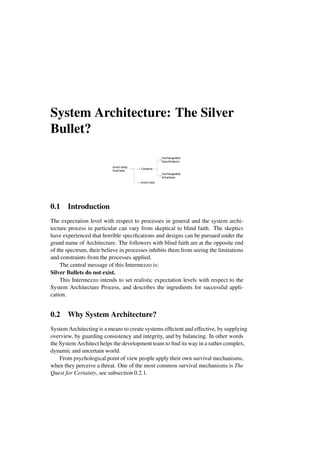
People with a need for certainty are willing to accept any method or process
which promises certainty. In other words certainty appears to be their personal key
driver. It is better to rephrase this key driver as to avoid nasty surprises, which is
closer to the internal motivation at the one hand and which gives a handle later on
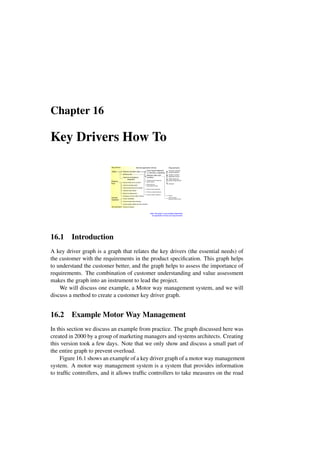
to manage the expectations. Figure 1 visualizes these drivers.
Gerrit Muller
System Architecting
November 18, 2023 version: 1.8
University of South-Eastern Norway-NISE
page: iv](https://image.slidesharecdn.com/systemarchitecturebook-250106045108-30a869df/85/SystemArchitectureBook-pdfffffffffffffffffffffffffff-4-320.jpg)


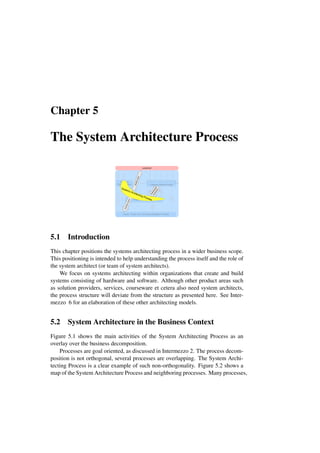
![Chapter 2
What is a Process?
principle process procedure tool
formalism
template
abstract specific and executable
drives
is
elaborated
in
is
supported
by
2.1 Introduction
We rely in this part heavily on the notion of a process. This intermezzo is defining
“process” for the context of this book. We define “process”, since this word is
heavily overloaded in our daily world. We also discuss the relationship of processes
with organizations and the drive for process improvement.
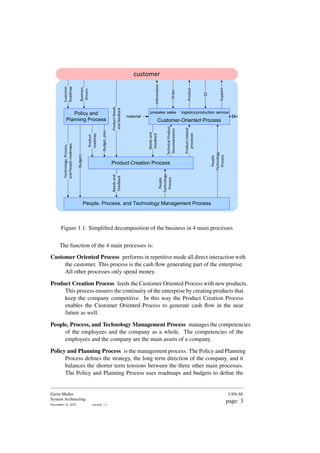
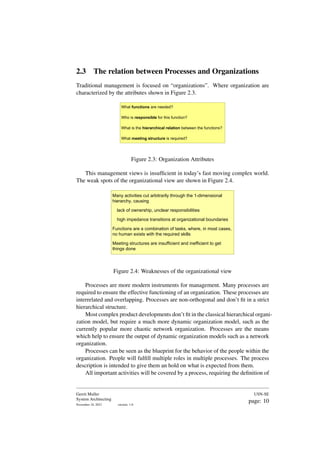
2.2 What is a process
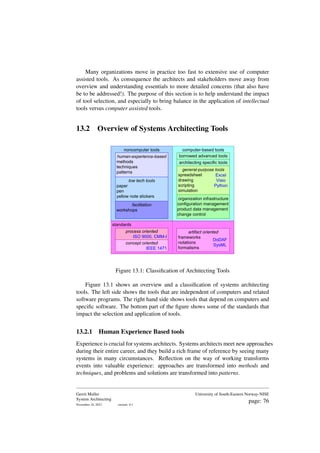
We use process as an abstracted way of working. A process can be characterized
the attributes shown in Figure 2.1
In [10] the following definition is given:
A process is an activity which takes place over time and which has a precise
aim regarding the result to be achieved. The concept of a process is hierarchical
which means that a process may consist of a partially ordered set of subprocesses.
This definition parallels the characterization above. It adds explicitly the potential
hierarchical decomposition of the process itself.
The notion of a process can be seen as one step in an abstraction hierarchy,
as shown in 2.2. The most abstract notion in this hierarchy is the “principle”. A
principle is a generic insight that can be used for many different purposes. An
example of a principle is decomposition: Whenever we have something big, e.g.](https://image.slidesharecdn.com/systemarchitecturebook-250106045108-30a869df/85/SystemArchitectureBook-pdfffffffffffffffffffffffffff-16-320.jpg)
![ownership, relation with other processes et cetera. The allocation of roles to people
is much more dynamic than in conventional hierarchies. More dynamic allocation
enables a better match between personal capabilities and required skills. In practice
dynamic allocation leads to more distribution of responsibilities, making it more
feasible to match capabilities and skills.
The 80/20 rule is also valid for processes: 80% of the behavior is covered
by the processes, while 20% requires independent creative behavior. An organi-
zation without processes drowns in chaos, while an organization which blindly
implements them will be killed by its own inertia, its inability to adapt to the fast
changing world.
For reasons of continuity and stability an hierarchical organization will remain.
The slowest evolving dimension is mostly used as a basis for this hierarchy. This
hierarchy functions as anchor point for people in the continuously changing process
world, but should play only a minor role in the entire operation.
The Centurion turn around operation within Philips, orchestrated by CEO Jan
Timmer in the early nineties, urged the Philips managers and employees to change
from an introvert organization point of view to an external result oriented process
point of view.
2.4 Process Improvement
Urged by competitive pressure organizations look for ways to improve their efficiency.
Many opportunities for improvement have a strong process component.
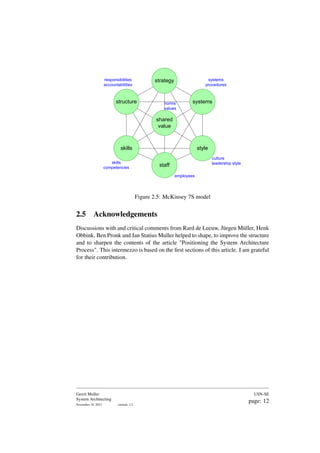
The 7S model by McKinsey gives a practical way to improve an organization
in a balanced way. The message behind this model is that at least 7 views must be
balanced when changing an organization. See Figure 2.5 for the 7 views.
The most common pitfall in improvement programs is the over-emphasis on the
process component, or worse the isolation of the process improvement. Organiza-
tions assessing their maturity level, for instance by Maturity Models [22], quite
often get too much process focus. The Process Improvement Officer1 is focused
on process issues only. Hence where the process view is introduced as an extrovert
result oriented approach, it suddenly turns into an introvert improvement program,
where business goals and drivers are unknown.
This is a quite sad situation: The opportunities for improvement are ample with
a strong process component, however due to the wrong focus a negative effect is
obtained (such as rigid procedures).
Recommendation: Process improvements should originate from the directly
involved people, for instance project leaders, engineers, architects et cetera. Invite
participation by this group in such a way that they feel the ownership.
1
The existence of this function in itself is quite dangerous, it invites the unbalanced isolated
"improvement" behavior
Gerrit Muller
System Architecting
November 18, 2023 version: 2.2
USN-SE
page: 11](https://image.slidesharecdn.com/systemarchitecturebook-250106045108-30a869df/85/SystemArchitectureBook-pdfffffffffffffffffffffffffff-19-320.jpg)
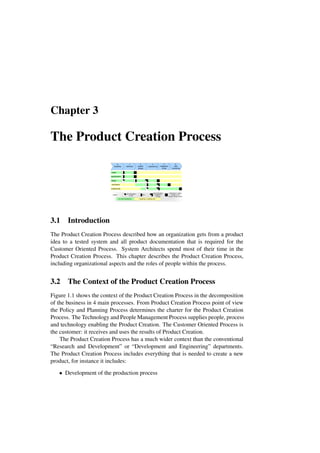
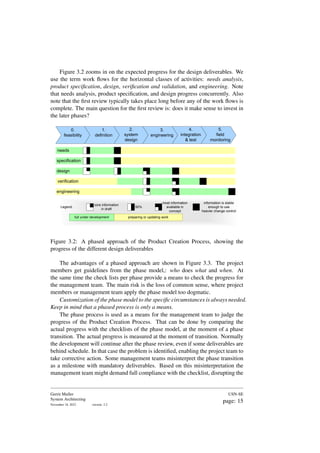
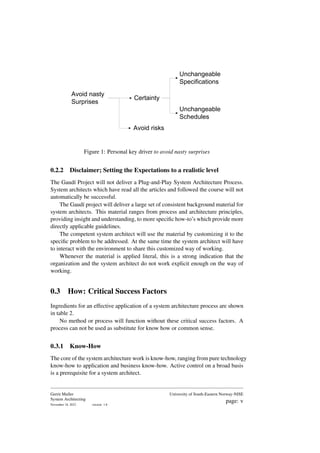
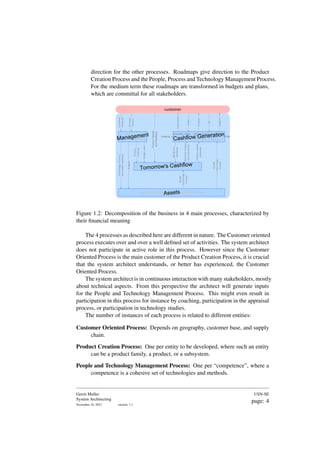
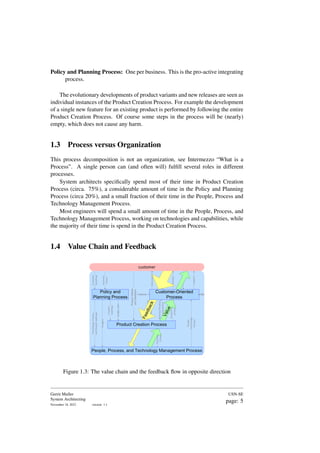
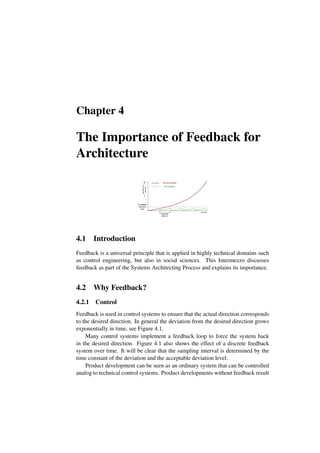
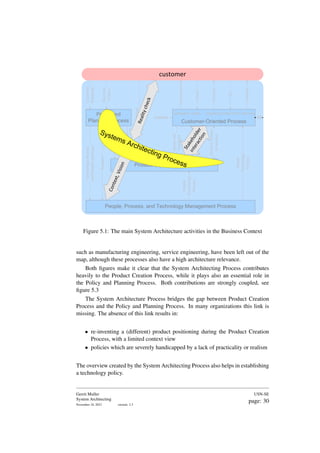
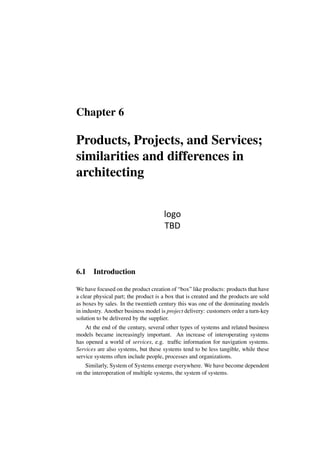
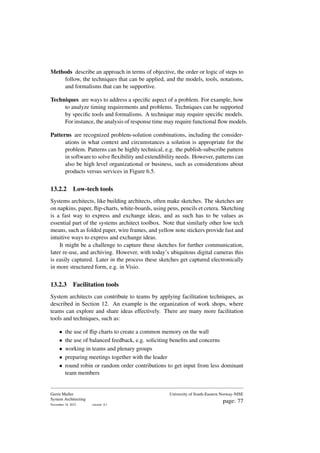
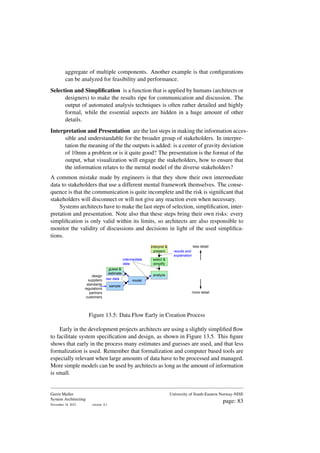
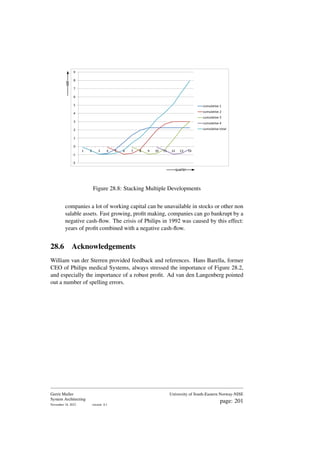
![3.4 Evolutionary models for Product Creation
The phase model stresses and supports concurrent activities, see also [8]. A common
pitfall is a waterfall interpretation of a phased approach. Following a strict top-
down approach can be a very costly mistake, because feedback from implemen-
tation and customers is in that case too late in the process. Early and continuous
feedback both from implementation as from customer point of view is essential,
see Intermezzo 4.
requirements
specification
design
build
test and
evaluate
cycle time
2% of budget (EVO)
2 weeks (XP)
up to 2 months
alternative models
RUP (Rational Unified Process)
Open Source
SCRUM
needs
specification
system
design
subsystem
design
component
design
component realization
component
test
subsystem
test
system
test
verification
validation
V-Model Incremental or Evolutionary
Figure 3.5: V-model versus Incremental or Evolutionary development models
High market dynamics exposes one weakness of the phased approach: market
and user feedback becomes available at the end of the creation process. This is a
significant problem, because most product creations suffer from large uncertainties
in the specifications. Discovering at the end that the specifications are based on
wrong assumptions is very costly.
Figure 3.5 show the V-model and evolutionary model side by side. Evolu-
tionary methods focus on early feedback creation. EVO [6] by Gilb recommends
to use evolutionary development steps of 2% of the total development budget.
In every step some product feedback must be generated. Extreme Programming
(XP) [2] by Beck is based on fixed duration cycles of two weeks. XP requires
additional customer value in every increment.
The class of agile product creation approaches is struggling with the archi-
tecting process. The leaders of these communities dislike the “big design up-front”.
However, running in a treadmill of small increments may cause the loss of the “big
picture”. Architecting and short cycles, however, are not in conflict. The archi-
tecture also has to grow in incremental steps.
Gerrit Muller
System Architecting
November 18, 2023 version: 2.2
USN-SE
page: 17](https://image.slidesharecdn.com/systemarchitecturebook-250106045108-30a869df/85/SystemArchitectureBook-pdfffffffffffffffffffffffffff-25-320.jpg)

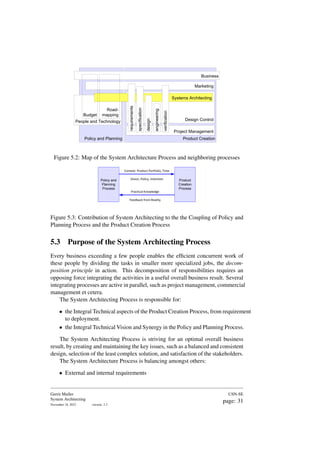

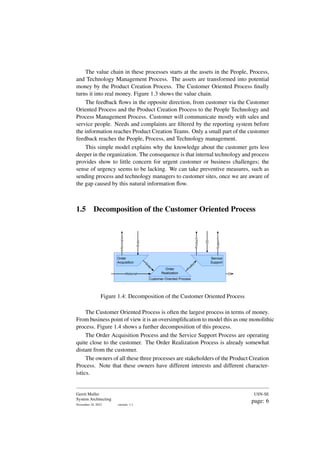
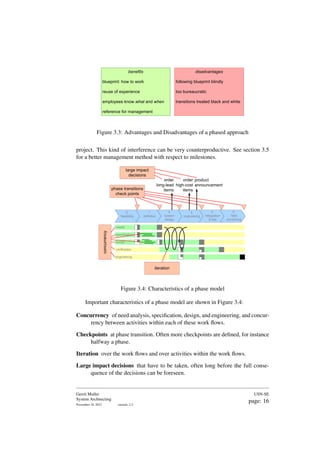
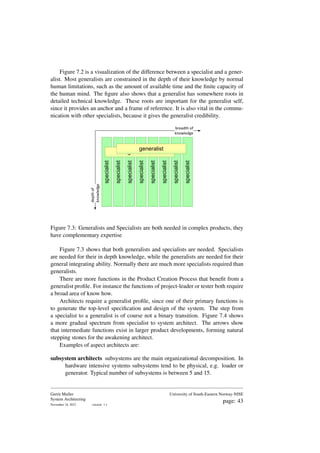
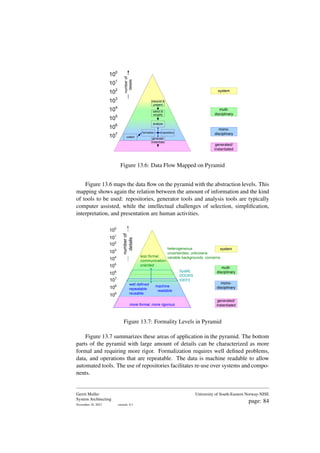
![Chapter 7
The Awakening of a System
Architect
root
technical
knowledge
generalist
technical
knowledge
business,
application insight
process insight
psychosocial
skills
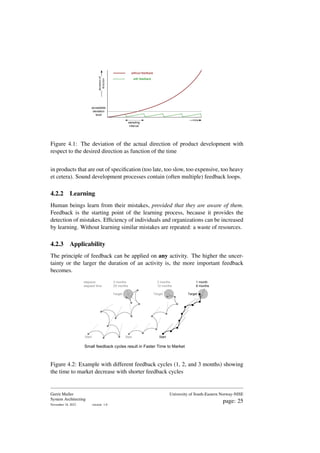
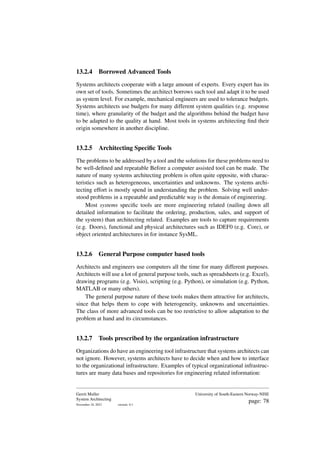
7.1 Introduction
System architects are very rare commodity. This chapter describes the observed
general growth pattern of system architects. We hope that by analysis of the
the characteristics of existing system architects will facilitate the training of new
system architects. Reference [21] contains a good description of a system architect.
7.2 The Development of a System Architect
root
technical
knowledge
generalist
technical
knowledge
business,
application insight
process insight
psychosocial
skills
Figure 7.1: Typical Development of a System Architect
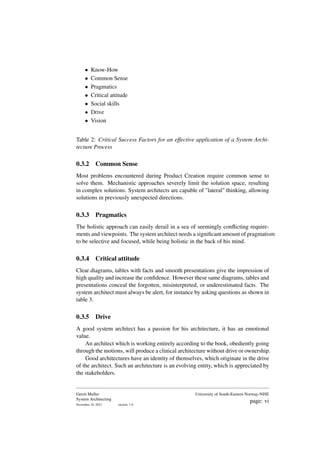
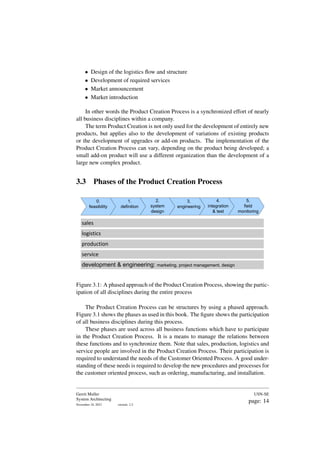
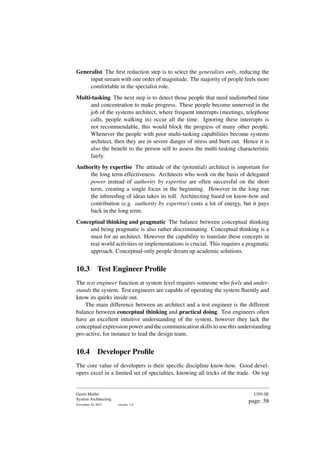
System architects need a wide range of knowledge, skills and experience to be
effective. Figure 7.1 shows a typical development of a system architect.
The system architect is rooted in technology. A thorough understanding of
a single technological subject is an essential underpinning. The next step is a](https://image.slidesharecdn.com/systemarchitecturebook-250106045108-30a869df/85/SystemArchitectureBook-pdfffffffffffffffffffffffffff-49-320.jpg)
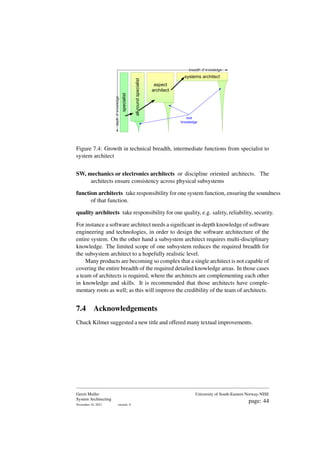
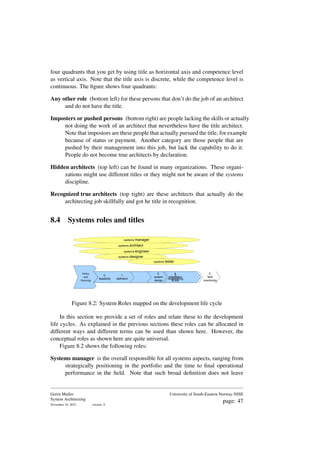
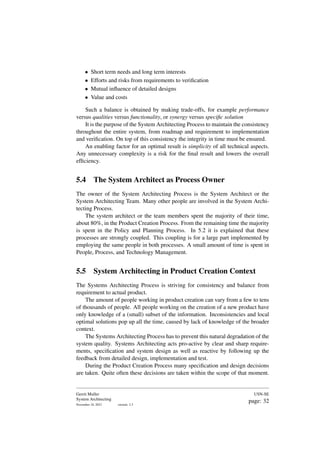
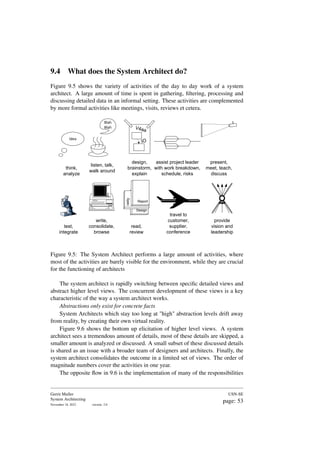
![Chapter 9
The Role and Task of the System
Architect
V4aa
IO
design,
brainstorm,
explain
Idea
think,
analyze
listen, talk,
walk around
Blah
Blah
write,
consolidate,
browse
present,
meet, teach,
discuss
read,
review
Design
Spec
Report
test,
integrate
assist project leader
with work breakdown,
schedule, risks
travel to
customer,
supplier,
conference
provide
vision and
leadership
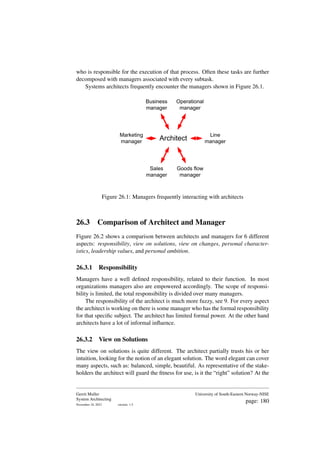
9.1 Introduction
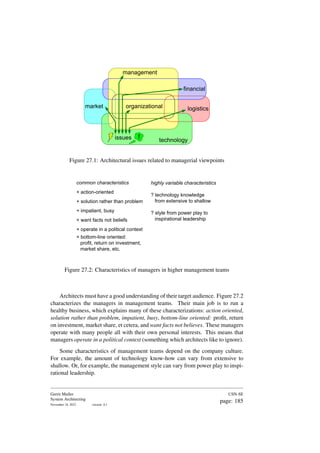
Architects and organizations are often struggling with the role of the system architect
(or software architect or any other kind of architect). This struggle is partially
caused by the intangible nature of the responsibilities of the architect. At the other
hand (good) architects are highly appreciated, even if their quantifiable output is
low.
This article starts with specific deliverables, then discusses the more abstract
responsibilities and, finally, discusses the day to day activities of an architect.
The role of the software architect is nicely discussed in [3].
9.2 Deliverables of the System Architect
We start at looking for the tangible output that is expected from architects. Project
leaders and program managers do expect deliverables to be finished at appro-
priate milestones. Most Product Creation Processes define the deliverables of a
System Architect to be artifacts such as documents or models. These artifacts are
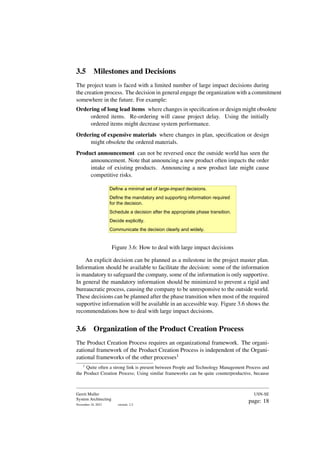
symbolized by the stack in Figure 9.1.](https://image.slidesharecdn.com/systemarchitecturebook-250106045108-30a869df/85/SystemArchitectureBook-pdfffffffffffffffffffffffffff-57-320.jpg)
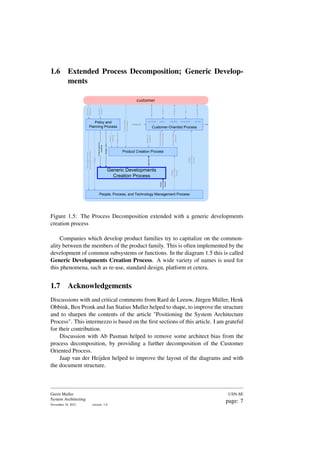
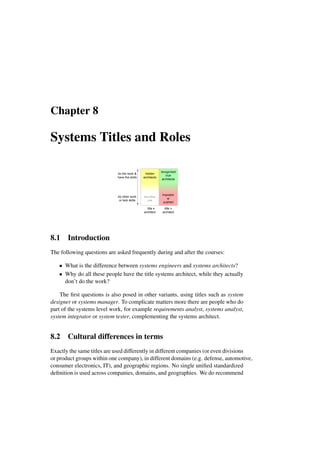
![system
subsystem
Balance Consistency
module
Overview
Requirement
Spec
Design
Realization
Decomposition
Integration
modules
Function
Q
u
a
l
i
t
y
KISS
Elegance
Simple Integrity Fitting
satisfied
stakeholders
system
context
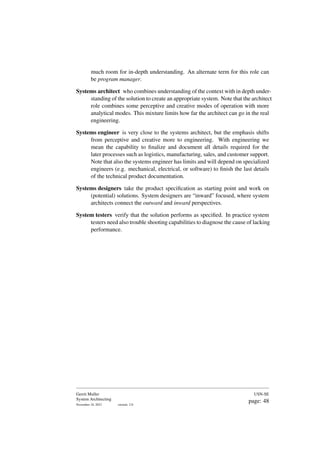
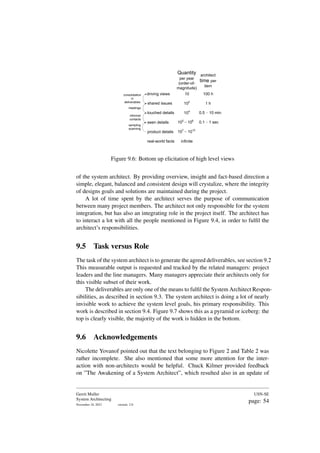
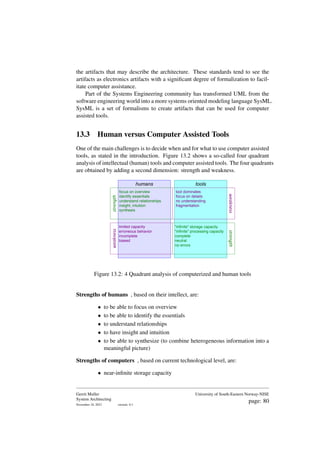
Figure 9.3: The primary responsibilities of the system architect are not tangible
and easily measurable
Decomposition, Integration Decomposition is the standard answer in dealing with
complex and big problems. Decomposing Systems in subsystems, subsystems
in modules et cetera is a major responsibility of the architect. In most
systems many decomposition dimensions are required: physical, logical,
functional, and many more, see [18]. The complementary action of decom-
position, however, is integration. The integral functioning and performance
of the system is the ultimate goal of product creation, which emphasizes
the importance of integration. In practice integration is much more difficult
than decomposition, in fact the architect must decompose in such a way that
integration is feasible.
Overview of the entire system and its context helps to make sensible specification
and design decisions. The architect should provide overview to all members
of the product creation team. Most of these members have a very limited
horizon. The architect should help them by providing proper context infor-
mation to make local design decisions.
Elegance, Simplicity are properties of a “good” architecture. The dangerous aspect
of this responsibility is the highly subjective nature of elegance and simplicity.
The appreciation of simplicity and elegance should be assessed or acknowl-
edged by others than the architect.
Integrity of the system specification and design over time. The focus of a devel-
opment team is often wandering over time, sometimes it depends on the
Gerrit Muller
System Architecting
November 18, 2023 version: 2.0
USN-SE
page: 51](https://image.slidesharecdn.com/systemarchitecturebook-250106045108-30a869df/85/SystemArchitectureBook-pdfffffffffffffffffffffffffff-59-320.jpg)
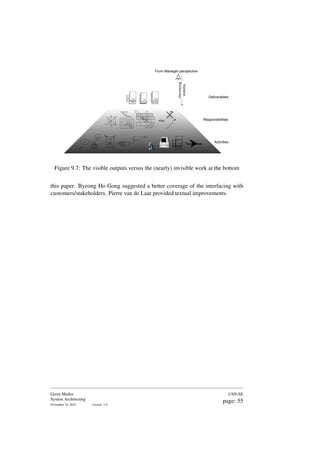
![Chapter 10
Function Profiles; The Sheep with
Seven Legs
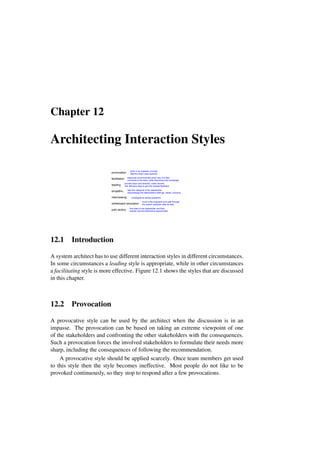
communication
teamwork
documentation
multitasking
flexible,
open
authority
by
expertise
specialist
generalist
conceptual
pragmatic
constructive
critical
fast
absorption
of
knowledge
creativity
manual
skills
process
insight
political
insight
improvement
completeness
customer
value
sales
features
commercial
insight
coaching
selection
appraisal
motivation
1
2
3
4
5
6
7
8
9
1
2
3
4
5
6
7
8
9
decision
making
monitor
progress
schedule
initial
cost
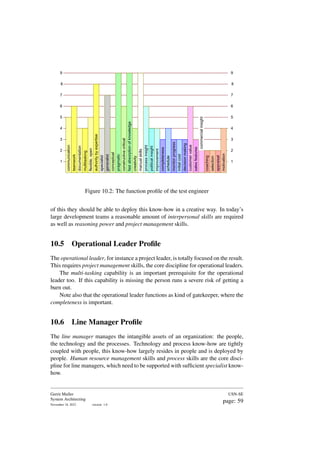
10.1 Introduction
Many human resource and line managers struggle with the questions:
• What people have the potential to become good system architects?
• How to select (potential) system architects?
Employees thinking about their careers might similarly wonder if they have the
capabilities to become a good systems architect.
We list a number of characteristics of individual humans. We map the these
characteristics on different jobs, such as system architect, developer, and line manager,
indicating the relative importance of this characteristic for that job. We first discuss
the different jobs and their typical characteristics in 10.2 to 10.7. Then we elaborate
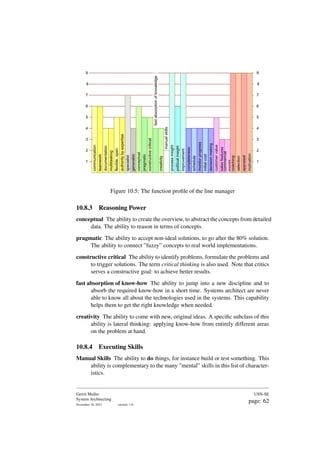
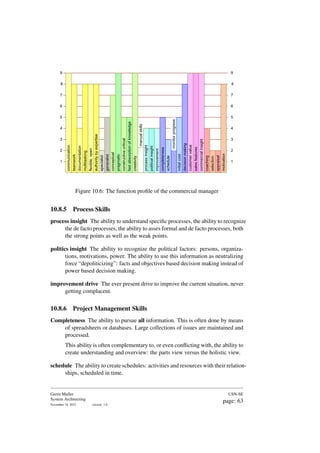
the characteristics in 10.8.
The attention for this subject is increasing. Recent research is being carried out
by Keith Frampton, see amongst others [5].](https://image.slidesharecdn.com/systemarchitecturebook-250106045108-30a869df/85/SystemArchitectureBook-pdfffffffffffffffffffffffffff-64-320.jpg)


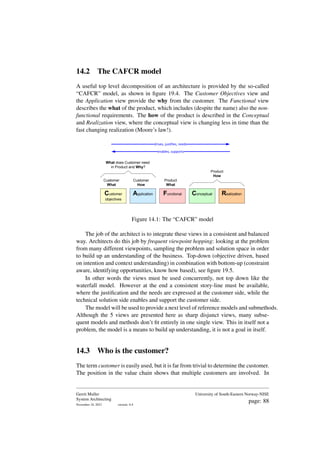
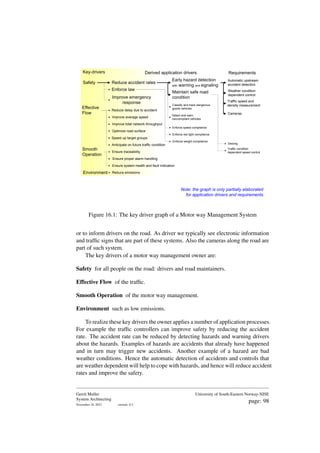
![Chapter 14
Short introduction to basic
“CAFCR” model
Customer
What
Customer
How
Product
What
Product
How
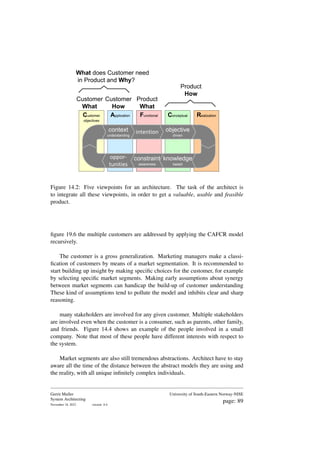
What does Customer need
in Product and Why?
drives, justifies, needs
enables, supports
Customer
objectives
Application Functional Conceptual Realization
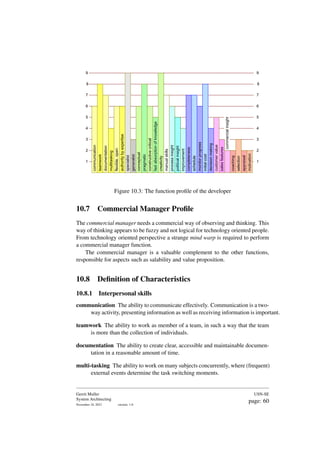
14.1 Introduction
A simple reference model is used to enable the understanding of the inside of a
system in relation to its context.
An early tutorial[20] of this model used the concatenation of the first letters
of the views in this model to form the acronym “CAFCR” (Customer Objectives,
Application, Functional, Conceptual, Realization). This acronym is used so often
within the company, that changing the acronym has become impossible. We keep
the name constant, despite the fact that better names for some of the views have
been proposed. The weakest name of the views is Functional, because this view
also contains the so-called non functional requirements. A better name for this
view is the Black-Box view, expressing the fact that the system is described from
outside, without assumptions about the internals.
The model has been used effectively in a wide variety of applications, ranging
from motor way management systems to component models for audio/video streaming.
The model is not a silver bullet and should be applied only if it helps the design
team.](https://image.slidesharecdn.com/systemarchitecturebook-250106045108-30a869df/85/SystemArchitectureBook-pdfffffffffffffffffffffffffff-95-320.jpg)
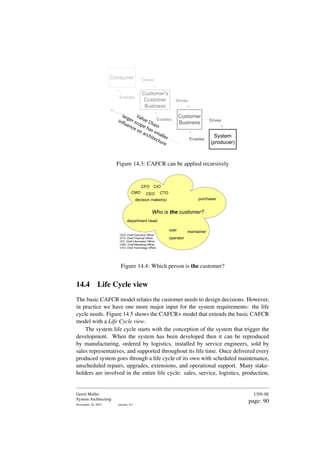
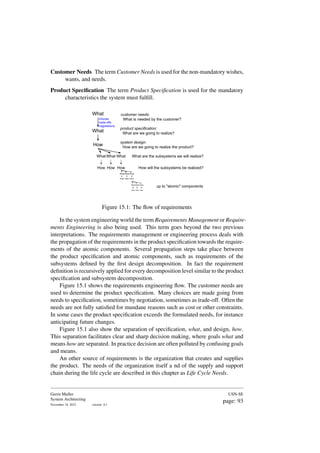
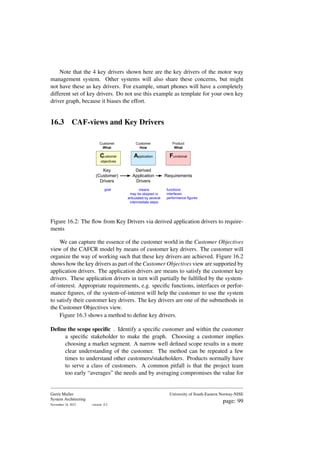

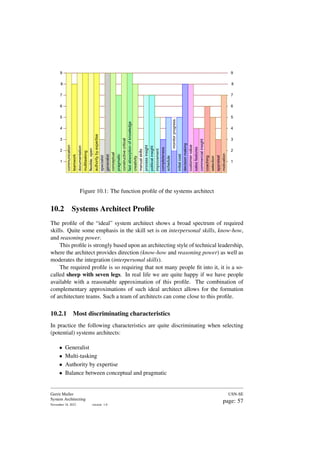
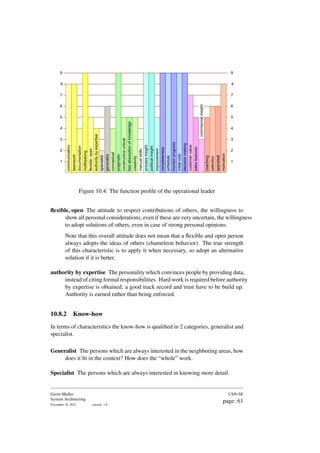
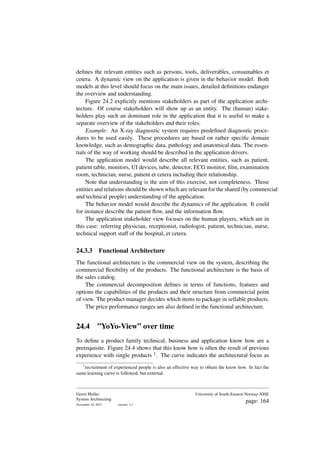
![documenting the characterization of needs. The timing insights can be documented
in a phased plan for requirements.
important urgent
effort
value
do
don't discuss
discuss
do
don't discuss
discuss
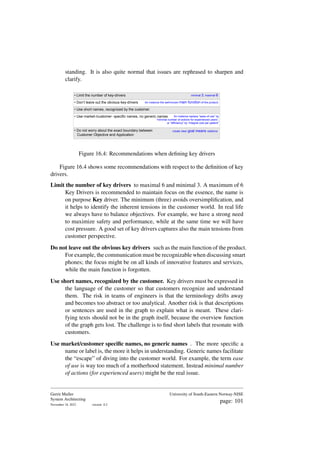
Figure 17.3: Simple methods for a first selection
The amount of needs can be so large that it is beneficial to quickly filter out
the“obvious” requirements. For some needs it is immediately obvious that they
have to be fulfilled anyway, while other needs can be delayed without any problem.
Figure 17.3 shows a number of qualitative characterizations of needs, visualized in
a two-dimensional matrix. For every quadrant in the matrix a conclusion is given,
a need must be included in the specification, a need has to be discarded or the need
must be discussed further.
This simple qualitative approach can, for instance, be done with the following
criteria:
• importance versus urgency
• customer value versus effort
In the final selection step a more detailed analysis step is preferable, because
this improves the understanding of the needs and results in a less changes during
the development.
A possible way to do this more detailed analysis is to “quantify” the character-
istics for every requirement for the most business relevant aspects, see for examples
Figure 24.10.
These quantifications can be given for the immediate future, but also for the
somewhat remote future. In that way insight is obtained in the trend, while this
information is also very useful for a discussion on the timing of the different
requirements. In [4] a much more elaborated method for requirement evaluation
and selection is described.
The output of the requirement characterization and the proposed phasing can
be used as input for the next update cycle of the roadmap.
Gerrit Muller
System Architecting
November 18, 2023 version: 0
University of South-Eastern Norway-NISE
page: 106](https://image.slidesharecdn.com/systemarchitecturebook-250106045108-30a869df/85/SystemArchitectureBook-pdfffffffffffffffffffffffffff-114-320.jpg)
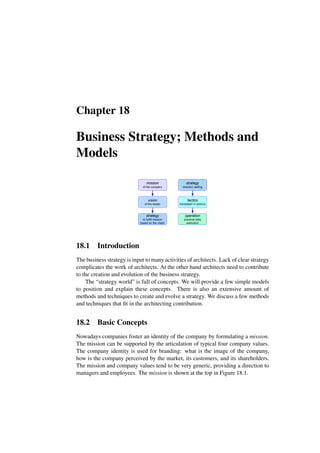
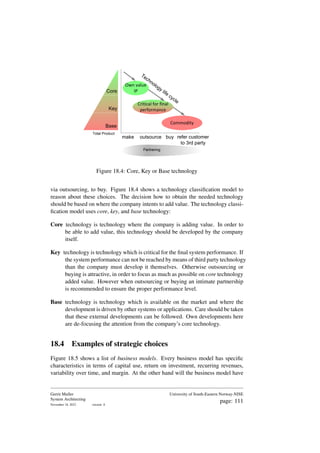
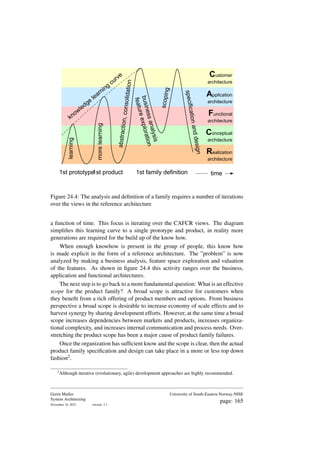
![strategy
process
supplying business
v
a
l
u
e
people, process and technology
long term
know how
(soft) assets
f
e
e
d
b
a
c
k
product creation
customer oriented
customer
short term;
cashflow!
mid term;
cashflow
next year!
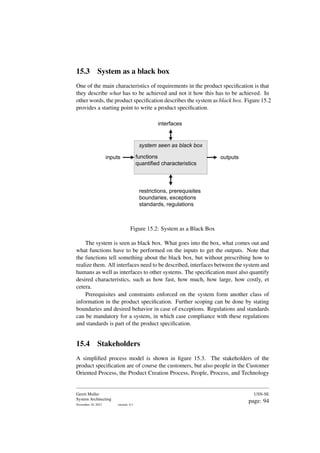
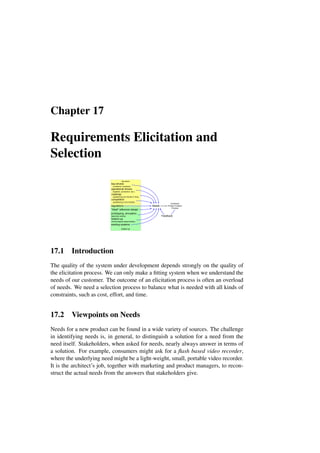
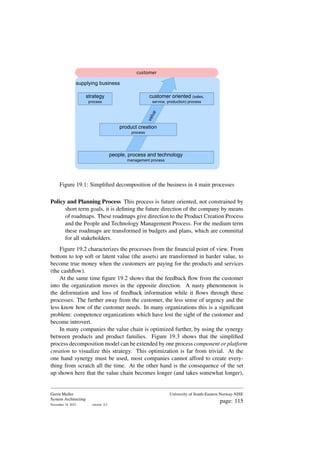
Figure 19.2: Tension between processes
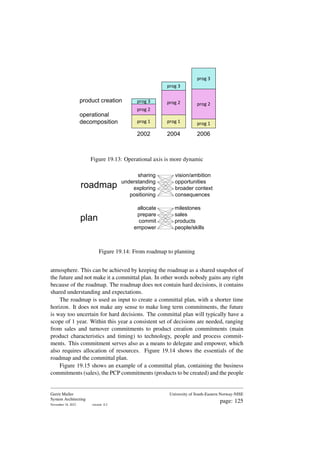
while the feedback deformation and loss increases even further! A more elaborated
discussion on these aspects can be found in [13].
Gerrit Muller
System Architecting
November 18, 2023 version: 0.2
University of South-Eastern Norway-NISE
page: 116](https://image.slidesharecdn.com/systemarchitecturebook-250106045108-30a869df/85/SystemArchitectureBook-pdfffffffffffffffffffffffffff-124-320.jpg)
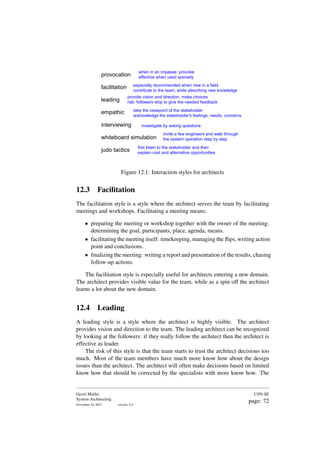
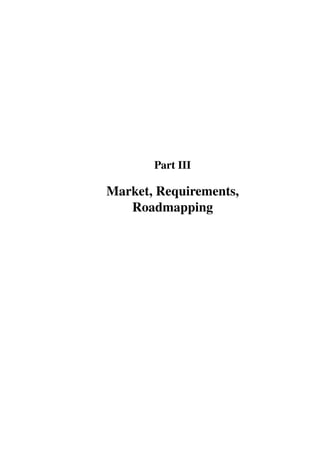
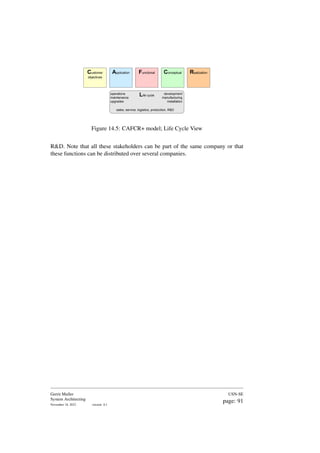
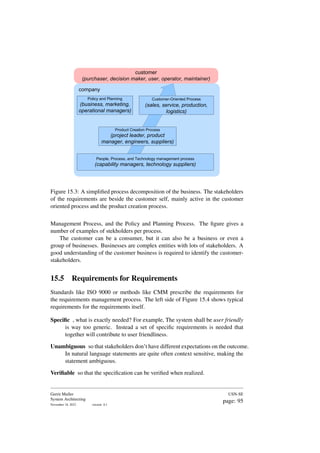
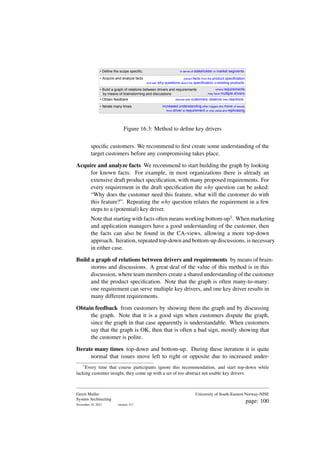
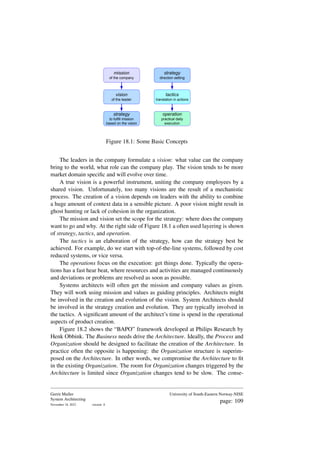
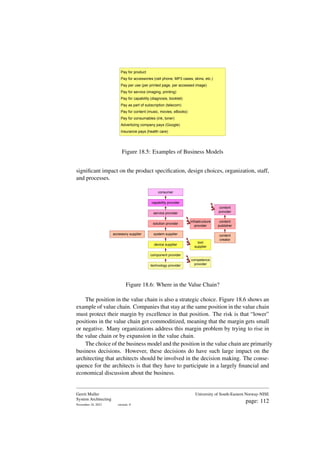
![19.2 Framework for architecting and roadmapping
Customer
What
Customer
How
Product
What
Product
How
What does Customer need
in Product and Why?
drives, justifies, needs
enables, supports
Customer
objectives
Application Functional Conceptual Realization
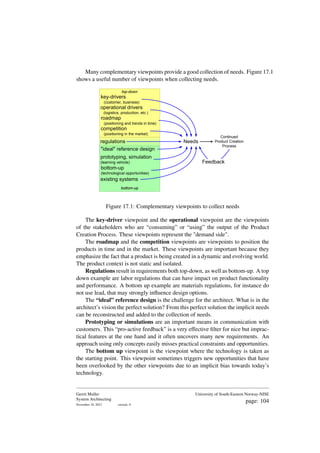
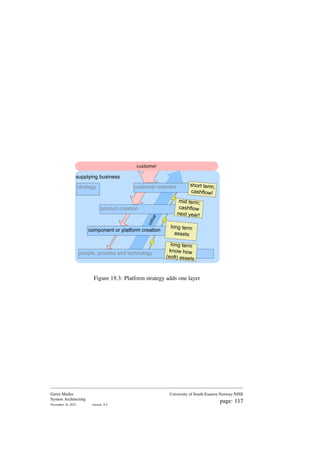
Figure 19.4: CAFCR framework for architecting
Figure 19.4 shows the ”CAFCR” framework for system architecting, see [18].
The customer objectives view and the application view provide the why from the
customer. The functional view describes the what of the product, which includes
(despite the name) also the non functional requirements. The how of the product
is described in the conceptual and realization view, where the conceptual view is
changing less in time than the fast changing realization (Moore’s law!).
The job of the architect is to integrate these views in a consistent and balanced
way. Architects do this job by frequent viewpoint hopping, looking at the problem
from many different viewpoints, sampling the problem and solution space in order
to build up an understanding of the business. Top down (objective driven, based
on intention and context understanding) in combination with bottom up (constraint
aware, identifying opportunities, know how based), see figure 19.5.
In other words the views must be used concurrently, not top down like the
waterfall model. However at the end a consistent story must be available, where the
justification and the needs are expressed in the customer side, while the technical
solution side enables and support the customer side.
The term customer is easily used, but it is far from trivial to determine the
customer. The position in the value chain shows that multiple customers are involved.
In figure 19.6 the multiple customers are addressed by applying the CAFCR model
recursively.
The customer is a gross generalization. Marketing managers make a classifi-
cation of customers by means of a market segmentation. Nevertheless stay aware of
the level of abstraction used when discussing the customer/market/market segment.
The viewpoints of the ”CAFCR” framework are useful for setting up a roadmap
as well. However on top of these views also business, people and process views
are needed in a roadmap, see figure 20.1 and [15].
Gerrit Muller
System Architecting
November 18, 2023 version: 0.2
University of South-Eastern Norway-NISE
page: 118](https://image.slidesharecdn.com/systemarchitecturebook-250106045108-30a869df/85/SystemArchitectureBook-pdfffffffffffffffffffffffffff-126-320.jpg)
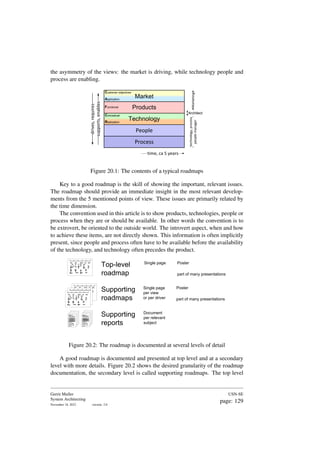
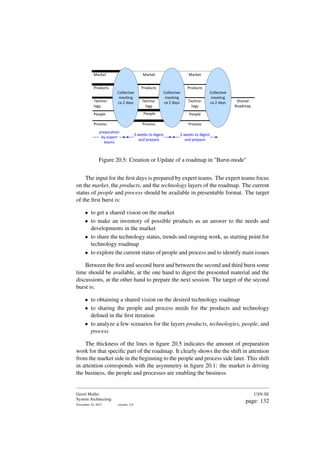
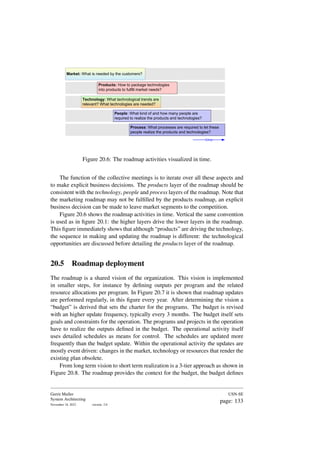
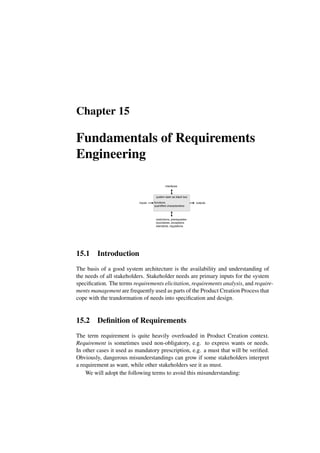
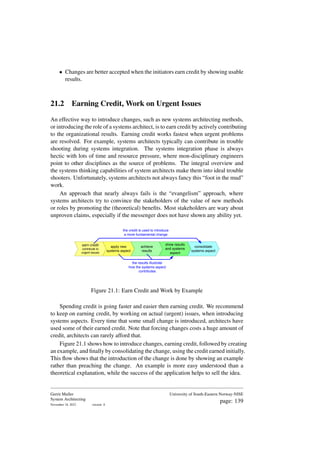
![• The amount of information has to be limited to maintain the overview.
20.6.1 Selection of most important or relevant issues
The art of making a roadmap is the selection of the most relevant issues. It is quite
easy to generate an extensive roadmap, visualizing all marketing and technological
information. However, such superset roadmap is only the first step in making the
roadmap. The superset of information will create an overload of information that
inhibits the overview we strive for.
20.6.2 Key drivers as a means to structure the roadmap
In [14] key drivers are explained as an effective method to elicit and understand
requirements. Key drivers can also be very helpful in the creation and update of
the roadmap. At the marketing side the trend in these key drivers must be visible
in the roadmap. Showing key driver trends also helps to structure the roadmap.
The supporting roadmaps can clarify how the key driver trends will be supported
For instance, a technology roadmap per key driver is a very explicit way to visualize
the relationship between the market in terms of key drivers, the products with the
expected performance levels, and enabling technologies.
20.6.3 Nothing is certain, ambiguity is normal
A roadmap is a means to share insight and understanding in a broader time and
business perspective. Both dimensions are full of uncertainties and mostly outside
the control of the stakeholders. It can not be repeated often enough that a roadmap
is only a vision (or dream?).
The only certainty about a roadmap is that reality will differ from the vision
presented in the roadmap.
As a consequence the investment in making the roadmap more accurate and
more complete should be limited. Nobody can predict the future, we will have to
live with rather ambiguous visions and expectations of the future.
20.6.4 Use facts whenever possible
The disclaimer that ambiguity is normal can be used as an excuse to deliver sloppy
work Unfortunately, a sloppy roadmap will backfire to the creators. It is recom-
mended to base a roadmap on facts whenever possible Examples of sources of
facts are:
• Market analysis reports (number of customers, market size, competition,
trends)
• Installed base (change requests, problem reports, historical data)
Gerrit Muller
System Architecting
November 18, 2023 version: 2.0
USN-SE
page: 135](https://image.slidesharecdn.com/systemarchitecturebook-250106045108-30a869df/85/SystemArchitectureBook-pdfffffffffffffffffffffffffff-143-320.jpg)


![customer
sales logistics production service
presales
generics
People
Technology
Process
People
Technology
Process
People
Technology
Process
Information
Order
Product
$$
Support
Budget,
plan
Product
roadmap
Needs
and
Feedback
Technical
Product
Documentation
Product
related
processes
Product
generics
roadmap
Budget,
plan
Business
Drivers
Customer
Roadmap
Technology,
Process
and
People
roadmaps
Budgets
$$
Management
Tomorrow's Cashflow
Strategic Asset
Generation
Assets
Cashflow generation
Product
Needs
and
feedback
material
Figure 23.6: Financial viewpoint of processes
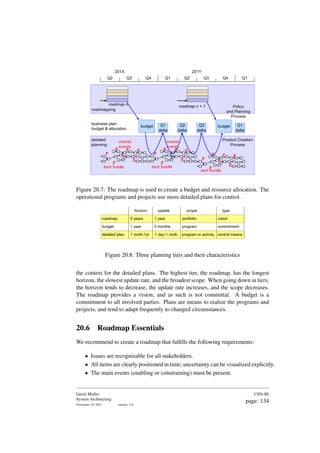
Every operational entity needs the 3 complementing processes in the product
creation process: operational management, design control and commercial. For
each of these processes a role is required of someone responsible for that process:
the operational manager, the architect and the commercial manager. Together these
3 people form the core team of the operation. Introduction of generic developments
also requires the introduction of these roles for the shared assets, such as platform
or components.
For the architect role this means that a platform architect is needed, who is
closely working together with the platform project leader and the platform manager.
At the other hand the platform architect needs many architectural contacts with
the product family architect, acting as the architectural principal, with the product
architect, acting as customers, and with the component architects, acting as suppliers.
The separation of the roles of the platform architect and the product family
architect is not obvious. For example in [9] 3 operational entities with related
processes and roles are identified. Application Family Engineering (AFE), Component
System Engineering (CSE), and Application System Engineering (ASE) map respec-
tively on Product Family, Component, and Product as shown in Figure 23.8. We
will either have a gap or a double role, when mapping 4 operational entities on
3 processes. In practice the result is that one of the roles is missing, or played
implicit. For instance quite often the application family engineer starts to play
platform architect, forgetting the original task application family engineering. We
have observed that architects either tend to play the platform architect role or the
product family role. Architects combining both roles naturally are scarce.
Gerrit Muller
System Architecting
November 18, 2023 version: 2.3
USN-SE
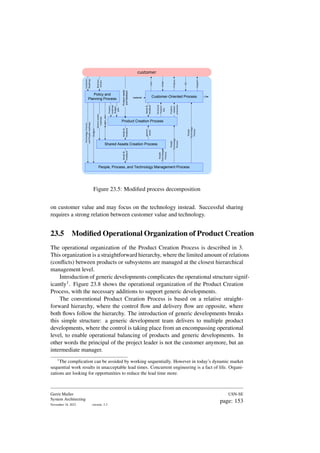
page: 154](https://image.slidesharecdn.com/systemarchitecturebook-250106045108-30a869df/85/SystemArchitectureBook-pdfffffffffffffffffffffffffff-162-320.jpg)
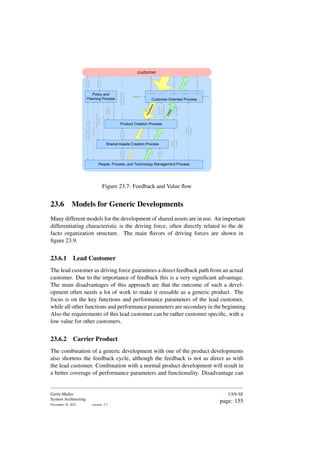
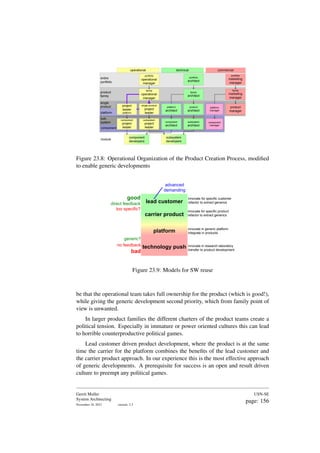
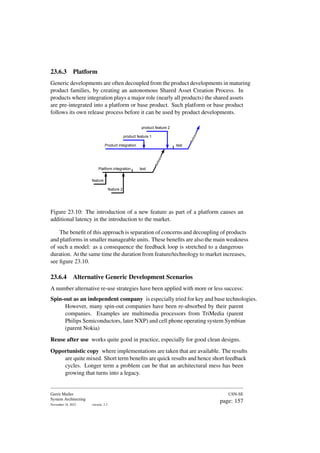
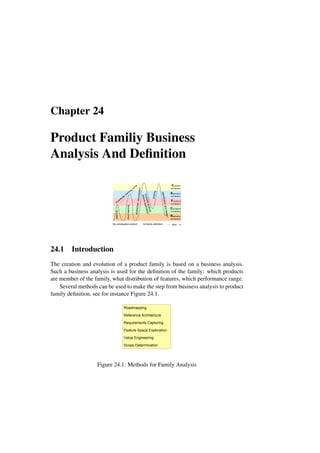
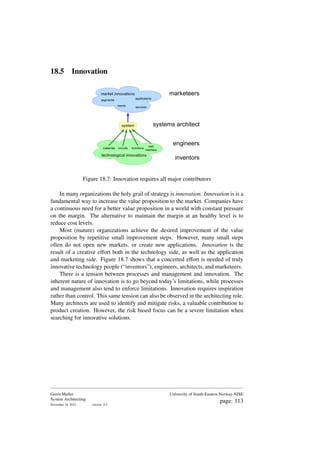
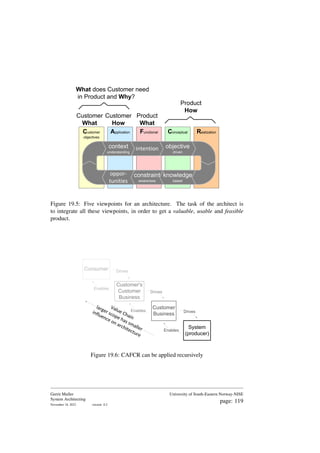
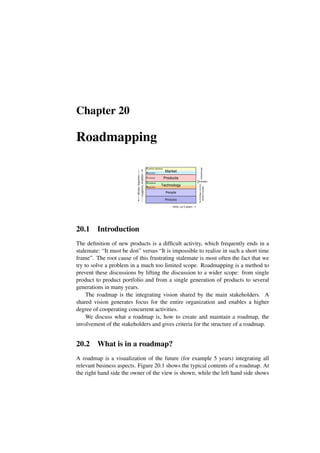
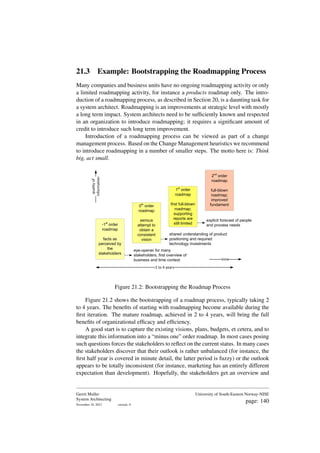
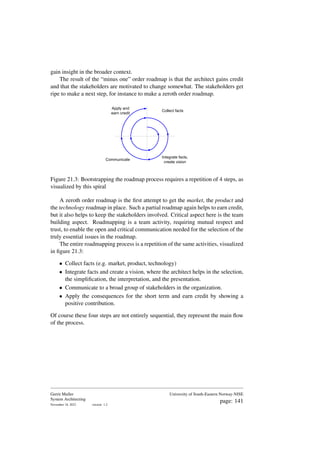
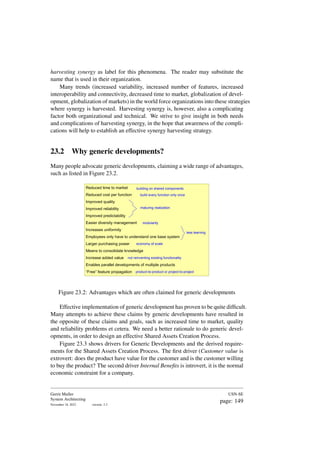
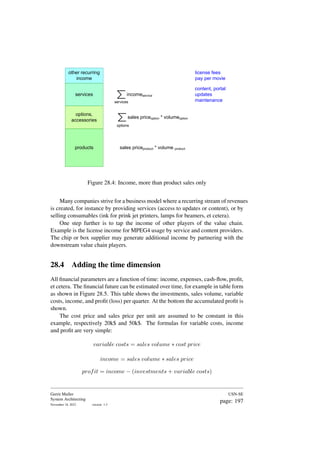
![24.2 Roadmapping
About once per year it is recommended to work for a number of weeks on roadmaps.
These roadmaps serve as a shared vision of the next 5 years, see [15]. Roadmapping
is done at the level of a product portfolio or product family. The value of roadmapping
is that it brings understanding over 5 views: market, product, technology, process
and people. This understanding has the time perspective as the main dimension.
The roadmaps provide a time and product portfolio context for the definition
of a product family. A number of the activities in roadmapping and product family
definition are quite similar; both require an market analysis, a good understanding
of commercial opportunities and insight in the technology.
Roadmapping is focused on insight, understanding and shared vision, without
any commitment. The definition of a product family results in a more specific
detailed output, which is at least partially committal. In other words. Roadmapping
is transforming a strategy into tactics, while Product Family definition transforms
the tactics into operational activities.
24.3 Reference Architecture
Customer Architecture:
• Key drivers
• Customer Business Models
• Market Model (competition,
complementors)
Functional Architecture:
· Commercial Decomposition:
· Features, Functions,
Options
Price Performance
Dimensioning
Application Architecture:
• Applicational drivers
• Application Domain Model:
• entities + relations
• behavior
• Stakeholders
Customer
objectives
Application Functional Conceptual Realization
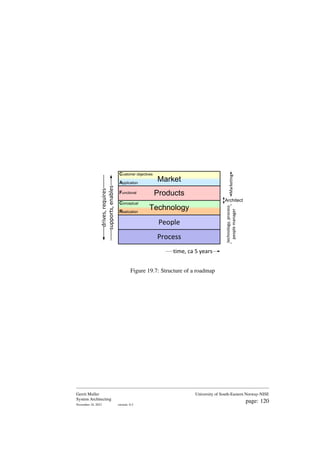
Figure 24.2: Product Family Reference Architecture, zooming in on the views
determined by the business analysis and family definition process
A reference architecture covers 5 viewpoints on a product family, see figure 24.2.
The business, application and functional architectures are the main subjects of
interest during the business analysis and family definition process.
Gerrit Muller
System Architecting
November 18, 2023 version: 2.1
University of South-Eastern Norway-NISE
page: 162](https://image.slidesharecdn.com/systemarchitecturebook-250106045108-30a869df/85/SystemArchitectureBook-pdfffffffffffffffffffffffffff-170-320.jpg)
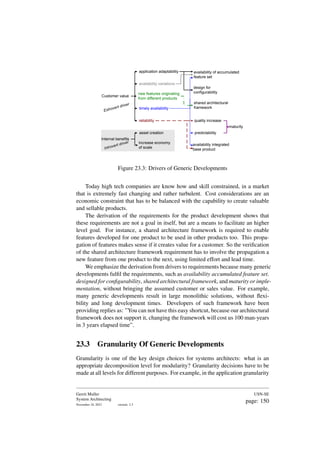
![24.3.1 Business Architecture
The business architecture models the world of the customer. Again a number of
complementary views are required.
The key drivers of the customer are identified, see [14]. A limited, but specific
set of key drivers is a powerful guide in the entire creation process.
The business model of the customer is determined, see typical questions addressed
by a business model in Figure 24.3
Who appreciates what?
Who pays when for what?
Who takes decisions?
Figure 24.3: Questions addresses in the business model
The business of the customer is served by many different suppliers. Some of
these suppliers are competing with your own business, while others are comple-
mentary. This information is compiled into a market model.
Example Set top boxes are supplied to different kinds of customers, varying
from consumers to content providers. In case of the content providers different
business models are practiced, ranging from pay-per-view to entirely paid by the
advertisers.
The set top box is only a small part of the value chain. Many complementers
are active in this entire chain, which starts at the content generation and ends at
the television screen of the consumer. Philips is quite active in all complementing
products at the consumer side, such as television and video storage, while it is
active in parts of the value chain proceeding the set top box.
The competition exists from comparable set top box manufacturers, but also
new devices such as game computers (Playstation 2) enter this market.
24.3.2 Application Architecture
The application architecture models the way the user works or enjoys your products
in a broader context.
The key drivers of the business architecture are transformed into application
drivers, which describe what the user needs to fulfill the key drivers of the business.
These application drivers provide insight. The direct relation with the key drivers
and the functional requirements provide traceability and a means to focus the
requirement process.
Application domain models support the other processes by providing a shared
reference. A model describing the entities and their relations ”sets the stage”; it
Gerrit Muller
System Architecting
November 18, 2023 version: 2.1
University of South-Eastern Norway-NISE
page: 163](https://image.slidesharecdn.com/systemarchitecturebook-250106045108-30a869df/85/SystemArchitectureBook-pdfffffffffffffffffffffffffff-171-320.jpg)
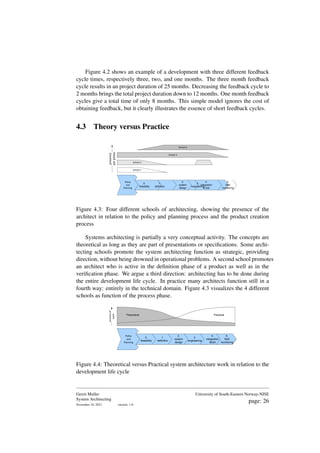
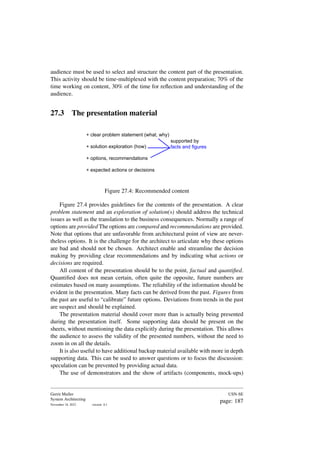
![24.5 Relation with the Technical Architecture
generic components
product-specific components
architecture
guidelines
Customer
objectives
Application Functional Conceptual Realization
Figure 24.5: Technical Architecture for a Product Family
The family definition will have to iterate with the technical and implemen-
tation architecture. Figure 24.5 shows an example of the contents of a technical
architecture in case of a Component Based Product Family.
Rather fundamental decisions which have to be taken for the technical archi-
tecture is where to address the requirements, in:
• Product Specific Components,
• Generic Components, or in
• Architecture Guidelines.
Ideally the technical structure closely resembles the functional structure, by a
natural mapping of functions and features on components.
24.6 Requirements Capturing
Collection and analysis of requirements is indispensable. Many methods exists to
do this. In [14] the requirements capturing is described for products. However the
methods described in this article are also applicable for Product Families.
Product Family Definition requires special attention for commonality and variation
analysis and for product positioning. In section 24.7 some more detailed method is
described to address these issues.
Also special attention should be paid to the life cycle requirements, these
requirements often originate at internal stakeholders, such as sales, manufacturing,
Gerrit Muller
System Architecting
November 18, 2023 version: 2.1
University of South-Eastern Norway-NISE
page: 166](https://image.slidesharecdn.com/systemarchitecturebook-250106045108-30a869df/85/SystemArchitectureBook-pdfffffffffffffffffffffffffff-174-320.jpg)
![Installation
Configuration
Customization
Life-cycle management (amongst others upgrading)
Configuration Management
Licensing strategy
Figure 24.6: Subjects requiring special attention for Product Families
service et cetera. Figure 24.6 shows a list of subjects which require special attention
in case of product families.
24.7 Feature Space Exploration and Value Engineering
1. Make an inventory of features
2. Map features on market segments
3. Determine products
4. Map features on products
5. Determine valuation criteria
6. Valuate features per product
Figure 24.7: From Feature Exploration to Valuation per Product
Analysis of commonality and variation of features over products helps to define
the product family in first instance and to make a family design in second instance.
This analysis starts with an exploration of the feature space, and results in a valued
set of features per product. Figure 24.7 shows which steps are taken in this process.
See also [14] which describes how to obtain requirements.
market
segments
features
Figure 24.8: Market Feature Map
Gerrit Muller
System Architecting
November 18, 2023 version: 2.1
University of South-Eastern Norway-NISE
page: 167](https://image.slidesharecdn.com/systemarchitecturebook-250106045108-30a869df/85/SystemArchitectureBook-pdfffffffffffffffffffffffffff-175-320.jpg)
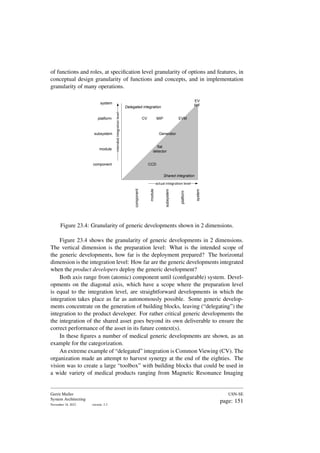
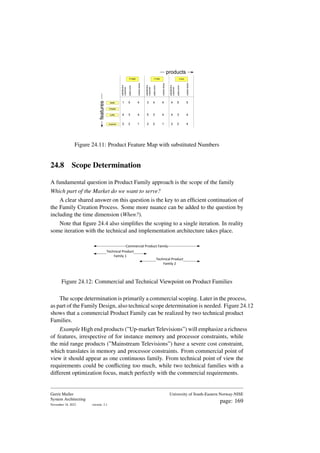
![The features can be mapped on market segments, resulting in a matrix, see
figure 24.8. The feature axis can be ordered, for instance by following the key
driver, application driver derivation.
Again iteration is the magic word. Iterate a few times from Market segment
to Features and vice versa. If key drivers are used as structure for the feature axis,
then these key drivers should be included in the iteration. Market segments can
have different key drivers!
products
features
Figure 24.9: Product Feature Map
The Market segmentation can be transformed in products, once sufficient insight
is obtained in the market segments and the features involved. This results in a
Product Feature Map, see figure 24.9.
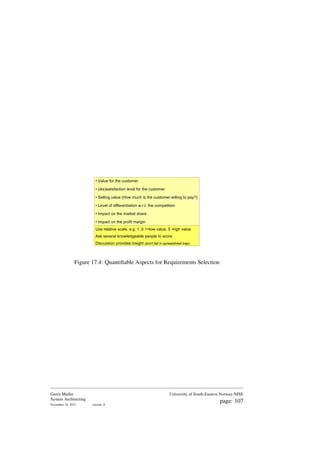
• Value for the customer
• (dis)satisfaction level for the customer
• Selling value (How much is the customer willing to pay?)
• Level of differentiation w.r.t. the competition
• Impact on the market share
• Impact on the profit margin
Use relative scale, e.g. 1..5 1=low value, 5 -high value
Ask several knowledgeable people to score
Discussion provides insight (don't fall in spreadsheet trap)
Figure 24.10: Example of Valuation Criteria
Valuation criteria are needed to determine the value of features. Figure 24.10
shows an example of Valuation Criteria.
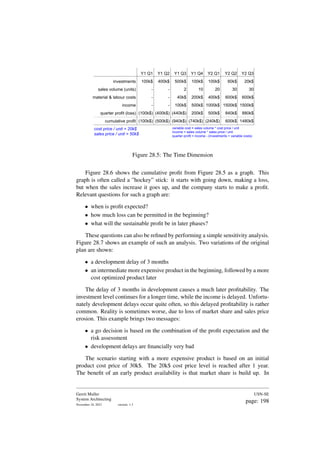
Figure 24.11 shows the result of the entire process. Here all the features have
been valuated, the corresponding values are substituted in the matrix.
This matrix is the starting point for the selection process, see section 24.4,
which finally has to answer:
Which Feature will be realized When for Which product?
A much more elaborated method for feature space exploration, valuation and
scoping can be found in [4].
Gerrit Muller
System Architecting
November 18, 2023 version: 2.1
University of South-Eastern Norway-NISE
page: 168](https://image.slidesharecdn.com/systemarchitecturebook-250106045108-30a869df/85/SystemArchitectureBook-pdfffffffffffffffffffffffffff-176-320.jpg)

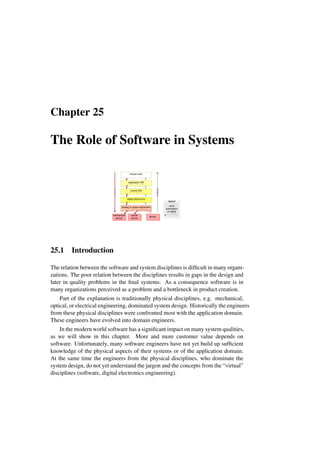
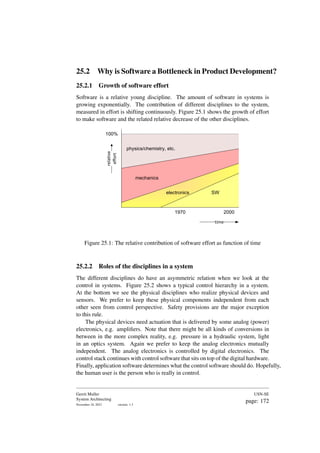
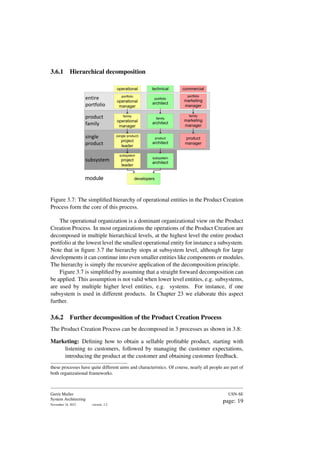
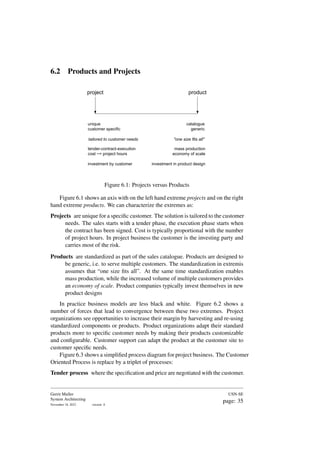
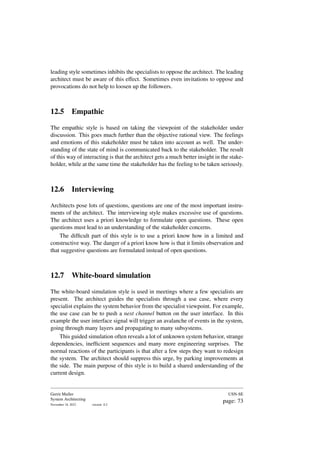
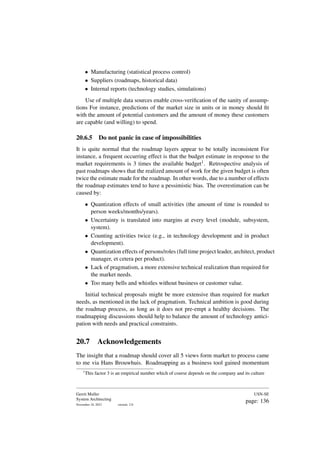
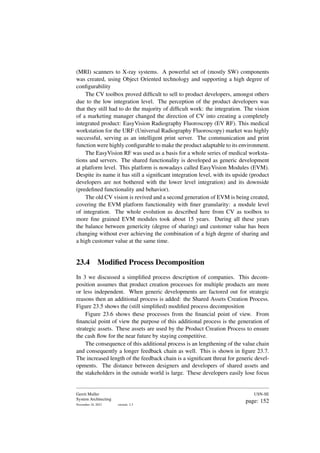
![25.3 System or Software Issues?
Systems can be specified in terms of their functionality and qualities. Most qualities
of a system are strongly influenced or even determined by the software design.
Figure 25.4 based on [19] shows a checklist for qualities. In this figure all qualities
that have a strong or weak relation with the software design are highlighted.
usability
attractiveness
responsiveness
image quality
wearability
storability
transportability
usable
safety
security
reliability
robustness
integrity
availability
dependable
throughput or
productivity
effective
serviceability
configurability
installability
serviceable
liability
testability
traceability
standards compliance
liable
ecological footprint
contamination
noise
disposability
ecological
reproducibility
predictability
consistent
efficient
resource utilization
cost of ownership
cost price
power consumption
consumption rate
(water, air,
chemicals,
etc.)
size, weight
accuracy
down-to-earth
attributes
manufacturability
logistics flexibility
lead-time
logistics friendly
evolvability
portability
upgradability
extendibility
maintainability
future proof
interoperable
connectivity
3rd
party extendible
weak SW relation
strong SW relation
legend
Figure 25.4: Quality Checklist annotated with the relation with software
During System Design the system is decomposed in subsystems and implemen-
tation technologies. The combination of subsystems and technologies together has
to realize the qualities. During this step the contribution or the role of a subsystem
and implementing technology is determined.
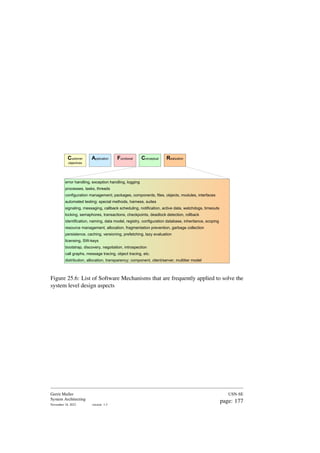
Figure 25.5 shows the System level design aspects that are strongly related to
software. Figure 25.6 shows a list of mechanisms used by SW engineers. These
mechanisms facilitate the system level design aspects mentioned in Figure 25.5.
Both Quality Attributes and Design Aspects are System Level issues, however
most of these issues are predominantly influenced by the software. The System
Architect should: define the system level what, co-design the system level how
and be involved with the single technology or subsystem how.
Due to the strong Software impact the software architect should: understand/review
the system level what, co-design the system level how and design the software
how.
This requires significant domain know-how of the Software Architect, see [11].
Figures 25.5 and 25.6 contain too many design aspects and software mecha-
nisms to discuss as part of this book. The main purpose of these lists is to show the
variety of technology issues to be addressed by the software architect.
Many of the design aspects have a many to many relation to the software
mechanisms. For example, the design strategies for performance, safety, and security
Gerrit Muller
System Architecting
November 18, 2023 version: 1.3
USN-SE
page: 175](https://image.slidesharecdn.com/systemarchitecturebook-250106045108-30a869df/85/SystemArchitectureBook-pdfffffffffffffffffffffffffff-183-320.jpg)
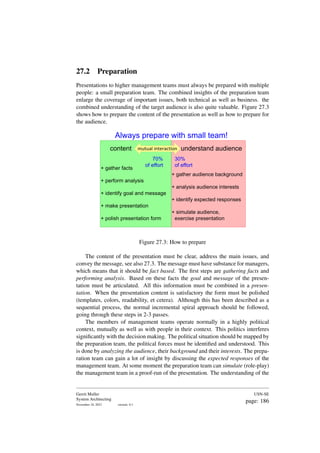
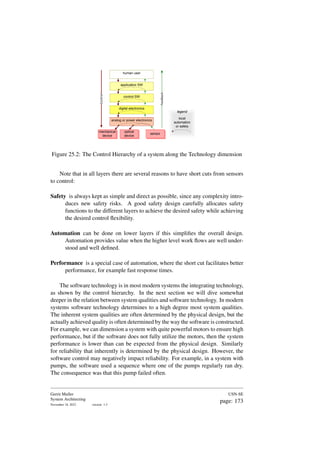
![27.5 Exercise
The SARCH course [12] on System Architecting contains an exercise, where the
participants can apply then lessons learned by giving a presentation to a (simulated)
management team. The presenter gives his presentation for the participants and the
teacher, who play the role of this higher management team.
+ Bring a clear architecture message to
+ a Management team at least 2 hierarchical levels higher
+ with 10 minutes for presentation including discussion
(no limitation on number of slides)
* architecture message =
technology options in relation with market/product
* address the concerns of the management stakeholders:
translation required from technology issues into
business consequences (months, fte's, turnover, profit, investments)
Figure 27.9: Exercise presentation to higher management
Figure 27.9 shows the description of this exercise. The group of participants
is divided in 4 teams of about 4 people, preferably from the same domain. These
teams have somewhat less than 2 hours for the preparation of the presentation. The
exercise is explained to them several days before and the teams are also formed
days before. This enables the team to determine a subject and message in a background
process, during lunch and in the breaks. Determining the subject and message
requires quite some elapsed time. It is highly recommended to take a subject from
real-life: ”What you always wanted to tell topmanagement”.
prepare in team of 4 1 2
1 2
present and
discuss feedback
3 4
3 4
13:30 17:00
14:00 15:00 16:00
Figure 27.10: Schedule of the presentation exercise
Figure 27.10 shows the schedule of the exercise. Every presentation is 10
minutes sharp, including the interaction with the management team. Directly after
Gerrit Muller
System Architecting
November 18, 2023 version: 0.1
USN-SE
page: 191](https://image.slidesharecdn.com/systemarchitecturebook-250106045108-30a869df/85/SystemArchitectureBook-pdfffffffffffffffffffffffffff-199-320.jpg)

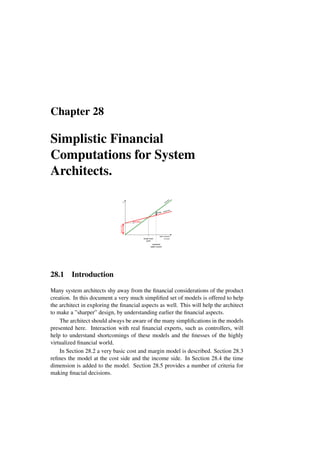
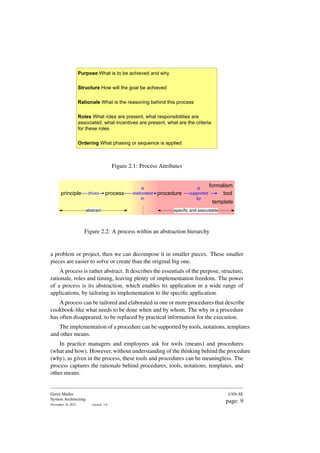
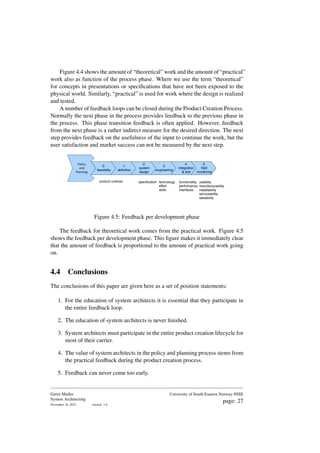
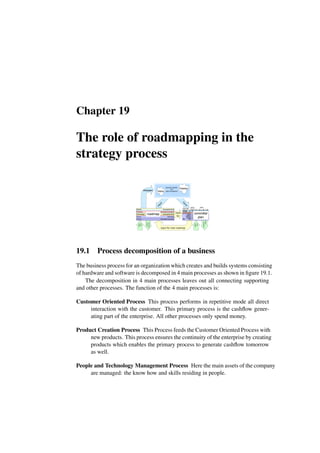
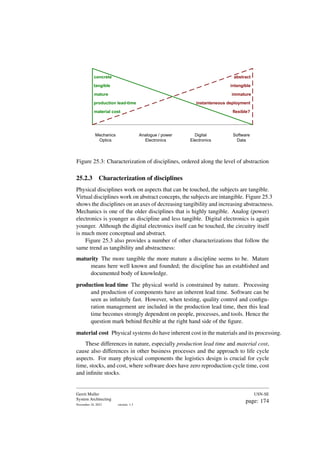
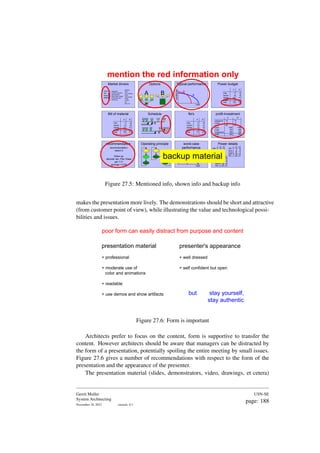
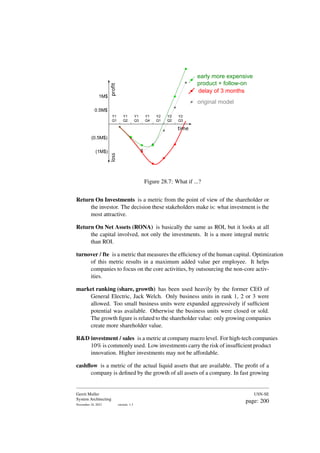
![28.2 Cost and Margin
The simplest financial model looks only at the selling price (what does the customer
pay), the cost price (how much does the manufacturing of the product actually
cost). The difference of the selling price and the cost price is the margin. Figure 28.1
shows these simple relations. The figure also adds some annotations, to make the
notions more useful:
• the cost price can be further decomposed in material, labor and other costs
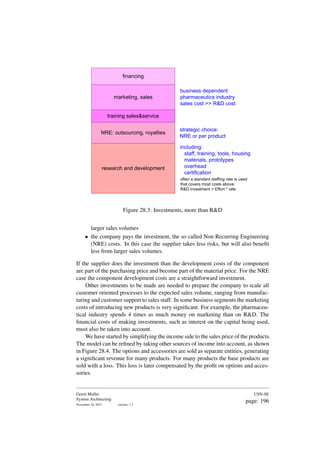
• the margin (”profit per product”) must cover all other company expenses,
such as research and development costs, before a real profit is generated
• most products are sold as one of the elements of a value chain. In this figure
a retailer is added to show that the street price, as paid by the consumer, is
different from the price paid by the retailer[1].
The annotation of the other costs, into transportation, insurance, and royalties per
product, show that the model can be refined more and more. The model without
such a refinement happens to be rather useful already.
material
labour
miscellaneous
margin
cost
price
sales
price
Cost per product,
excluding fixed costs
Margin per product.
The margin over the sales volume,
must cover the fixed costs, and generate profit
transportation, insurance,
royalties per product, ...
purchase price of components may cover
development cost of supplier
retailer margin
and costs
street
price
Figure 28.1: The relation between sales price, cost price and margin per product
The translation of margin into profit can be done by plotting income and expenses
in one figure, as shown in Figure 28.2, as function of the sales volume. The slope
of the expenses line is proportional with the costs per product. The slope of the
income line is proportional with the sales price. The vertical offset of the expenses
line are the fixed organizational costs, such as research, development, and overhead
costs. The figure shows immediately that the sales volume must exceed the break
even point to make a profit. The profit is the vertical distance between expenses
and income for a given sales volume. The figure is very useful to obtain insight in
Gerrit Muller
System Architecting
November 18, 2023 version: 1.3
USN-SE
page: 194](https://image.slidesharecdn.com/systemarchitecturebook-250106045108-30a869df/85/SystemArchitectureBook-pdfffffffffffffffffffffffffff-202-320.jpg)
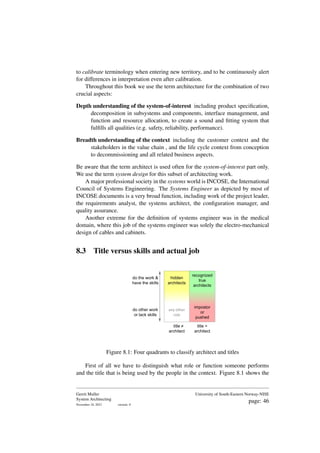
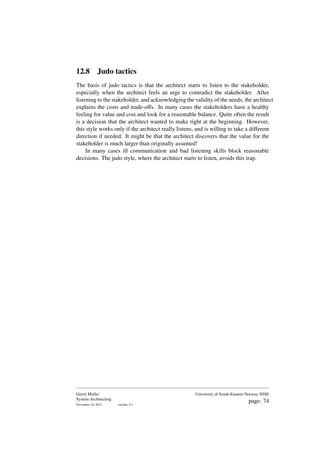
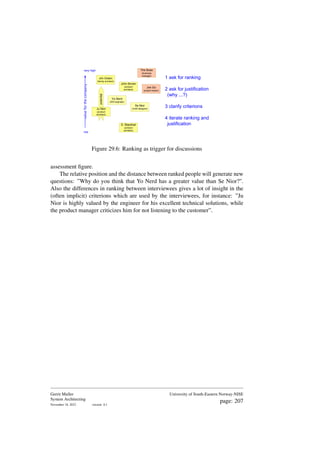
![Chapter 29
How to appraise or assess an
architect?
John Brown
(product
architect)
Jim Green
(family architect)
Yo Nerd
(SW engineer)
Joe Go
(project leader)
D. Blackhat
(product
architect)
potential
Ju Nior
(product
architect)
Se Nior
(chief designer)
The Boss
(business
manager)
value
for
the
company
1 ask for ranking
2 ask for justification
(why ...?)
3 clarify criterions
4 iterate ranking and
justification
very high
low
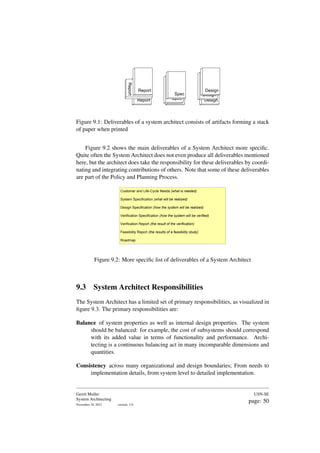
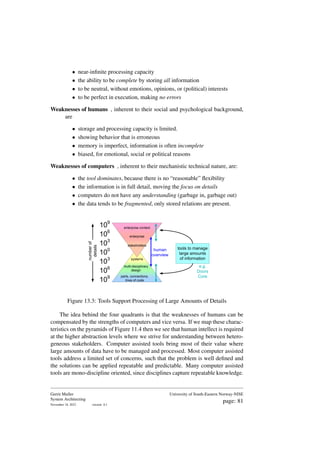
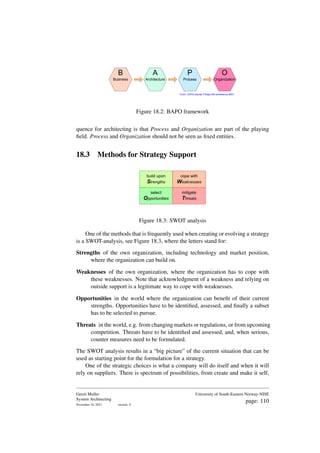
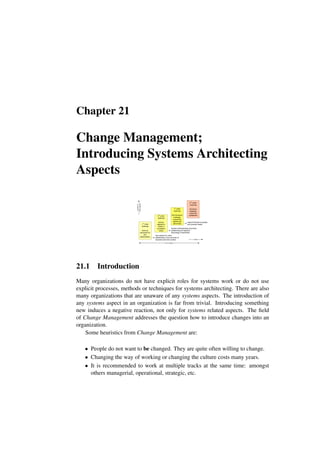
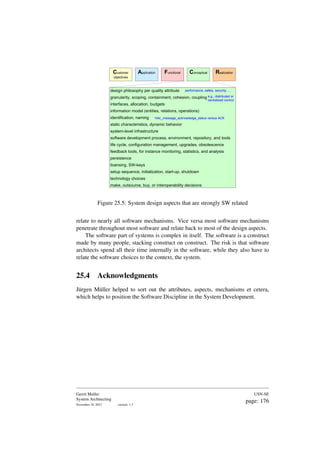
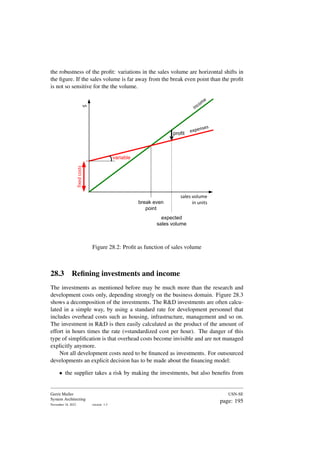
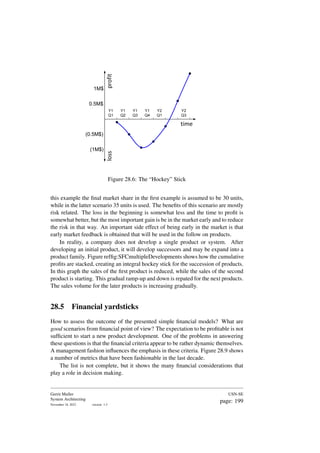
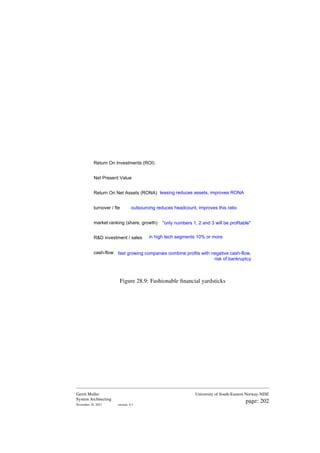
29.1 Introduction
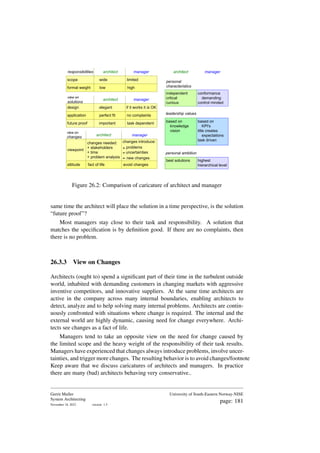
The responsibilities of system architects are ill defined. Either the responsibilities
overlap significantly with other players in the Product Creation Process, or the
responsibilities are very abstract and vague (not specific and measurable), see [17].
- difficult to define yardstick
- difficult to measure
- difficult to compare
- difficult to certify
- difficult to translate in (financial) consequences
abstract (vague) responsibilities
lot of overlap of responsibilities
How to assess an architect?
Figure 29.1: The function of an architect is difficult to evaluate
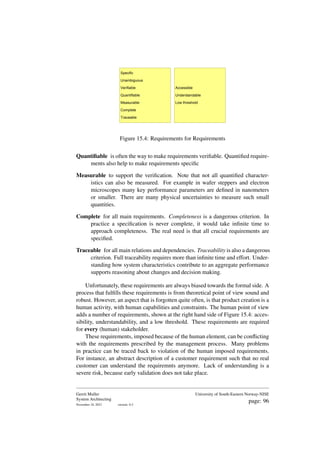
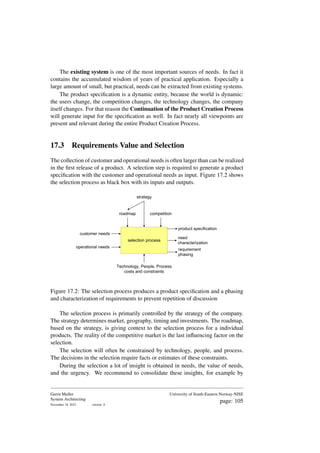
Figure 29.1 provides the problem statement: How to asses the architect, when it
is difficult to define a yardstick, measurements, comparisons, or certifications due](https://image.slidesharecdn.com/systemarchitecturebook-250106045108-30a869df/85/SystemArchitectureBook-pdfffffffffffffffffffffffffff-211-320.jpg)
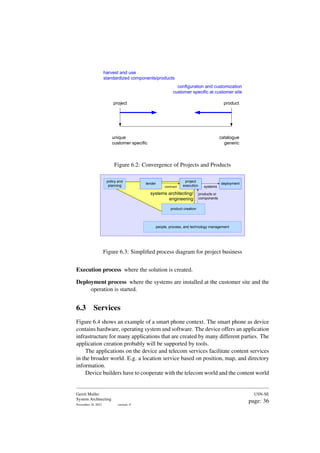
![to the ill defined responsibilities. The financial remuneration, which is normally
based on measurements and comparisons also becomes very difficult.
Section 29.2 formulates the success criterions for architects. These criterions
are used in section 29.3 to describe an assessment method.
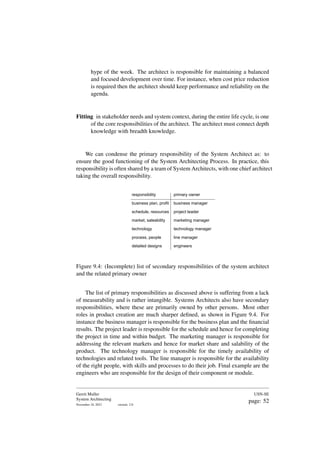
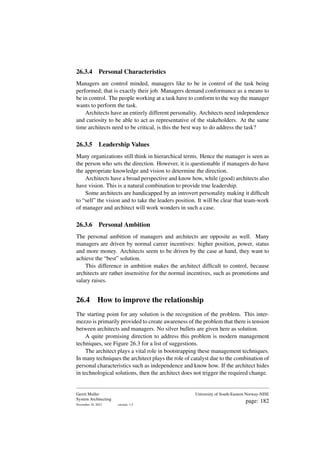
29.2 When is the architect successful?
In [17] the deliverables, responsibilities and activities of the system architect are
discussed. Figure 29.2 summarizes this article. The deliverables of the architect
are abstract paperwork or electronic information, no tangible modules or systems.
The primary responsibilities are not easily measured: how sound (balanced, well
decomposed, consistent, et cetera) is the system specification and design? The
architect is spending most of his time on activities which do not result in one of
the deliverables and most of the activities do not directly contribute to the primary
responsibilities. However all of these activities are indispensable for the role of the
architect and together ensure the architecture quality.
V4aa
IO
Idea
Bla Bla
system
subsystem
module
Requirement
Spec
Design
Realization
modules
Function
Q
u
a
li
ty
KISS
many very detailed
Activities
necessary but invisible
Responsibilities
abstract and qualitative
Deliverables
paperwork only
Spec Design
Report
Report
Report
Design
Design
Spec
Spec
Report
Report
Report
r
e
p
o
r
t
s
p
e
c
d
e
s
i
g
n
balance consistency
decomposition
integration
overview simplicity integrity
thinking, talking, discussing, scheduling, presenting, measuring, writing, reviewing, visiting customers
analyzing, listening, brainstorming, supporting, teaching, testing, reading, visiting trade-shows
simulating, communicating, troubleshooting, selling, integrating, browsing, consolidating, visiting suppliers
Figure 29.2: Tangible deliverables based upon many invisible activities
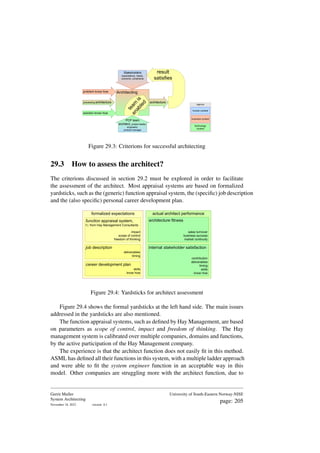
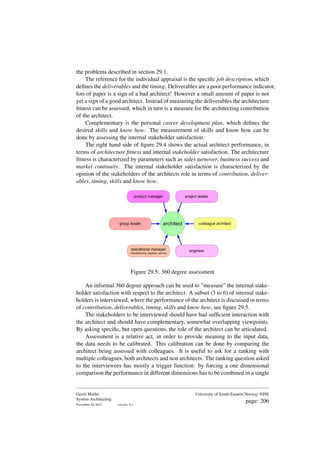
Figure 29.3 shows the architecting function and the criterions for successful
architecting. Architecting is the transformation of problem and solution know how
and often an already existing architecture into a new architecture. This process
takes place in the context of many stakeholders, with their expectations, needs,
concerns and constraints. The architecting is done by the product creation team
(project leader, engineers, product manager and the system architect), although the
architect should take the lead in this process.
The architect has played his role successful if the 2 criterions which are shown
are fulfilled:
• the resulting architecture satisfies the stakeholders
• the architect has enabled the product creation team by leading the archi-
tecting process.
Gerrit Muller
System Architecting
November 18, 2023 version: 0.1
University of South-Eastern Norway-NISE
page: 204](https://image.slidesharecdn.com/systemarchitecturebook-250106045108-30a869df/85/SystemArchitectureBook-pdfffffffffffffffffffffffffff-212-320.jpg)
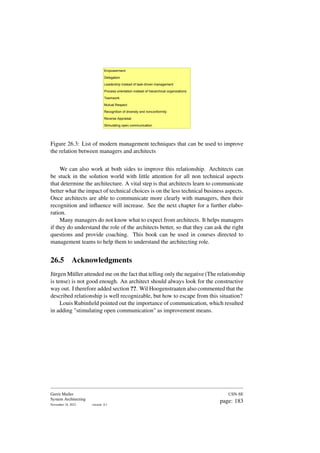
![Bibliography
[1] Mark Abraham. Define and price for your market starting at end market
values! http://www.sticky-marketing.net/articles/
pricing-for-channels.htm, 2001.
[2] Kent Beck. Extreme Programming Explained: Embrace Change. Addison-
Wesley, Reading, MA, 2000.
[3] Dana Bredemeyer and Ruth Malan. Role of the software architect. http:
//www.bredemeyer.com/pdf_files/role.pdf, 1999.
[4] Jean-Marc DeBaud and Klaus Schmid. A systematic approach to derive the
scope of software product lines. In 21st international Conference on Software
Engineering: Preparing for the Software Century, pages 34–47. ICSE, 1999.
[5] K. Frampton, J. M. Carroll, and J. A. Thom. What capabilities do IT architects
say they need? In 10th United Kingdom Academy for Information Systems
(UKAIS) Proceedings, 2005.
[6] Thomas Gilb. Competitive Engineering: A Handbook For Systems
Engineering, Requirements Engineering, and Software Engineering Using
Planguage. Elsevier Butterworth-Heinemann, London, 2005.
[7] W. Huitt. Maslow’s hierarchy of needs. Educational Psychology Interactive.
Valdosta, GA: Valdosta State University., 2004.
[8] Ivar Jacobson, Grady Booch, and James Rumbaugh. The Unified Software
Development Process. Addison-Wesley, Reading, MA, 1999.
[9] Ivar Jacobson, Martin Griss, and Patrik Jonsson. Software Reuse; Archi-
tecture, Process and Organization for Business Success. ACM Press, New
York, 1997.
[10] Klaus Kronlöf, editor. Method Integration; Concepts and Case Studies. John
Wiley, Chichester, England, 1993. A useful introduction is given in Chapter
1, The Concept of Method Integration.](https://image.slidesharecdn.com/systemarchitecturebook-250106045108-30a869df/85/SystemArchitectureBook-pdfffffffffffffffffffffffffff-216-320.jpg)
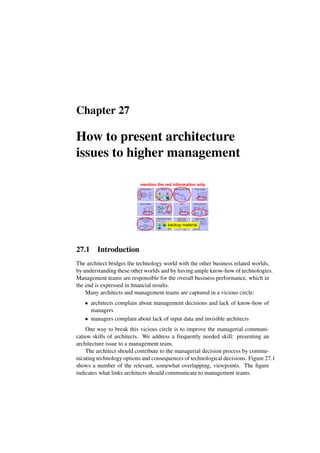
![[11] Philip Kruchten. The software architect- and the software architecture team.
In Software Architecture; TC2 First Working IFIP Conference on Software
Architecture (WICSA1), pages 565–583. IFIP, 1999. This article describes
required skills for architect and architecture team; traps and pitfalls; Person-
ality profile based on Myers-Briggs Type Indicator.
[12] Gerrit Muller. CTT course SARCH. http://www.gaudisite.nl/
SARCHcoursePaper.pdf, 1999.
[13] Gerrit Muller. Product families and generic aspects. http://www.
gaudisite.nl/GenericDevelopmentsPaper.pdf, 1999.
[14] Gerrit Muller. Requirements capturing by the system architect. http://
www.gaudisite.nl/RequirementsPaper.pdf, 1999.
[15] Gerrit Muller. Roadmapping. http://www.gaudisite.nl/
RoadmappingPaper.pdf, 1999.
[16] Gerrit Muller. The system architecture homepage. http://www.
gaudisite.nl/index.html, 1999.
[17] Gerrit Muller. The role and task of the system architect. http://www.
gaudisite.nl/RoleSystemArchitectPaper.pdf, 2000.
[18] Gerrit Muller. Architectural reasoning explained. http://www.
gaudisite.nl/ArchitecturalReasoningBook.pdf, 2002.
[19] Gerrit Muller. CAFCR: A multi-view method for embedded systems archi-
tecting: Balancing genericity and specificity. http://www.gaudisite.
nl/ThesisBook.pdf, 2004.
[20] Henk Obbink, Jürgen Müller, Pierre America, and Rob van Ommering.
COPA: A component-oriented platform architecting method for
families of software-intensive electronic products. http://www.
hitech-projects.com/SAE/COPA/COPA_Tutorial.pdf, 2000.
[21] Eberhardt Rechtin and Mark W. Maier. The Art of Systems Architecting. CRC
Press, Boca Raton, Florida, 1997.
[22] Carnegie Mellon Software Engineering Institute SEI. Software engineering
management practices. http://www.sei.cmu.edu/managing/
managing.html, 2000.
History
Gerrit Muller
System Architecting
November 18, 2023 version: 0.1
University of South-Eastern Norway-NISE
page: 209](https://image.slidesharecdn.com/systemarchitecturebook-250106045108-30a869df/85/SystemArchitectureBook-pdfffffffffffffffffffffffffff-217-320.jpg)