4. SLM CORPORATION
Segment and “Core Earnings”
Consolidated Statements of Income
(In thousands)
Quarter Ended December 31, 2007
Corporate Total “Core Total
Lending APG and Other Earnings” Adjustments GAAP
(unaudited)
Interest income:
FFELP Stafford and Other Student
Loans . . . . . . . . . . . . . . . . . . . . . $ 705,051 $ — $ — $ 705,051 $ (151,738) $ 553,313
FFELP Consolidation Loans . . . . . 1,354,573 — — 1,354,573 (259,008) 1,095,565
Private Education Loans . . . . . . . . 731,217 — — 731,217 (335,255) 395,962
Other loans . . . . . . . . . . . . . . . . . 25,427 — — 25,427 — 25,427
Cash and investments . . . . . . . . . . 272,875 — 5,837 278,712 (37,866) 240,846
Total interest income . . . . . . . . . . . . 3,089,143 — 5,837 3,094,980 (783,867) 2,311,113
Total interest expense . . . . . . . . . . . . 2,471,613 6,592 5,165 2,483,370 (506,728) 1,976,642
Net interest income (loss) . . . . . . . . . 617,530 (6,592) 672 611,610 (277,139) 334,471
Less: provisions for loan losses . . . . . 749,460 — 1 749,461 (175,283) 574,178
Net interest income (loss) after
provisions for loan losses . . . . . . . (131,930) (6,592) 671 (137,851) (101,856) (239,707)
Fee income . . . . . . . . . . . . . . . . . . . — 91,872 40,980 132,852 — 132,852
Collections revenue . . . . . . . . . . . . . — 73,916 — 73,916 2,189 76,105
Other income . . . . . . . . . . . . . . . . . 44,189 — 55,354 99,543 (1,349,444) (1,249,901)
Total other income (loss) . . . . . . . . . 44,189 165,788 96,334 306,311 (1,347,255) (1,040,944)
Operating expenses(1) . . . . . . . . . . . . 191,440 105,822 90,297 387,559 53,415 440,974
Income (loss) before income taxes and
minority interest in net earnings of
subsidiaries . . . . . . . . . . . . . . . . . (279,181) 53,374 6,708 (219,099) (1,502,526) (1,721,625)
Income tax expense (benefit)(2) . . . . . (103,297) 19,749 2,481 (81,067) (5,837) (86,904)
Minority interest in net earnings of
subsidiaries . . . . . . . . . . . . . . . . . — 537 — 537 — 537
Net income (loss) . . . . . . . . . . . . . . $ (175,884) $ 33,088 $ 4,227 $ (138,569) $(1,496,689) $(1,635,258)
(1)
Operating expenses for the Lending, APG, and Corporate and Other reportable segments include $5 million, $2 million, and $3 mil-
lion, respectively, of stock option compensation expense, and $19 million, $2 million and $2 million, respectively, of severance
expense.
(2)
Income taxes are based on a percentage of net income before tax for the individual reportable segment.
4
5. SLM CORPORATION
Segment and “Core Earnings”
Consolidated Statements of Income
(In thousands)
Quarter ended September 30, 2007
Corporate Total “Core Total
Lending APG and Other Earnings” Adjustments GAAP
(unaudited)
Interest income:
FFELP Stafford and Other Student
Loans . . . . . . . . . . . . . . . . . . . . $ 729,255 $ — $ — $ 729,255 $(183,637) $ 545,618
FFELP Consolidation Loans . . . . . . 1,445,108 — — 1,445,108 (299,635) 1,145,473
Private Education Loans . . . . . . . . . 753,295 — — 753,295 (360,558) 392,737
Other loans . . . . . . . . . . . . . . . . . . 25,990 — — 25,990 — 25,990
Cash and investments . . . . . . . . . . . 250,463 — 6,039 256,502 (45,199) 211,303
Total interest income . . . . . . . . . . . . . 3,204,111 — 6,039 3,210,150 (889,029) 2,321,121
Total interest expense . . . . . . . . . . . . 2,533,909 6,632 5,282 2,545,823 (666,012) 1,879,811
Net interest income (loss) . . . . . . . . . 670,202 (6,632) 757 664,327 (223,017) 441,310
Less: provisions for loan losses . . . . . 199,591 — — 199,591 (56,991) 142,600
Net interest income (loss) after
provisions for loan losses . . . . . . . . 470,611 (6,632) 757 464,736 (166,026) 298,710
Fee income . . . . . . . . . . . . . . . . . . . — 76,306 45,935 122,241 — 122,241
Collections revenue . . . . . . . . . . . . . . — 52,534 — 52,534 254 52,788
Other income . . . . . . . . . . . . . . . . . . 45,745 — 62,843 108,588 (485,662) (377,074)
Total other income (loss) . . . . . . . . . . 45,745 128,840 108,778 283,363 (485,408) (202,045)
Operating expenses(1) . . . . . . . . . . . . 163,855 94,625 78,882 337,362 18,537 355,899
Income (loss) before income taxes and
minority interest in net earnings of
subsidiaries . . . . . . . . . . . . . . . . . . 352,501 27,583 30,653 410,737 (669,971) (259,234)
Income tax expense (benefit)(2) . . . . . . 130,425 10,206 11,342 151,973 (67,524) 84,449
Minority interest in net earnings of
subsidiaries . . . . . . . . . . . . . . . . . . — 77 — 77 — 77
Net income (loss) . . . . . . . . . . . . . . . $ 222,076 $ 17,300 $ 19,311 $ 258,687 $(602,447) $ (343,760)
(1)
Operating expenses for the Lending, APG, and Corporate and Other reportable segments include $4 million, $2 million, and $2 mil-
lion, respectively, of stock option compensation expense.
(2)
Income taxes are based on a percentage of net income before tax for the individual reportable segment.
5
6. SLM CORPORATION
Segment and “Core Earnings”
Consolidated Statements of Income
(In thousands)
Quarter ended December 31, 2006
Corporate Total “Core Total
Lending APG and Other Earnings” Adjustments GAAP
(unaudited)
Interest income:
FFELP Stafford and Other Student
Loans . . . . . . . . . . . . . . . . . . . . . . . . $ 700,961 $ — $ — $ 700,961 $ (292,234) $ 408,727
FFELP Consolidation Loans . . . . . . . . . . 1,305,744 — — 1,305,744 (338,904) 966,840
Private Education Loans . . . . . . . . . . . . . 620,092 — — 620,092 (328,667) 291,425
Other loans . . . . . . . . . . . . . . . . . . . . . . 26,556 — — 26,556 — 26,556
Cash and investments . . . . . . . . . . . . . . . 197,161 — 2,225 199,386 (58,231) 141,155
Total interest income . . . . . . . . . . . . . . . . . 2,850,514 — 2,225 2,852,739 (1,018,036) 1,834,703
Total interest expense. . . . . . . . . . . . . . . . . 2,189,781 6,440 5,630 2,201,851 (739,118) 1,462,733
Net interest income (loss) . . . . . . . . . . . . . . 660,733 (6,440) (3,405) 650,888 (278,918) 371,970
Less: provisions for loan losses . . . . . . . . . . 87,895 — 298 88,193 3,812 92,005
Net interest income (loss) after provisions
for loan losses . . . . . . . . . . . . . . . . . . . . 572,838 (6,440) (3,703) 562,695 (282,730) 279,965
Fee income . . . . . . . . . . . . . . . . . . . . . . . . — 92,501 33,089 125,590 — 125,590
Collections revenue . . . . . . . . . . . . . . . . . . — 57,473 — 57,473 405 57,878
Other income . . . . . . . . . . . . . . . . . . . . . . 40,034 — 59,690 99,724 (80,090) 19,634
Total other income (loss) . . . . . . . . . . . . . . 40,034 149,974 92,779 282,787 (79,685) 203,102
Operating expenses(1) . . . . . . . . . . . . . . . . . 164,289 91,833 71,567 327,689 25,058 352,747
Income (loss) before income taxes and
minority interest in net earnings of
subsidiaries . . . . . . . . . . . . . . . . . . . . .. 448,583 51,701 17,509 517,793 (387,473) 130,320
Income tax expense (benefit)(2) . . . . . . . . .. 165,976 19,178 6,429 191,583 (79,831) 111,752
Minority interest in net earnings of
subsidiaries . . . . . . . . . . . . . . . . . . . . .. — 463 — 463 — 463
Net income (loss) . . . . . . . . . . . . . . . . . . . $ 282,607 $ 32,060 $11,080 $ 325,747 $ (307,642) $ 18,105
(1)
Operating expenses for the Lending, APG, and Corporate and Other reportable segments include $8 million, $3 million, and $3 mil-
lion, respectively, of stock option compensation expense.
(2)
Income taxes are based on a percentage of net income before tax for the individual reportable segment.
6
7. SLM CORPORATION
Segment and “Core Earnings”
Consolidated Statements of Income
(In thousands)
Year ended December 31, 2007
Corporate Total “Core Total
Lending APG and Other Earnings” Adjustments GAAP
(unaudited)
Interest income:
FFELP Stafford and Other Student
Loans. . . . . . . . . . . . . . . . . . . . . . . $ 2,848,283 $ —$ — $ 2,848,283 $ (787,290) $2,060,993
FFELP Consolidation Loans. . . . . . . . . 5,521,931 — — 5,521,931 (1,178,793) 4,343,138
Private Education Loans . . . . . . . . . . . 2,834,595 — — 2,834,595 (1,378,124) 1,456,471
Other loans . . . . . . . . . . . . . . . . . . . . 105,843 — — 105,843 — 105,843
Cash and investments . . . . . . . . . . . . . 867,659 — 21,208 888,867 (181,290) 707,577
Total interest income . . . . . . . . . . . . . . . 12,178,311 — 21,208 12,199,519 (3,525,497) 8,674,022
Total interest expense . . . . . . . . . . . . . . . 9,597,099 26,523 21,440 9,645,062 (2,559,290) 7,085,772
Net interest income (loss) . . . . . . . . . . . . 2,581,212 (26,523) (232) 2,554,457 (966,207) 1,588,250
Less: provisions for loan losses . . . . . . . . 1,393,962 — 607 1,394,569 (379,261) 1,015,308
Net interest income (loss) after provisions
for loan losses . . . . . . . . . . . . . . . . . . 1,187,250 (26,523) (839) 1,159,888 (586,946) 572,942
Fee income . . . . . . . . . . . . . . . . . . . . . . — 335,737 156,429 492,166 — 492,166
Collections revenue . . . . . . . . . . . . . . . . — 269,184 — 269,184 2,363 271,547
Other income . . . . . . . . . . . . . . . . . . . . . 193,810 — 217,655 411,465 (678,069) (266,604)
Total other income (loss). . . . . . . . . . . . . 193,810 604,921 374,084 1,172,815 (675,706) 497,109
Operating expenses(1) . . . . . . . . . . . . . . . 708,508 390,002 341,116 1,439,626 112,221 1,551,847
Income (loss) before income taxes and
minority interest in net earnings of
subsidiaries . . . . . . . . . . . . . . . . . . . . 672,552 188,396 32,129 893,077 (1,374,873) (481,796)
Income tax expense (benefit)(2) . . . . . . . . 248,844 69,707 11,887 330,438 81,845 412,283
Minority interest in net earnings of
subsidiaries . . . . . . . . . . . . . . . . . . . . — 2,315 — 2,315 — 2,315
Net income (loss) . . . . . . . . . . . . . . . . . . $ 423,708 $116,374 $ 20,242 $ 560,324 $(1,456,718) $ (896,394)
(1)
Operating expenses for the Lending, APG, and Corporate and Other reportable segments include $31 million, $11 million, and
$15 million, respectively, of stock option compensation expense, and $19 million, $2 million and $2 million, respectively, of sever-
ance expense.
(2)
Income taxes are based on a percentage of net income before tax for the individual reportable segment.
7
8. SLM CORPORATION
Segment and “Core Earnings”
Consolidated Statements of Income
(In thousands)
Year Ended December 31, 2006
Corporate Total “Core Total
Lending APG and Other Earnings” Adjustments GAAP
(unaudited)
Interest income:
FFELP Stafford and Other Student
Loans. . . . . . . . . . . . . . . . . . . . . . . $ 2,771,236 $ —$ — $ 2,771,236 $(1,362,298) $1,408,938
FFELP Consolidation Loans. . . . . . . . . 4,690,060 — — 4,690,060 (1,144,203) 3,545,857
Private Education Loans . . . . . . . . . . . 2,092,068 — — 2,092,068 (1,070,847) 1,021,221
Other loans . . . . . . . . . . . . . . . . . . . . 97,954 — — 97,954 — 97,954
Cash and investments . . . . . . . . . . . . . 704,336 — 6,989 711,325 (208,323) 503,002
Total interest income . . . . . . . . . . . . . . . 10,355,654 — 6,989 10,362,643 (3,785,671) 6,576,972
Total interest expense . . . . . . . . . . . . . . . 7,877,263 23,150 11,768 7,912,181 (2,789,326) 5,122,855
Net interest income (loss) . . . . . . . . . . . . 2,478,391 (23,150) (4,779) 2,450,462 (996,345) 1,454,117
Less: provisions for loan losses . . . . . . . . 302,498 — 282 302,780 (15,818) 286,962
Net interest income (loss) after provisions
for loan losses . . . . . . . . . . . . . . . . . . 2,175,893 (23,150) (5,061) 2,147,682 (980,527) 1,167,155
Fee income . . . . . . . . . . . . . . . . . . . . . . — 396,830 132,100 528,930 — 528,930
Collections revenue . . . . . . . . . . . . . . . . — 238,970 — 238,970 859 239,829
Other income . . . . . . . . . . . . . . . . . . . . . 177,451 — 155,025 332,476 1,073,036 1,405,512
Total other income (loss). . . . . . . . . . . . . 177,451 635,800 287,125 1,100,376 1,073,895 2,174,271
Operating expenses(1) . . . . . . . . . . . . . . . 645,057 357,797 249,958 1,252,812 93,340 1,346,152
Income (loss) before income taxes and
minority interest in net earnings of
subsidiaries . . . . . . . . . . . . . . . . . . . . 1,708,287 254,853 32,106 1,995,246 28 1,995,274
Income tax expense (benefit)(2) . . . . . . . . 632,067 94,344 11,830 738,241 96,070 834,311
Minority interest in net earnings of
subsidiaries . . . . . . . . . . . . . . . . . . . . — 4,007 — 4,007 — 4,007
Net income (loss) . . . . . . . . . . . . . . . . . . $ 1,076,220 $156,502 $ 20,276 $ 1,252,998 $ (96,042) $1,156,956
(1)
Operating expenses for the Lending, APG, and Corporate and Other reportable segments include $34 million, $12 million, and
$17 million, respectively, of stock option compensation expense.
(2)
Income taxes are based on a percentage of net income before tax for the individual reportable segment.
8
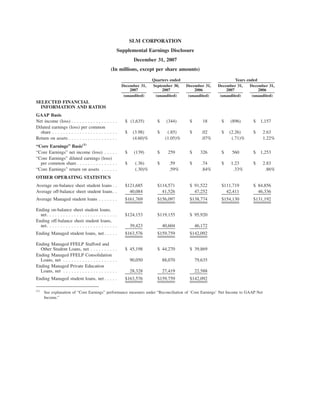
9. SLM CORPORATION
Reconciliation of ‘Core Earnings‘ Net Income to GAAP Net Income
(In thousands, except per share amounts)
Quarters Ended Years Ended
December 31, September 30, December 31, December 31, December 31,
2007 2007 2006 2007 2006
(unaudited) (unaudited) (unaudited) (unaudited) (unaudited)
“Core Earnings” net income (loss)(A) . . . . . . $ (138,569) $ 258,687 $ 325,747 $ 560,324 $1,252,998
“Core Earnings” adjustments:
Net impact of securitization accounting . . . . . (2,547) (157,050) (67,984) 246,817 532,506
Net impact of derivative accounting . . . . . . . . (1,396,683) (453,949) (242,614) (1,340,792) (229,452)
Net impact of Floor Income . . . . . . . . . . . . . . (49,844) (40,390) (51,762) (168,501) (209,445)
Net impact of acquired intangibles . . . . . . . . . (53,452) (18,582) (25,113) (112,397) (93,581)
Total “Core Earnings” adjustments before
income taxes and minority interest in net
earnings of subsidiaries . . . . . . . . . . . . . . . (1,502,526) (669,971) (387,473) (1,374,873) 28
Net tax effect(B) . . . . . . . . . . . . . . . . . . . . . . . 5,837 67,524 79,831 (81,845) (96,070)
Total “Core Earnings” adjustments . . . . . . . . . (1,496,689) (602,447) (307,642) (1,456,718) (96,042)
GAAP net income (loss) . . . . . . . . . . . . . . . . $(1,635,258) $(343,760) $ 18,105 $ (896,394) $1,156,956
GAAP diluted earnings (loss) per common
share . . . . . . . . . . . . . . . . . . . . . . . . . . . . . $ (3.98) $ (.85) $ .02 $ (2.26) $ 2.63
(A)
“Core Earnings” diluted earnings (loss) per common
share . . . . . . . . . . . . . . . . . . . . . . . . . . . . . . . $ (.36) $ .59 $ .74 $ 1.23 $ 2.83
(B)
Such tax effect is based upon the Company’s “Core Earnings” effective tax rate for the year. The net tax effect results primarily from
the exclusion of the permanent income tax impact of the equity forward contracts.
“Core Earnings”
In accordance with the Rules and Regulations of the Securities and Exchange Commission (“SEC”), we
prepare financial statements in accordance with generally accepted accounting principles in the United States
of America (“GAAP”). In addition to evaluating the Company’s GAAP-based financial information, manage-
ment evaluates the Company’s business segments on a basis that, as allowed under SFAS No. 131, “Disclo-
sures about Segments of an Enterprise and Related Information,” differs from GAAP. We refer to
management’s basis of evaluating our segment results as “Core Earnings” presentations for each business
segment and we refer to this information in our presentations with credit rating agencies and lenders. While
“Core Earnings” are not a substitute for reported results under GAAP, we rely on “Core Earnings” to manage
each operating segment because we believe these measures provide additional information regarding the
operational and performance indicators that are most closely assessed by management.
Our “Core Earnings” are not defined terms within GAAP and may not be comparable to similarly titled
measures reported by other companies. “Core Earnings” net income reflects only current period adjustments to
GAAP net income as described below. Unlike financial accounting, there is no comprehensive, authoritative
guidance for management reporting and as a result, our management reporting is not necessarily comparable
with similar information for any other financial institution. Our operating segments are defined by the products
and services they offer or the types of customers they serve, and they reflect the manner in which financial
information is currently evaluated by management. Intersegment revenues and expenses are netted within the
appropriate financial statement line items consistent with the income statement presentation provided to
management. Changes in management structure or allocation methodologies and procedures may result in
9
10. changes in reported segment financial information. A more detailed discussion of the differences between
GAAP and “Core Earnings” follows.
Limitations of “Core Earnings”
While GAAP provides a uniform, comprehensive basis of accounting, for the reasons described above,
management believes that “Core Earnings” are an important additional tool for providing a more complete
understanding of the Company’s results of operations. Nevertheless, “Core Earnings” are subject to certain
general and specific limitations that investors should carefully consider. For example, as stated above, unlike
financial accounting, there is no comprehensive, authoritative guidance for management reporting. Our “Core
Earnings” are not defined terms within GAAP and may not be comparable to similarly titled measures
reported by other companies. Unlike GAAP, “Core Earnings” reflect only current period adjustments to GAAP.
Accordingly, the Company’s “Core Earnings” presentation does not represent a comprehensive basis of
accounting. Investors, therefore, may not compare our Company’s performance with that of other financial
services companies based upon “Core Earnings.” “Core Earnings” results are only meant to supplement GAAP
results by providing additional information regarding the operational and performance indicators that are most
closely used by management, the Company’s board of directors, rating agencies and lenders to assess
performance.
Other limitations arise from the specific adjustments that management makes to GAAP results to derive
“Core Earnings” results. For example, in reversing the unrealized gains and losses that result from
SFAS No. 133, “Accounting for Derivative Instruments and Hedging Activities,” on derivatives that do not
qualify for “hedge treatment,” as well as on derivatives that do qualify but are in part ineffective because they
are not perfect hedges, we focus on the long-term economic effectiveness of those instruments relative to the
underlying hedged item and isolate the effects of interest rate volatility, changing credit spreads and changes
in our stock price on the fair value of such instruments during the period. Under GAAP, the effects of these
factors on the fair value of the derivative instruments (but not on the underlying hedged item) tend to show
more volatility in the short term. While our presentation of our results on a “Core Earnings” basis provides
important information regarding the performance of our Managed portfolio, a limitation of this presentation is
that we are presenting the ongoing spread income on loans that have been sold to a trust managed by us.
While we believe that our “Core Earnings” presentation presents the economic substance of our Managed loan
portfolio, it understates earnings volatility from securitization gains. Our “Core Earnings” results exclude
certain Floor Income, which is real cash income, from our reported results and therefore may understate
earnings in certain periods. Management’s financial planning and valuation of operating results, however, does
not take into account Floor Income because of its inherent uncertainty, except when it is economically hedged
through Floor Income Contracts.
Pre-Tax Differences between “Core Earnings” and GAAP
Our “Core Earnings” are the primary financial performance measures used by management to evaluate
performance and to allocate resources. Accordingly, financial information is reported to management on a
“Core Earnings” basis by reportable segment, as these are the measures used regularly by our chief operating
decision maker. Our “Core Earnings” are used in developing our financial plans and tracking results, and also
in establishing corporate performance targets and determining incentive compensation. Management believes
this information provides additional insight into the financial performance of the Company’s core business
activities. “Core Earnings” net income reflects only current period adjustments to GAAP net income, as
described in the more detailed discussion of the differences between “Core Earnings” and GAAP that follows,
which includes further detail on each specific adjustment required to reconcile our “Core Earnings” segment
presentation to our GAAP earnings.
1) Securitization Accounting: Under GAAP, certain securitization transactions in our Lending operating
segment are accounted for as sales of assets. Under “Core Earnings” for the Lending operating
segment, we present all securitization transactions on a “Core Earnings” basis as long-term non-
recourse financings. The upfront “gains” on sale from securitization transactions as well as ongoing
“servicing and securitization revenue” presented in accordance with GAAP are excluded from “Core
10
11. Earnings” and are replaced by the interest income, provisions for loan losses, and interest expense as
they are earned or incurred on the securitization loans. We also exclude transactions with our off-
balance sheet trusts from “Core Earnings” as they are considered intercompany transactions on a
“Core Earnings” basis.
2) Derivative Accounting: “Core Earnings” exclude periodic unrealized gains and losses arising
primarily in our Lending operating segment, and to a lesser degree in our Corporate and Other
reportable segment, that are caused primarily by the one-sided mark-to-market derivative valuations
prescribed by SFAS No. 133 on derivatives that do not qualify for “hedge treatment” under GAAP. In
our “Core Earnings” presentation, we recognize the economic effect of these hedges, which generally
results in any cash paid or received being recognized ratably as an expense or revenue over the hedged
item’s life. “Core Earnings” also exclude the gain or loss on equity forward contracts that under SFAS
No. 133, are required to be accounted for as derivatives and are marked-to-market through earnings.
3) Floor Income: The timing and amount (if any) of Floor Income earned in our Lending operating
segment is uncertain and in excess of expected spreads. Therefore, we exclude such income from
“Core Earnings” when it is not economically hedged. We employ derivatives, primarily Floor Income
Contracts and futures, to economically hedge Floor Income. As discussed above in “Derivative
Accounting,” these derivatives do not qualify as effective accounting hedges, and therefore, under
GAAP, they are marked-to-market through the “gains (losses) on derivative and hedging activities,
net” line on the income statement with no offsetting gain or loss recorded for the economically hedged
items. For “Core Earnings,” we reverse the fair value adjustments on the Floor Income Contracts and
futures economically hedging Floor Income and include the amortization of net premiums received in
income.
4) Acquired Intangibles: Our “Core Earnings” exclude goodwill and intangible impairment and the
amortization of acquired intangibles.
11
12. SLM CORPORATION
SUPPLEMENTAL FINANCIAL INFORMATION
FOURTH QUARTER 2007
(Dollars in millions, except per share amounts, unless otherwise stated)
This Supplemental Financial Information release contains forward-looking statements and information
that are based on management’s current expectations as of the date of this document. When used in this report,
the words “anticipate,” “believe,” “estimate,” “intend” and “expect” and similar expressions are intended to
identify forward-looking statements. These forward-looking statements are subject to risks, uncertainties,
assumptions and other factors that may cause the actual results to be materially different from those reflected
in such forward-looking statements. These factors include, among others, the occurrence of any event, change
or other circumstances that could give rise to the termination of the merger agreement (the “Merger
Agreement”) for the buyer group (the “Buyer Group”) led by J.C. Flowers & Co. (“J.C. Flowers”), Bank of
America (NYSE:BAC) and JPMorgan Chase (NYSE:JPM) to acquire (the “Merger”) SLM Corporation, more
commonly known as Sallie Mae, and its subsidiaries (collectively, “the Company”); the outcome of any legal
proceedings that may be instituted by us or against us and others related to the Merger Agreement; our ability
to cost-effectively refinance the interim asset-backed commercial paper facilities extended by Bank of America
and JPMorgan Chase for use during the period between executing the Merger Agreement, including any
potential foreclosure on the student loans under those facilities following their termination if the Merger
Agreement is terminated, increased financing costs and more limited liquidity; any adverse outcomes in any
significant litigation to which we are a party; changes in the terms of student loans and the educational credit
marketplace arising from the implementation of applicable laws and regulations and from changes in these
laws and regulations, which may reduce the volume, average term and yields on student loans under the
Federal Family Education Loan Program (“FFELP”) or result in loans being originated or refinanced under
non-FFELP programs or may affect the terms upon which banks and others agree to sell FFELP loans to the
Company. In addition, a larger than expected increase in third-party consolidations of our FFELP loans could
materially adversely affect our results of operations. The Company could also be affected by changes in the
demand for educational financing or in financing preferences of lenders, educational institutions, students and
their families; incorrect estimates or assumptions by management in connection with the preparation of our
consolidated financial statements; changes in the composition of our Managed FFELP and Private Education
Loan portfolios; changes in the general interest rate environment and in the securitization markets for
education loans, which may increase the costs or limit the availability of financings necessary to initiate,
purchase or carry education loans; changes in general economic conditions; changes in projections of losses
from loan defaults; changes in prepayment rates and credit spreads; and changes in the demand for debt
management services and new laws or changes in existing laws that govern debt management services. The
Company does not undertake any obligation to update or revise these forward-looking statements to conform
the statement to actual results or changes in the Company’s expectations.
Definitions for capitalized terms in this document can be found in the Company’s 2006 Form 10-K filed
with the Securities and Exchange Commission (“SEC”) on March 1, 2007.
Certain reclassifications have been made to the balances as of and for the quarter and year ended
December 31, 2006, to be consistent with classifications adopted for the quarter ended December 31, 2007.
12
13. CURRENT BUSINESS TRENDS
Our management team is evaluating certain aspects of our business as a response to the impact of The
College Cost Reduction and Access Act of 2007 (“CCRAA”), and current challenges in the capital markets.
The CCRAA has a number of important implications for the profitability of our FFELP business, including a
reduction in Special Allowance Payments, the elimination of the Exceptional Performer designation and the
corresponding reduction in default payments to 97 percent through 2012 and 95 percent thereafter, an increase
in the lender paid origination fees for certain loan types and reduction in default collections retention fees and
account maintenance fees related to guaranty agency activities. As a result, we expect that the CCRAA will
significantly reduce and, combined with higher financing costs, could possibly eliminate the profitability of
new FFELP loan originations, while increasing our Risk Sharing in connection with our FFELP loan portfolio.
In response to the CCRAA, capital market conditions, and the lower credit rating of the Company, we
plan to be more selective in pursuing origination activity, in both FFELP loans and Private Education Loans.
We plan to curtail less profitable student loan acquisition activities such as spot purchases and Wholesale
Consolidation Loan purchases, which will reduce our funding needs. We expect to see lenders exit the student
loan industry in response to the CCRAA and current conditions in the credit markets, and we therefore expect
to partially offset declining loan volumes caused by our more selective lending policies with increased market
share taken from participants exiting the industry. We expect to continue to focus on generally higher-margin
Private Education Loans, both through our school channel and our direct-to-consumer channel, with particular
attention to continuing more stringent underwriting standards. We also expect to adjust our Private Education
Loan pricing to reflect the current financing and market conditions. In addition, we plan to eliminate offering
certain Borrower Benefits in connection with both our FFELP loans and our Private Education Loans. We plan
to significantly curtail our Private Education lending to students attending schools where loan performance,
due in large part to high withdrawal rates and other factors, is materially below our original expectations. We
will further de-emphasize pursuing incremental Consolidation Loans, as a result of significant margin erosion
for FFELP Consolidation Loans created by the combined effect of the CCRAA and the increased cost of
borrowing in the current capital markets. We will, however, continue our efforts to protect selected FFELP
assets existing in our portfolio. We expect to continue to aggressively pursue other FFELP-related fee income
opportunities such as FFELP loan servicing, guarantor servicing and collections.
DISCUSSION OF CONSOLIDATED RESULTS OF OPERATIONS
Three Months Ended December 31, 2007 Compared to Three Months Ended September 30, 2007
For the three months ended December 31, 2007, our net loss was $1.6 billion, or $3.98 diluted loss per
share, compared to a net loss of $344 million, or $.85 diluted loss per share for the three months ended
September 30, 2007. The effective tax rate for those periods was 5 percent and (33) percent, respectively. The
movement in the effective tax rate was primarily driven by the permanent tax impact of excluding non-taxable
gains and losses on the equity forward contracts which are marked to market through earnings under the
Financial Accounting Standards Board’s (“FASB’s”) Statement of Financial Accounting Standards (“SFAS”)
No. 133, “Accounting for Derivative Instruments and Hedging Activities.” Pre-tax income decreased by
$1.5 billion versus the prior quarter primarily due to an $850 million increase in net losses on derivative and
hedging activities, which was mostly comprised of losses on our equity forward contracts. Losses on derivative
and hedging activities were $1.3 billion in the fourth quarter of 2007 compared to $487 million in the prior
quarter. The Company settled all of its outstanding equity forward contracts in January 2008 (see “LIQUIDITY
AND CAPITAL RESOURCES”).
There were no gains on student loan securitizations in either period because we did not complete any off-
balance sheet securitizations. Our servicing and securitization revenue decreased by $6 million from $29 mil-
lion in the third quarter of 2007 to $23 million in the fourth quarter of 2007. This decrease was primarily due
to a $27 million increase in impairment losses, which was mainly a result of FFELP Stafford Consolidation
Loan activity exceeding expectations, increases in Private Education Loan expected default activity, and an
increase in the discount rate used to value Private Education Loan Residual Interests (see “LIQUIDITY AND
CAPITAL RESOURCES — Retained Interest in Securitized Receivables”).
13
14. Net interest income after provisions for loan losses decreased by $538 million in the fourth quarter versus
the third quarter. This decrease was due to a $107 million decrease in net interest income, as well as a
$431 million increase in provisions for loan losses. The decrease in net interest income was primarily due to a
decrease in the student loan spread, including the impact of Wholesale Consolidation Loans (see “LENDING
BUSINESS SEGMENT — Net Interest Income — Student Loan Spread Analysis — On-Balance Sheet”). The
increase in provisions for loan losses relates to higher provision amounts for Private Education Loans, FFELP
loans, and mortgage loans primarily due to a weakening U.S. economy (see “LENDING BUSINESS
SEGMENT — Allowance for Private Education Loan Losses; and — Total Provisions for Loan Losses”).
In the fourth quarter of 2007, fee and other income and collections revenue totaled $302 million, a
$20 million increase from $282 million in the prior quarter. Operating expenses increased by $85 million from
$356 million in the third quarter of 2007 to $441 million in the fourth quarter of 2007. The increase in
operating expenses was primarily due to severance costs of $23 million, goodwill and acquired intangible
impairments of $37 million, and an increase in Merger-related expenses of $11 million over the third quarter.
As part of the Company’s cost reduction efforts, these severance costs were related to the elimination of
approximately 350 positions (representing three percent of the overall employee population) across all areas of
the Company. Goodwill and intangible impairments primarily related to our mortgage business.
Three Months Ended December 31, 2007 Compared to Three Months Ended December 31, 2006
For the three months ended December 31, 2007, our net loss was $1.6 billion, or $3.98 diluted loss per
share, compared to net income of $18 million, or $.02 diluted earnings per share, for the three months ended
December 31, 2006. The effective tax rate in those periods was 5 percent and 86 percent, respectively. The
movement in the effective tax rate was primarily driven by the permanent tax impact of excluding non-taxable
gains and losses on our equity forward contracts as discussed above. Pre-tax income decreased by $1.9 billion
versus the year-ago quarter, primarily due to a $1.1 billion increase in net losses on derivative and hedging
activities, which was comprised primarily of losses on our equity forward contracts. Losses on derivative and
hedging activities were $1.3 billion in the fourth quarter of 2007 compared to $245 million in the year-ago
quarter.
In the current and year-ago quarters, we did not complete any off-balance sheet securitizations, and as a
result, we did not recognize any securitization gains. In the fourth quarter of 2007, servicing and securitization
income was $23 million, a $161 million decrease from the year-ago quarter. This decrease was primarily due
to a $108 million increase in impairment losses and to a $20 million increase in the unrealized fair value loss
adjustment related to a portion of our Retained Interests that we account for under SFAS No. 155, “Accounting
for Certain Hybrid Financial Instruments,” whereby we carry the Retained Interest at fair value and record
changes to fair value through earnings. Both of these changes were primarily a result of FFELP Stafford
Consolidation Loan activity exceeding expectations, increases in Private Education Loan expected default
activity and an increase in the discount rate used to value our Private Education Loan Residual Interests (see
“LIQUIDITY AND CAPITAL RESOURCES — Retained Interest in Securitized Receivables”).
Net interest income after provisions for loan losses decreased by $520 million versus the fourth quarter of
2006. The decrease was due to a $38 million decrease in net interest income and a $482 million increase in
the provisions for loan losses. The decrease in net interest income was primarily due to a decrease in the
student loan spread, including the impact of Wholesale Consolidation Loans (see “LENDING BUSINESS
SEGMENT — Net Interest Income — Student Loan Spread Analysis — On-Balance Sheet”), partially offset by
a $30 billion increase in the average balance of student loans. The increase in provisions for loan losses relates
to higher provision amounts for Private Education Loans, FFELP loans, and mortgage loans primarily due to a
weakening U.S. economy (see “LENDING BUSINESS SEGMENT — Allowance for Private Education Loan
Losses; and — Total Provisions for Loan Losses”).
Fee and other income and collections revenue increased $15 million from $287 million in the fourth
quarter of 2006 to $302 million in the fourth quarter of 2007. Operating expenses were $441 million for the
fourth quarter of 2007, an increase of $88 million compared to $353 million for the fourth quarter of 2006.
The increase in operating expenses was primarily due to current-quarter severance costs of $23 million,
14
15. goodwill and acquired intangible impairments of $37 million, primarily related to our mortgage business, and
Merger-related expenses of $15 million.
Year Ended December 31, 2007 Compared to Year Ended December 31, 2006
For the year ended December 31, 2007, our net loss was $896 million, or $2.26 diluted loss per share,
compared to net income of $1.2 billion, or $2.63 diluted earnings per share, in the year-ago period. The
effective tax rate in those periods was 86 percent and 42 percent, respectively. Pre-tax income decreased by
$2.5 billion versus the year ended December 31, 2006 primarily due to a $1.0 billion increase in net losses on
derivative and hedging activities, which was mostly comprised of losses on our equity forward contracts.
Losses on derivative and hedging activities were $1.4 billion for the year ended December 31, 2007 compared
to $339 million for the year ended December 31, 2006.
Pre-tax income for the year ended December 31, 2007 also decreased versus the year ended December 31,
2006 due to a $535 million decrease in gains on student loan securitizations. The securitization gain in 2007
was the result of one Private Education Loan securitization that had a pre-tax gain of $367 million or
18.4 percent of the amount securitized. In the year-ago period, there were three Private Education Loan
securitizations that had total pre-tax gains of $830 million or 16.3 percent of the amount securitized. For the
year ended December 31, 2007, servicing and securitization income was $437 million, a $116 million decrease
from the year ended December 31, 2006. This decrease was primarily due to a $97 million increase in
impairment losses which was mainly the result of FFELP Stafford Consolidation Loan activity exceeding
expectations, increased Private Education Consolidation Loan activity, increased Private Education Loan
expected default activity, and an increase in the discount rate used to value the Private Education Loan
Residual Interests (see “LIQUIDITY AND CAPITAL RESOURCES — Retained Interest in Securitized
Receivables”).
Net interest income after provisions for loan losses decreased by $594 million versus the year ended
December 31, 2006. The decrease was due to the year-over-year increase in the provisions for loan losses of
$728 million, which offset the year-over-year $134 million increase in net interest income. The increase in net
interest income was primarily due to an increase of $30.8 billion in the average balance of on-balance sheet
interest earning assets offset by a decrease in the student loan spread, including the impact of Wholesale
Consolidation Loans (see “LENDING BUSINESS SEGMENT — Net Interest Income — Student Loan Spread
Analysis — On-Balance Sheet”). The increase in provisions for loan losses relates to higher provision amounts
for Private Education Loans, FFELP loans, and mortgage loans primarily due to a weakening U.S. economy
(see “LENDING BUSINESS SEGMENT — Allowance for Private Education Loan Losses; and — Total
Provisions for Loan Losses”).
Fee and other income and collections revenue increased $42 million from $1.11 billion for the year ended
December 30, 2006 to $1.15 billion for the year ended December 31, 2007. Operating expenses increased by
$206 million year-over-year. This increase in operating expenses was primarily due to $56 million in Merger-
related expenses and $23 million in severance costs incurred in 2007. Operating expenses in 2007 also
included $93 million related to a full year of expenses for Upromise compared to $33 million incurred in 2006
subsequent to the August 2006 acquisition of this subsidiary.
15
16. EARNINGS RELEASE SUMMARY
The following table summarizes GAAP income statement items that are disclosed separately in the
Company’s press releases of earnings or the Company’s quarterly earnings conference calls for the quarters
ended December 31, 2007 and September 30, 2007, and for the year ended December 31, 2007.
Quarters ended Year ended
December 31, September 30, December 31,
(in thousands) 2007 2007 2007
Reported net (loss) . . . . . . . . . . . . . . . . . . . . . . . . . . . . . . . . . . . $(1,635,258) $(343,760) $(896,394)
Preferred stock dividends . . . . . . . . . . . . . . . . . . . . . . . . . . . . . . (9,622) (9,274) (37,145)
Reported net (loss) attributable to common stock . . . . . . . . . . . . . (1,644,880) (353,034) (933,539)
Expense items disclosed separately (tax-effected):
Impact to FFELP provision for loan losses due to legislative
changes. . . . . . . . . . . . . . . . . . . . . . . . . . . . . . . . . . . . . . . . . . — 18,748 18,748
Merger-related financing fees(1) . . . . . . . . . . . . . . . . . . . . . . . . . . 7,833 10,791 27,463
Merger-related professional fees and other costs. . . . . . . . . . . . . . 9,286 2,580 35,456
Severance costs. . . . . . . . . . . . . . . . . . . . . . . . . . . . . . . . . . . . . . 14,178 — 14,178
Total expense items disclosed separately (tax-effected) . . . . . . . . . 31,297 32,119 95,845
Net (loss) attributable to common stock excluding the impact of
items disclosed separately . . . . . . . . . . . . . . . . . . . . . . . . . . . . $(1,613,583) $(320,915) $(837,694)
Average common and common equivalent shares outstanding(2) . . 413,049 412,944 412,233
(1)
Merger-related financing fees or “Interim ABCP Facility fees” are the commitment and liquidity fees related to a financing facility in
connection with the Merger. See “LIQUIDITY AND CAPITAL RESOURCES.”
(2)
Common equivalent shares outstanding were anti-dilutive for all periods presented.
16
17. The following table summarizes “Core Earnings” income statement items that are disclosed separately in
the Company’s press releases of earnings or the Company’s quarterly earnings conference calls for the quarters
ended December 31, 2007 and September, 30, 2007, and for the year ended December 31, 2007.
Quarters ended Year Ended
December 31, September 30, December 31,
(in thousands) 2007 2007 2007
“Core Earnings” net income (loss) . . . . . . . . . . . . . . . . . . . . . . . . $(138,569) $258,687 $560,324
Preferred stock dividends. . . . . . . . . . . . . . . . . . . . . . . . . . . . . . . (9,622) (9,274) (37,145)
“Core Earnings” net income (loss) attributable to common
stock . . . . . . . . . . . . . . . . . . . . . . . . . . . . . . . . . . . . . . . . . . . . (148,191) 249,413 523,179
Expense items disclosed separately (tax-effected):
Impact to FFELP provision for loan losses due to legislative
changes . . . . . . . . . . . . . . . . . . . . . . . . . . . . . . . . . . . . . . . . . . — 27,726 27,726
Merger-related financing fees(1) . . . . . . . . . . . . . . . . . . . . . . . . . . 7,833 10,791 27,463
Merger-related professional fees and other costs . . . . . . . . . . . . . . 9,286 2,580 35,456
Severance costs . . . . . . . . . . . . . . . . . . . . . . . . . . . . . . . . . . . . . . 14,178 — 14,178
Total expense items disclosed separately (tax-effected) . . . . . . . . . 31,297 41,097 104,823
“Core Earnings” net income (loss) attributable to common stock
excluding the impact of items disclosed separately . . . . . . . . . . (116,894) 290,510 628,002
Adjusted for debt expense of contingently convertible debt
instruments (“Co-Cos”), net of tax(2) . . . . . . . . . . . . . . . . . . . . — 4,662 —
“Core Earnings” net income (loss) attributable to common stock,
adjusted . . . . . . . . . . . . . . . . . . . . . . . . . . . . . . . . . . . . . . . . . $(116,894) $295,172 $628,002
Average common and common equivalent shares
outstanding(2)(3) . . . . . . . . . . . . . . . . . . . . . . . . . . . . . . . . . . . . 413,049 431,750 426,943
(1)
Merger-related financing fees or “Interim ABCP Facility fees” are the commitment and liquidity fees related to a financing facility in
connection with the Merger. See “LIQUIDITY AND CAPITAL RESOURCES.”
(2)
There is no impact on diluted earnings (loss) per common share for the fourth quarter of 2007 and for the year ended December 31,
2007, because the effect of assumed conversion was anti-dilutive; the Co-Cos were called at par on July 25, 2007.
(3)
Common equivalent shares outstanding were anti-dilutive for the fourth quarter of 2007.
BUSINESS SEGMENTS
The results of operations of the Company’s Lending, Asset Performance Group (“APG”), formerly known
as Debt Management Operations (“DMO”), and Corporate and Other business segments are presented below.
The Lending business segment section includes all discussion of income and related expenses associated
with the net interest margin, the student loan spread and its components, the provisions for loan losses, and
other fees earned on our Managed portfolio of student loans. The APG business segment reflects the fees
earned and expenses incurred in providing accounts receivable management and collection services. Our
Corporate and Other reportable segment includes our remaining fee businesses and other corporate expenses
that do not pertain directly to the primary segments identified above.
LENDING BUSINESS SEGMENT
In our Lending business segment, we originate and acquire federally guaranteed student loans, which are
administered by the U.S. Department of Education (“ED”), and Private Education Loans, which are not
federally guaranteed. The majority of our Private Education Loans is made in conjunction with a FFELP
Stafford loan and as a result is marketed through the same marketing channels as FFELP Stafford loans. While
FFELP loans and Private Education Loans have different overall risk profiles due to the federal guarantee of
17
18. the FFELP loans, they share many of the same characteristics such as similar repayment terms, the same
marketing channel and sales force, and are originated and serviced on the same servicing platform. Finally,
where possible, the borrower receives a single bill for both the federally guaranteed and privately underwritten
loans.
The following table includes “Core Earnings” results for our Lending business segment.
Quarters ended Years ended
December 31, September 30, December 31, December 31, December 31,
2007 2007 2006 2007 2006
“Core Earnings” interest income:
FFELP Stafford and Other
Student Loans . . . . . . . . . . . . $ 705 $ 729 $ 701 $ 2,848 $ 2,771
FFELP Consolidation Loans . . . . 1,355 1,445 1,306 5,522 4,690
Private Education Loans . . . . . . . 731 753 620 2,835 2,092
Other loans . . . . . . . . . . . . . . . . 25 26 27 106 98
Cash and investments . . . . . . . . . 273 251 197 868 705
Total “Core Earnings” interest
income. . . . . . . . . . . . . . . . . . . . 3,089 3,204 2,851 12,179 10,356
Total “Core Earnings” interest
expense . . . . . . . . . . . . . . . . . . . 2,471 2,534 2,190 9,597 7,877
Net “Core Earnings” interest
income. . . . . . . . . . . . . . . . . . . . 618 670 661 2,582 2,479
Less: provisions for losses . . . . . . . 750 200 88 1,394 303
Net “Core Earnings” interest
income (loss) after provisions for
losses. . . . . . . . . . . . . . . . . . . . . (132) 470 573 1,188 2,176
Other income . . . . . . . . . . . . . . . . . 44 46 40 194 177
Operating expenses . . . . . . . . . . . . 191 164 164 709 645
Income (loss) before income
taxes . . . . . . . . . . . . . . . . . . . . . (279) 352 449 673 1,708
Income tax expense (benefit) . . . . . (103) 130 166 249 632
“Core Earnings” net income
(loss) . . . . . . . . . . . . . . . . . . . . . $ (176) $ 222 $ 283 $ 424 $ 1,076
Net Interest Income
The changes in net interest income are primarily due to fluctuations in the student loan spread discussed
below, as well as the growth of our student loan portfolio and the level of cash and investments we may hold
on our balance sheet for liquidity purposes. In connection with the Merger Agreement, we increased our
liquidity portfolio to higher than historical levels. The liquidity portfolio has a negative net interest margin,
and as a result, the increase in this portfolio reduced net interest income by $10 million and $8 million for the
three months ended December 31, 2007 and September 30, 2007, respectively.
18
19. Student Loan Spread Analysis — On-Balance Sheet
The following table analyzes the reported earnings from student loans on-balance sheet, before provision
and before the effect of Wholesale Consolidation Loans.
Quarters ended Years ended
December 31, September 30, December 31, December 31, December 31,
2007 2007 2006 2007 2006
Student loan spread, before Interim
ABCP Facility Fees . . . . . . . . . . 1.30% 1.69% 1.61% 1.57% 1.69%
Interim ABCP Facility Fees . . . . . . (.04) (.06) — (.04) —
Student loan spread(1) . . . . . . . . . . . 1.26% 1.63% 1.61% 1.53% 1.69%
(1)
Student loan spread after the impact of
Wholesale Consolidation Loans. . . . . . . 1.17% 1.53% 1.58% 1.44% 1.68%
The decrease in the student loan spread was primarily due to an increase in our cost of funds. Our cost of
funds for on-balance sheet student loans excludes the impact of basis swaps that economically hedge the re-
pricing and basis mismatch between our funding and student loan asset indices, but do not receive hedge
accounting treatment under SFAS No. 133. We extensively use basis swaps to manage our basis risk associated
with our interest rate sensitive assets and liabilities. These swaps generally do not qualify as accounting
hedges, and as a result, are required to be accounted for in the “gains (losses) on derivatives and hedging
activities, net” line on the income statement, as opposed to being accounted for in interest expense. As a
result, these basis swaps are not considered in the calculation of the cost of funds in the above table. As a
result, in times of volatile movements of interest rates like those experienced in the fourth quarter of 2007, the
student loan spread in the above table can significantly change. See “Student Loan Spread Analysis — ‘Core
19
20. Earnings’ Basis,” in the following table, which reflects these basis swaps in interest expense, and demonstrates
the economic hedge effectiveness of these basis swaps.
The decrease in the student loan spread was also due to an increase in the estimate of uncollectible
accrued interest related to our Private Education Loans (see “Student Loan Spread Analysis — ‘Core Earnings’
Basis,” in the following table).
Student Loan Spread Analysis — “Core Earnings” Basis
The following table reflects the “Core Earnings” basis student loan spreads by product, before provision
and before the effect of Wholesale Consolidation Loans.
Quarters ended Years ended
December 31, September 30, December 31, December 31, December 31,
2007 2007 2006 2007 2006
FFELP Loan Spread, before
Interim ABCP Facility Fees . . . . .97% 1.02% 1.20% 1.04% 1.26%
Private Education Loan Spread,
before Interim ABCP Facility
Fees(1) . . . . . . . . . . . . . . . . . . . . 4.70 5.43 5.28 5.15 5.13
“Core Earnings” basis student loan
spread, before Interim ABCP
Facility Fees . . . . . . . . . . . . . . . 1.67 1.81 1.86 1.77 1.84
Interim ABCP Facility Fees . . . . . . (.03) (.04) — (.03) —
“Core Earnings” basis student loan
spread(2) . . . . . . . . . . . . . . . . . . . 1.64% 1.77% 1.86% 1.74% 1.84%
(1)
Private Education Loan Spread, before
Interim ABCP Facility Fees and after
provision for losses. . . . . . . . . . . . . . . (4.49)% 3.29% 3.87% .44% 3.75%
(2)
“Core Earnings” basis student loan
spread after the impact of Wholesale
Consolidation Loans . . . . . . . . . . . . . . 1.56% 1.69% 1.83% 1.67% 1.84%
The Company’s “Core Earnings” basis student loan spread before Interim ABCP Facility Fees and the
impact of Wholesale Consolidation Loans decreased 14 basis points from the prior quarter primarily due to the
interest income reserve on our Private Education Loans. We estimate the amount of Private Education Loan
accrued interest on our balance sheet that is not reasonably expected to be collected in the future using a
methodology consistent with the status-based migration analysis used for the allowance for Private Education
Loans. We use this estimate to offset accrued interest in the current period through a charge to student loan
interest income. As our provision for loan losses increased significantly in the fourth quarter of 2007, we had
a similar rise in the estimate of uncollectible accrued interest receivable.
The Company’s “Core Earnings” basis student loan spread before Interim ABCP Facility Fees and the
impact of Wholesale Consolidation Loans remained relatively consistent over all periods presented above,
excluding the impact of the interest reserving method discussed above. The primary drivers of changes in the
spread are changes in portfolio composition, Borrower Benefits, premium amortization, and cost of funds. The
FFELP loan spread declined over all periods presented above primarily as the mix of the FFELP portfolio
shifted toward the lower yielding Consolidation Loan product. The Private Education Loan spreads before
provision, excluding the impact of the interest reserving method discussed above, continued to increase due
primarily to a change in the mix of the portfolio to more direct-to-consumer loans (Tuition AnswerSM loans).
The changes in the Private Education Loan spreads after provision for all periods was primarily due to the
timing and amount of provision associated with our allowance for Private Education Loan Losses as discussed
below in “Allowance for Private Education Loan Losses.”
20
21. Allowance for Private Education Loan Losses
The following tables summarize changes in the allowance for Private Education Loan losses for the
quarters ended December 31, 2007, September 30, 2007, and December 31, 2006, and for the years ended
December 31, 2007 and 2006.
Activity in Allowance for Private Education Loan Losses
On-balance sheet Off-balance sheet Managed basis
Quarters ended Quarters ended Quarters ended
December 31, September 30, December 31, December 31, September 30, December 31, December 31, September 30, December 31,
2007 2007 2006 2007 2007 2006 2007 2007 2006
Allowance at beginning
of period . . . . . . . . . $ 454 $ 428 $ 275 $ 199 $ 183 $ 100 $ 653 $ 611 $ 375
Provision for Private
Education Loan
losses . . . . . . . . . . . 503 100 83 164 44 (4) 667 144 79
Charge-offs . . . . . . . . . (80) (82) (54) (29) (28) (10) (109) (110) (64)
Recoveries . . . . . . . . . 9 8 4 — — — 9 8 4
Net charge-offs . . . . . . . (71) (74) (50) (29) (28) (10) (100) (102) (60)
Balance before
securitization of
Private Education
Loans . . . . . . . . . . . 886 454 308 334 199 86 1,220 653 394
Reduction for
securitization of
Private Education
Loans . . . . . . . . . . . — — — — — — — — —
Allowance at end of
period . . . . . . . . . . . $ 886 $ 454 $ 308 $ 334 $ 199 $ 86 $ 1,220 $ 653 $ 394
Net charge-offs as a
percentage of average
loans in repayment
(annualized) . . . . . . . 4.39% 5.12% 4.45% 1.53% 1.60% .70% 2.87% 3.16% 2.26%
Net charge-offs as a
percentage of average
loans in repayment and
forbearance
(annualized) . . . . . . . 3.88% 4.61% 4.12% 1.29% 1.38% .61% 2.48% 2.78% 2.02%
Allowance as a
percentage of the
ending total loan
balance . . . . . . . . . . 5.64% 3.21% 3.06% 2.41% 1.43% .66% 4.13% 2.33% 1.71%
Allowance as a
percentage of ending
loans in repayment . . . 12.57% 7.70% 6.36% 4.28% 2.88% 1.26% 8.21% 5.10% 3.38%
Average coverage of net
charge-offs
(annualized) . . . . . . . 3.12 1.56 1.57 2.97 1.74 1.98 3.08 1.61 1.64
Average total loans . . . . $15,007 $12,706 $ 9,289 $13,795 $13,978 $12,944 $28,802 $26,684 $22,233
Ending total loans . . . . . $15,704 $14,130 $10,063 $13,844 $13,942 $12,919 $29,548 $28,072 $22,982
Average loans in
repayment . . . . . . . . $ 6,471 $ 5,696 $ 4,416 $ 7,362 $ 7,124 $ 6,196 $13,833 $12,820 $10,612
Ending loans in
repayment . . . . . . . . $ 7,047 $ 5,896 $ 4,851 $ 7,819 $ 6,903 $ 6,792 $14,866 $12,799 $11,643
21
22. Activity in Allowance for Private Education Loan Losses
On-balance sheet Off-balance sheet Managed basis
Years ended Years ended Years ended
December 31, December 31, December 31, December 31, December 31, December 31,
2007 2006 2007 2006 2007 2006
Allowance at beginning of period . . $ 308 $ 204 $ 86 $ 78 $ 394 $ 282
Provision for Private Education
Loan losses . . . . . . . . . . . . . . . . 884 258 349 15 1,233 273
Charge-offs . . . . . . . . . . . . . . . . . . (332) (160) (107) (24) (439) (184)
Recoveries . . . . . . . . . . . . . . . . . . . 32 23 — — 32 23
Net charge-offs . . . . . . . . . . . . . . . (300) (137) (107) (24) (407) (161)
Balance before securitization of
Private Education Loans . . . . . . . 892 325 328 69 1,220 394
Reduction for securitization of
Private Education Loans . . . . . . . (6) (17) 6 17 — —
Allowance at end of period . . . . . . $ 886 $ 308 $ 334 $ 86 $ 1,220 $ 394
Net charge-offs as a percentage of
average loans in repayment . . . . . 5.04% 3.22% 1.46% .43% 3.07% 1.62%
Net charge-offs as a percentage of
average loans in repayment and
forbearance . . . . . . . . . . . . . . . . 4.54% 2.99% 1.27% .38% 2.71% 1.47%
Allowance as a percentage of the
ending total loan balance . . . . . . 5.64% 3.06% 2.41% .66% 4.13% 1.71%
Allowance as a percentage of
ending loans in repayment . . . . . 12.57% 6.36% 4.28% 1.26% 8.21% 3.38%
Average coverage of net charge-
offs . . . . . . . . . . . . . . . . . . . . . . 2.95 2.25 3.13 3.46 3.00 2.44
Average total loans. . . . . . . . . . . . . $12,507 $ 8,585 $13,683 $11,138 $26,190 $19,723
Ending total loans . . . . . . . . . . . . . $15,704 $10,063 $13,844 $12,919 $29,548 $22,982
Average loans in repayment . . . . . . $ 5,949 $ 4,257 $ 7,305 $ 5,721 $13,254 $ 9,978
Ending loans in repayment . . . . . . . $ 7,047 $ 4,851 $ 7,819 $ 6,792 $14,866 $11,643
As the Private Education Loan portfolio seasons and due to shifts in its mix and certain economic factors,
we expected and have seen charge-off rates increase from the historically low levels experienced in prior
years. Additionally, this increase was significantly impacted by other factors. Toward the end of 2006 and
through mid-2007, we experienced lower pre-default collections, resulting in increased levels of charge-off
activity in our Private Education Loan portfolio. In the second half of 2006, we relocated responsibility for
certain Private Education Loan collections from our Nevada call center to a new call center in Indiana. This
transfer presented us with unexpected operational challenges that resulted in lower collections that have
negatively impacted the Private Education Loan portfolio. In addition, in late 2006, we revised certain
procedures, including our use of forbearance, to better optimize our long-term collection strategies. These
developments resulted in lower pre-default collections, increased later stage delinquency levels and higher
charge-offs. Due to the remedial actions in place, we anticipate the negative trends caused by the operational
difficulties will improve in 2008.
In the fourth quarter of 2007 the Company recorded provision expense of $667 million related to the
Managed Private Education Portfolio. This significant increase in provision primarily relates to the non-
traditional (higher risk) portion of our loan portfolio which is particularly impacted by the weakening
U.S. economy as evidenced by recently released economic indicators, certain credit-related trends in our
portfolio and a further tightening of forbearance practices. We charge off loans after 212 days of delinquency.
Accordingly, we believe current quarter charge-offs represent losses incurred at the onset of the current
22
23. economic downturn and do not incorporate the general economic downturn that became evident in the fourth
quarter of 2007. In addition, with loans to traditional schools and students, we have been able to mitigate our
losses during varying economic environments through the use of forbearance and other collection management
strategies. With the continued weakening of the U.S. economy and the projected continued recessionary
conditions, we believe that those strategies as they relate to the non-traditional portion of the loan portfolio
will not be as effective as they have been in the past. For these reasons, we recorded additional provision in
the fourth quarter, raising our allowance for Private Education Loans to over 8 percent of loans in repayments
as of December 31, 2007.
The Company’s Private Education lending programs have historically focused on traditional students attending
traditional degree granting programs. In the past few years, the Company began to expand its lending activities to
non-traditional students and to students attending non-traditional schools. We have taken actions to terminate these
non-traditional loan programs because the performance of these loans is materially different from that of the loans
in our traditional loan programs. As a result, we have provided for losses that we believe to exist in the portfolio as
a result of our additional data, our plans to terminate certain programs and the current economic conditions.
Private Education Loan Delinquencies
The tables below present our Private Education Loan delinquency trends as of December 31, 2007,
September 30, 2007, and December 31, 2006.
On-Balance Sheet Private Education
Loan Delinquencies
December 31, September 30, December 31,
2007 2007 2006
Balance % Balance % Balance %
(1)
Loans in-school/grace/deferment . . . . . . . . . . . . . . $ 8,151 $ 7,966 $ 5,218
in forbearance(2) . . . . . . . . . . . . . . . . . . . . . . .
Loans 974 701 359
Loans in repayment and percentage of each status:
Loans current . . . . . . . . . . . . . . . . . . . . . . . . . . . . . . 6,236 88.5% 5,186 88.0% 4,214 86.9%
delinquent 31-60 days(3) . . . . . . . . . . . . . . . . .
Loans 306 4.3 275 4.7 250 5.1
delinquent 61-90 days(3) . . . . . . . . . . . . . . . . .
Loans 176 2.5 156 2.6 132 2.7
delinquent greater than 90 days(3) . . . . . . . . . .
Loans 329 4.7 279 4.7 255 5.3
Total Private Education Loans in repayment . . . . . . . 7,047 100% 5,896 100% 4,851 100%
Total Private Education Loans, gross . . . . . . . . . . . . . 16,172 14,563 10,428
Private Education Loan unamortized discount . . . . . . (468) (433) (365)
Total Private Education Loans . . . . . . . . . . . . . . . . . . 15,704 14,130 10,063
Private Education Loan allowance for losses . . . . . . . (886) (454) (308)
Private Education Loans, net . . . . . . . . . . . . . . . . . . . $14,818 $13,676 $ 9,755
Percentage of Private Education Loans in
repayment . . . . . . . . . . . . . . . . . . . . . . . . . . . . . . . 43.6% 40.5% 46.5%
Delinquencies as a percentage of Private Education
Loans in repayment . . . . . . . . . . . . . . . . . . . . . . . . 11.5% 12.0% 13.1%
Loans in forbearance as a percentage of loans in
repayment and forbearance . . . . . . . . . . . . . . . . . . 12.1% 10.6% 6.9%
(1)
Loans for borrowers who still may be attending school or engaging in other permitted educational activities and are not yet required
to make payments on the loans, e.g., residency periods for medical students or a grace period for bar exam preparation.
(2)
Loans for borrowers who have requested extension of grace period generally during employment transition or who have temporarily ceased
making full payments due to hardship or other factors, consistent with the established loan program servicing policies and procedures.
(3)
The period of delinquency is based on the number of days scheduled payments are contractually past due.
23