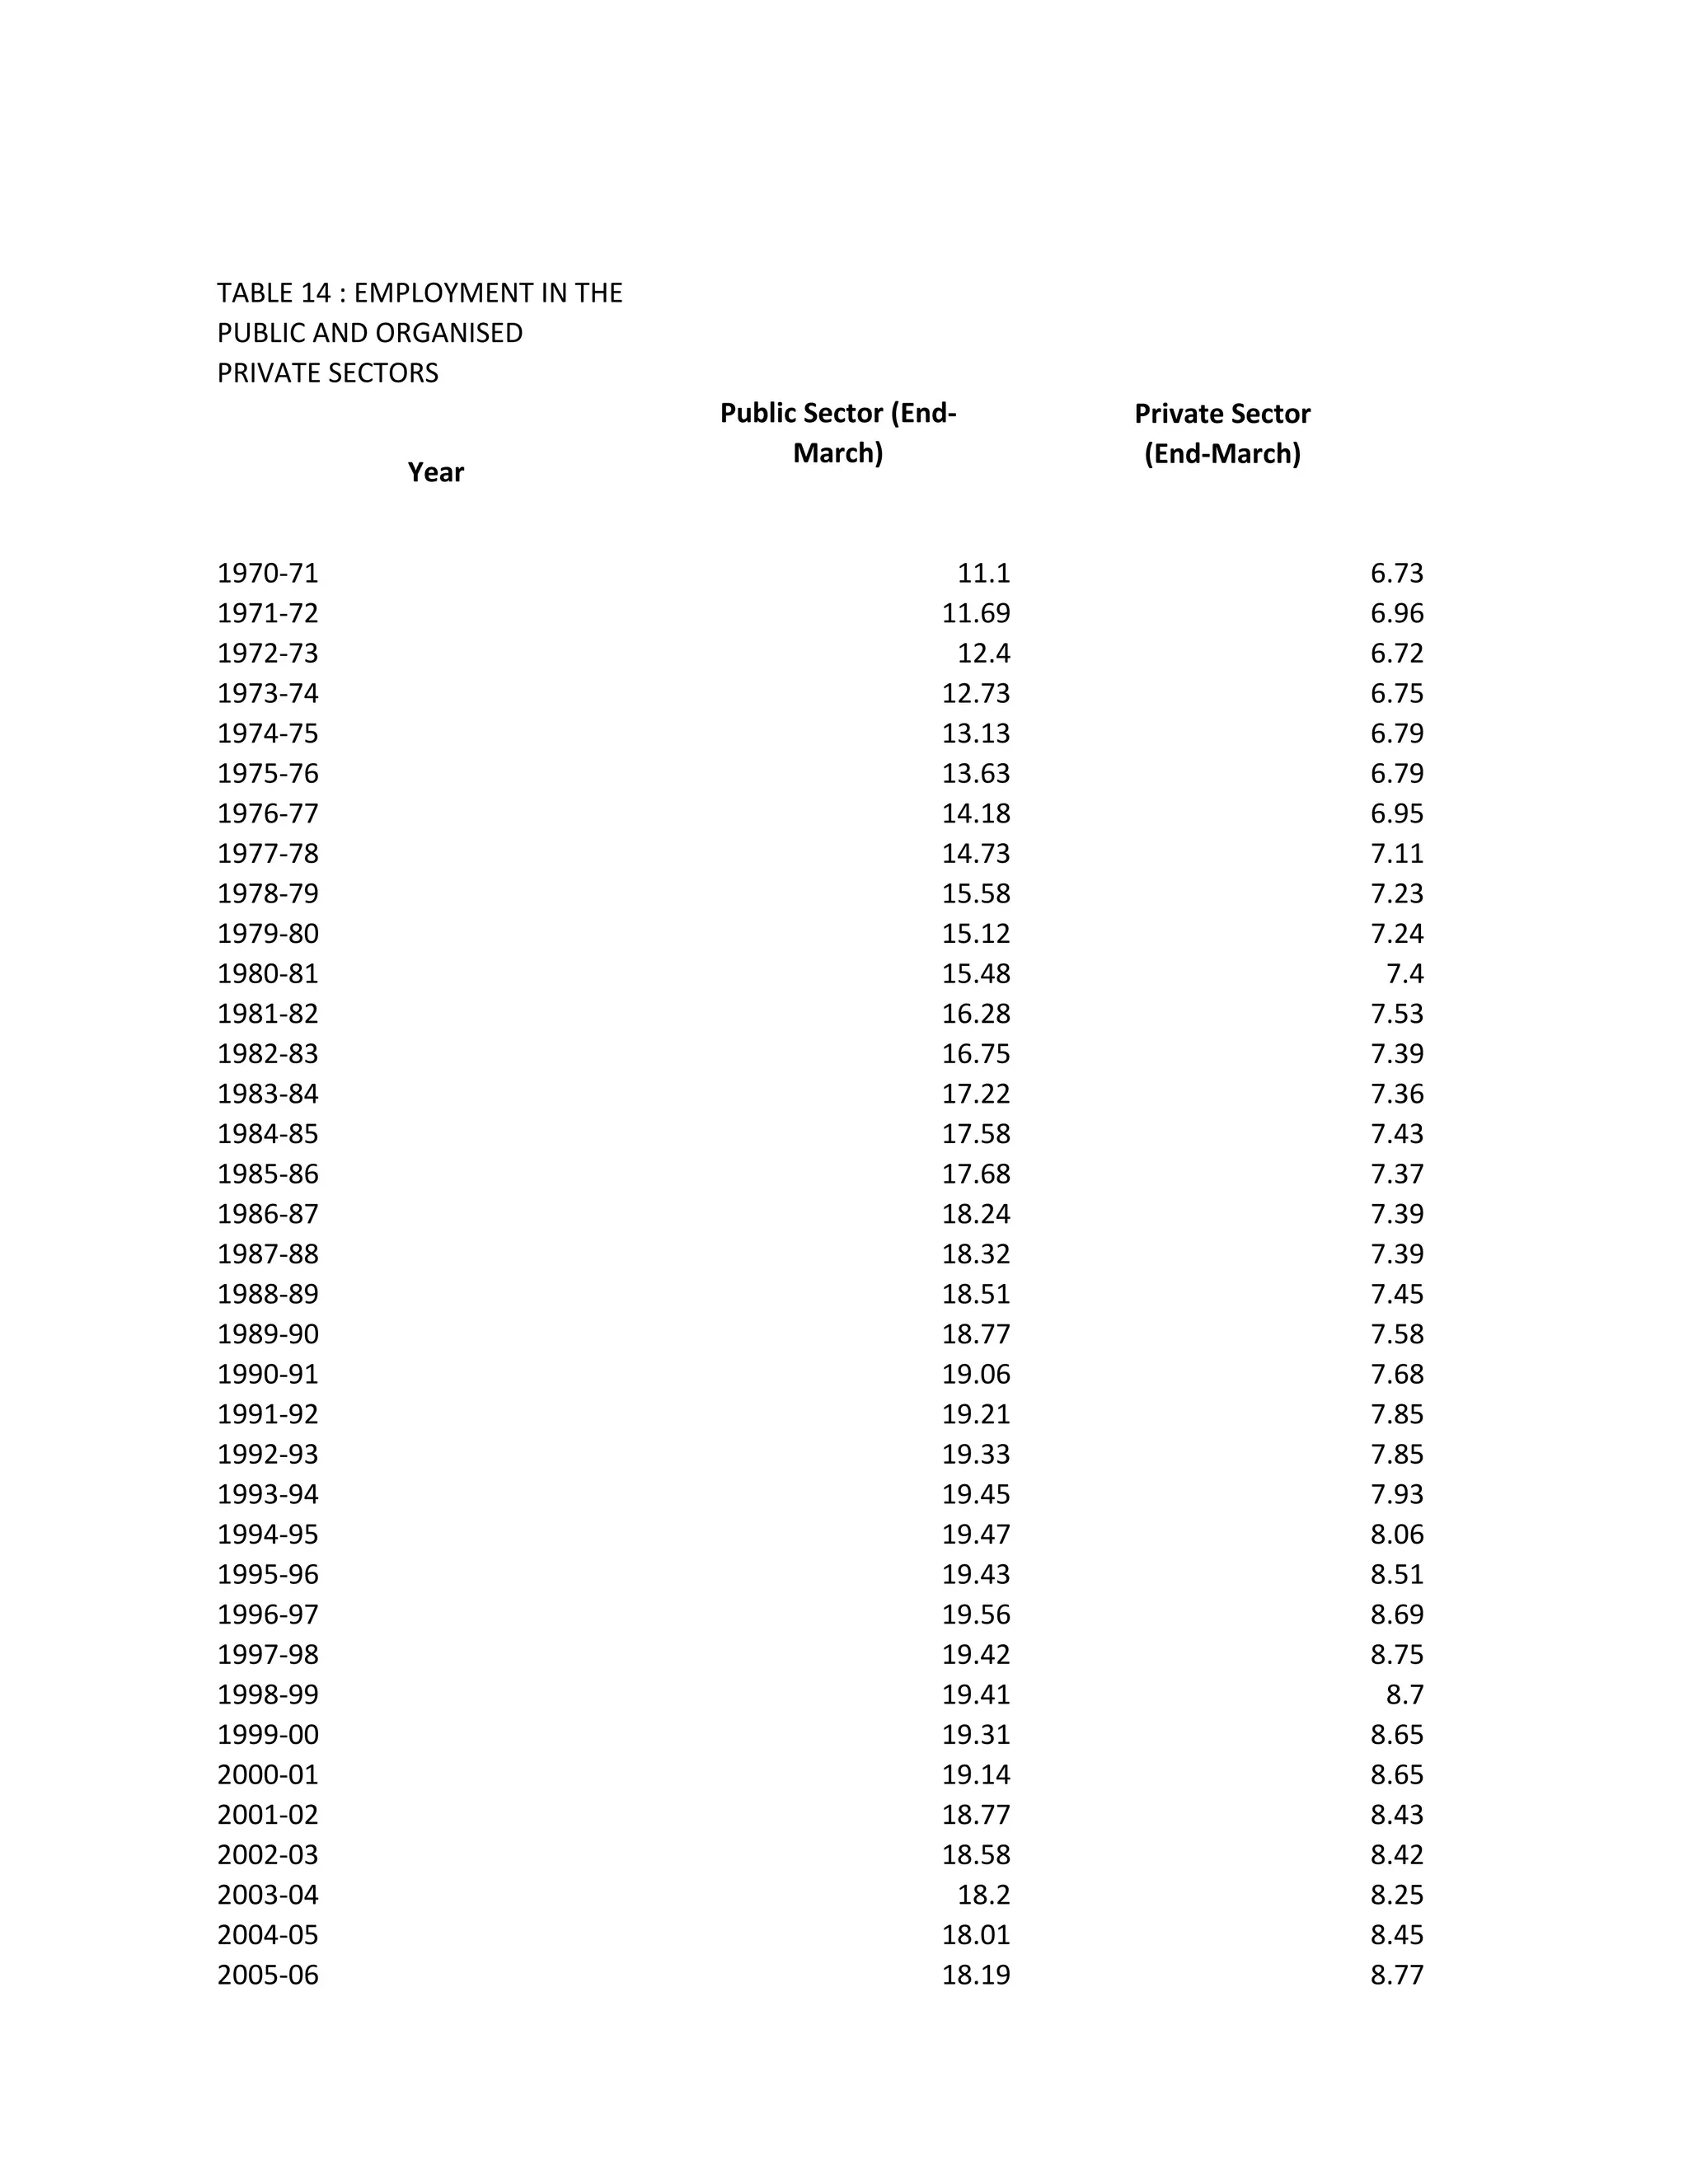
The document shows employment figures for India's public and private sectors from 1970-71 to 2007-08. It indicates that:
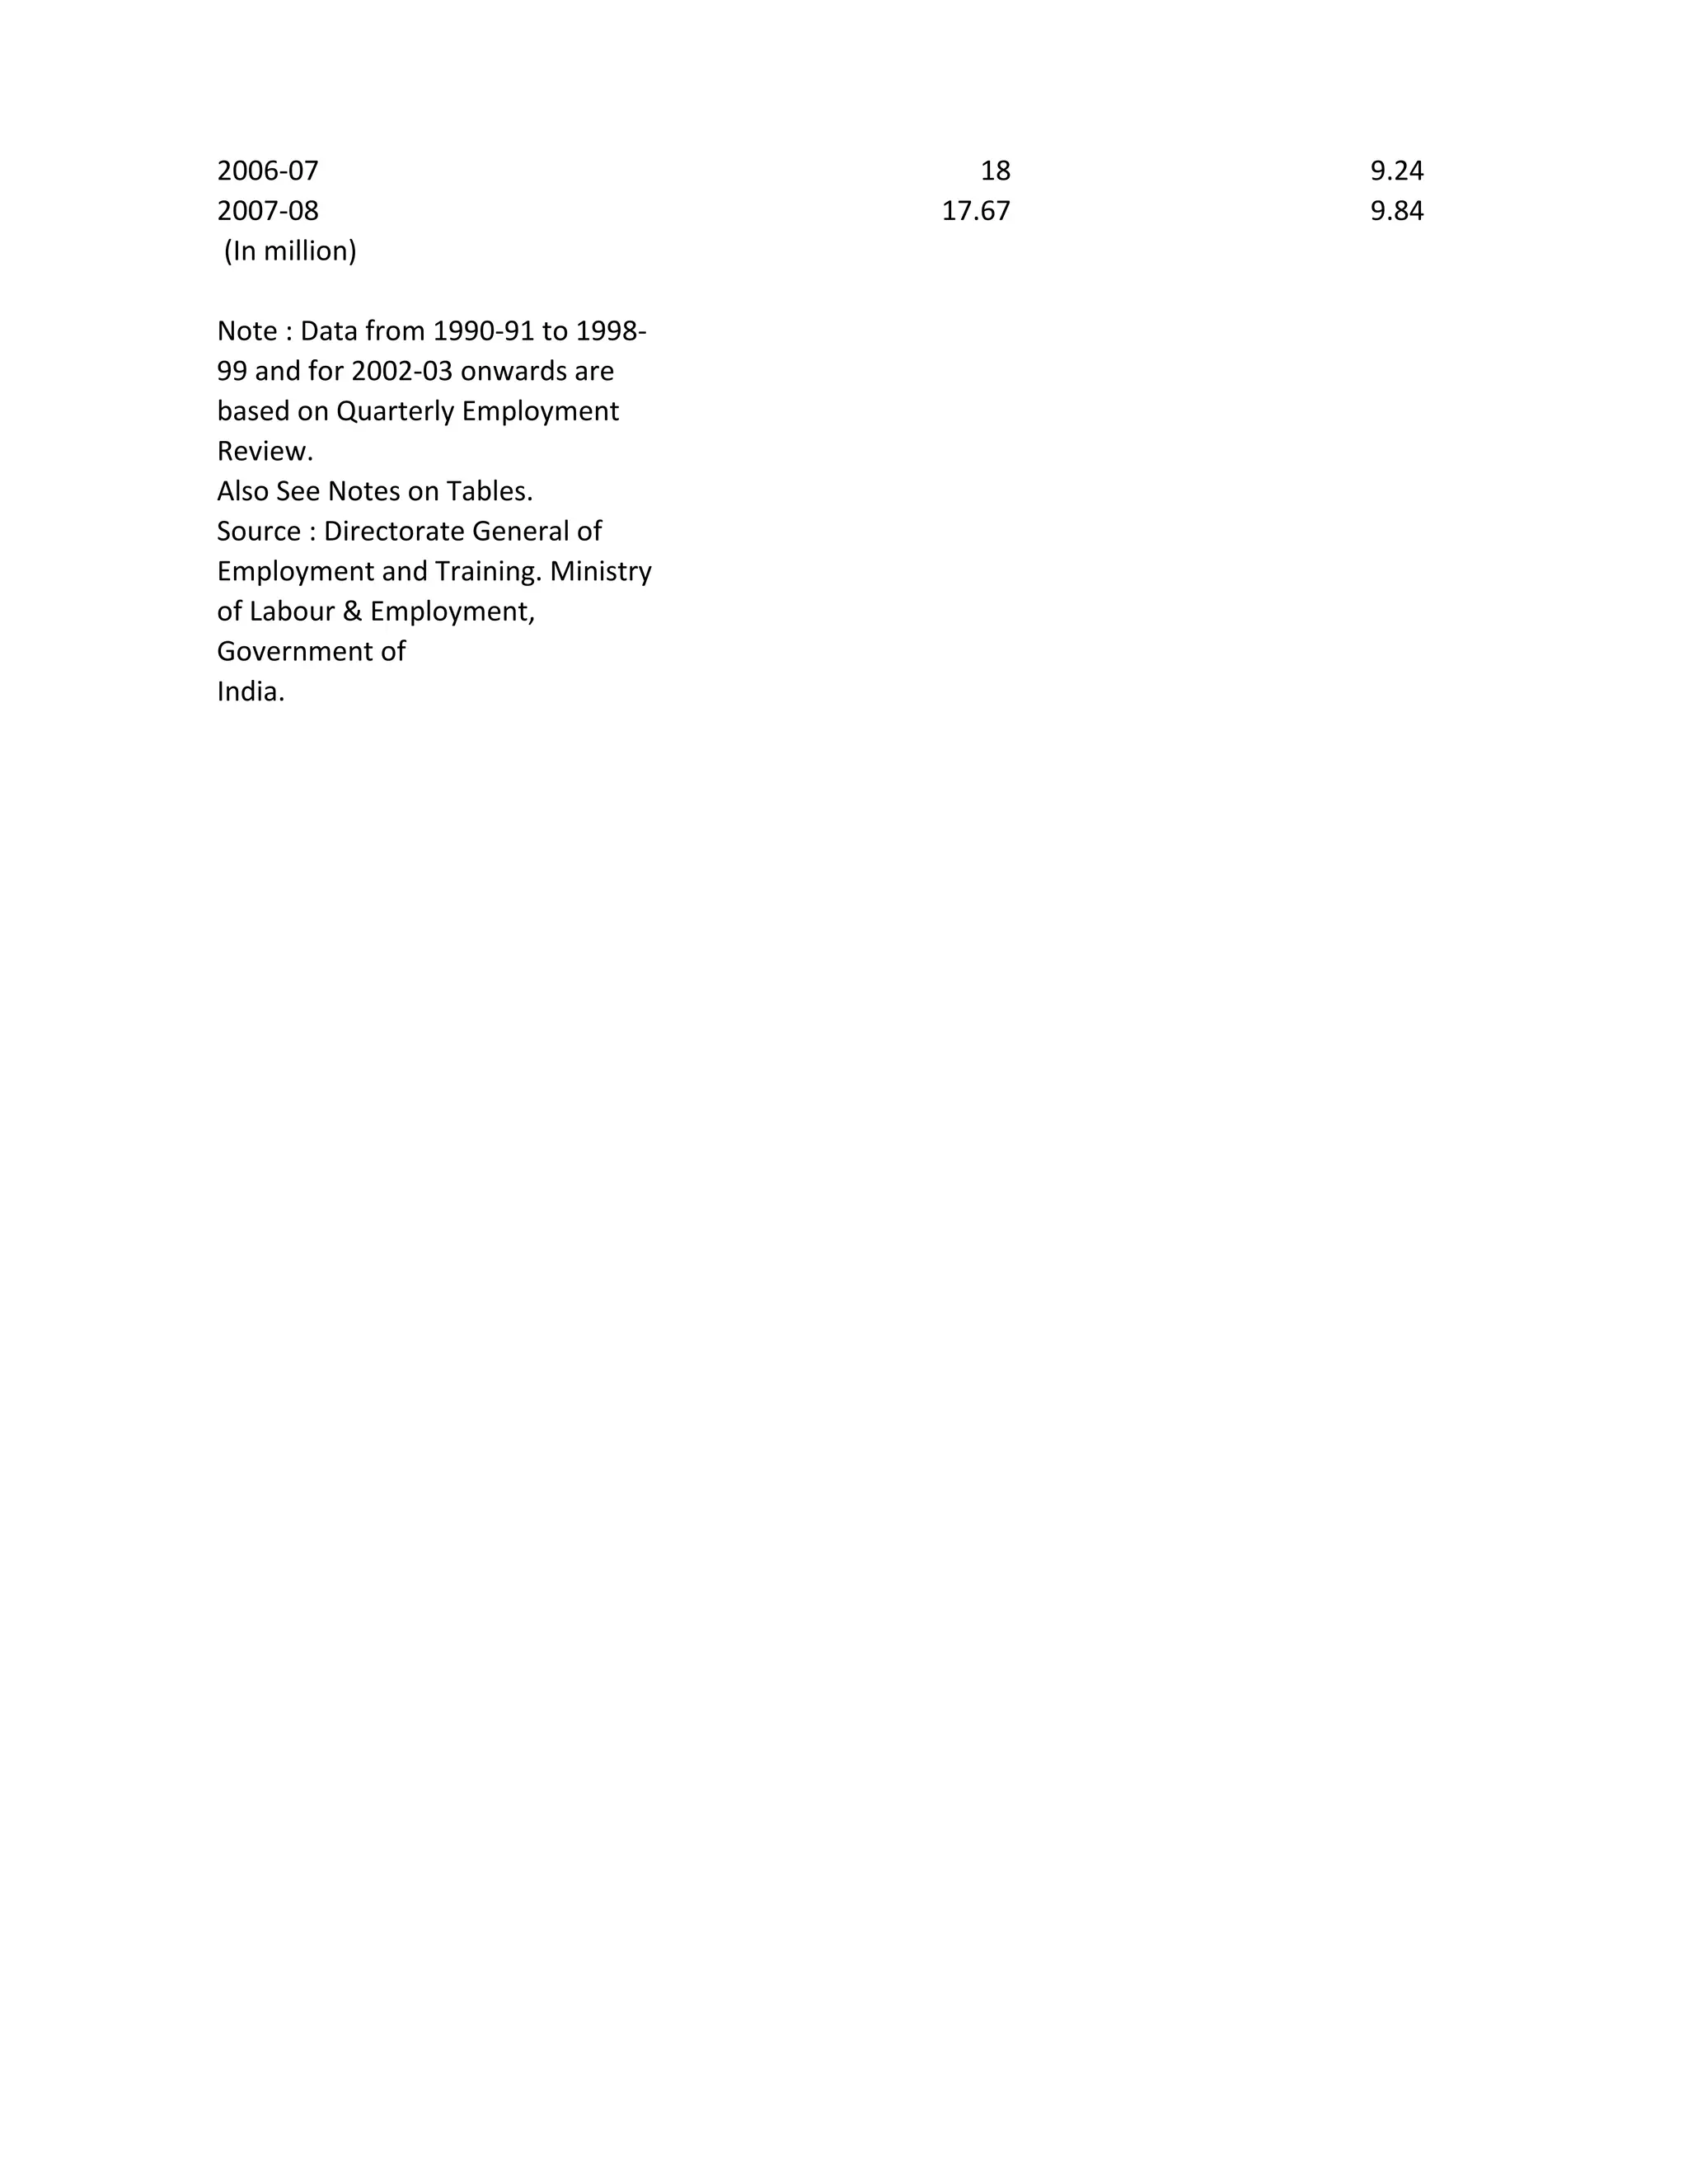
1) Employment in the public sector steadily increased from 11.1 million in 1970-71 to 17.67 million in 2007-08.
2) Employment in the private sector increased more slowly from 6.73 million in 1970-71 to 9.84 million in 2007-08.
3) The number of persons on the live register, a measure of unemployment, fluctuated between 5.1 million and 42 million from 1970-71 to 2007-08.