The marketing research team conducted a survey of 100 Starbucks customers in Boston to understand reasons for the closure of over 600 Starbucks stores. Key findings include:
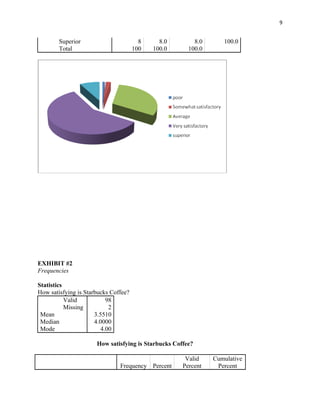
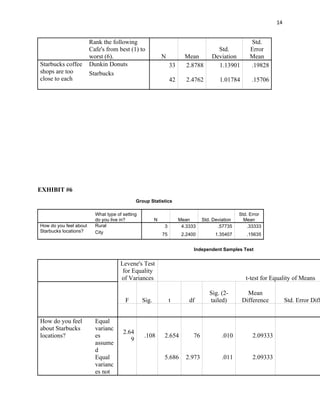
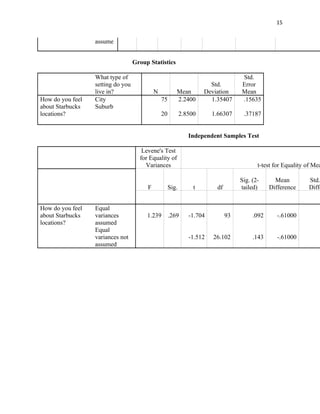
1) City residents were less satisfied with Starbucks than suburban residents, with issues around small store size and long wait times due to under-trained employees.
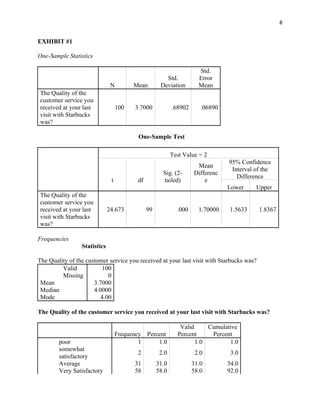
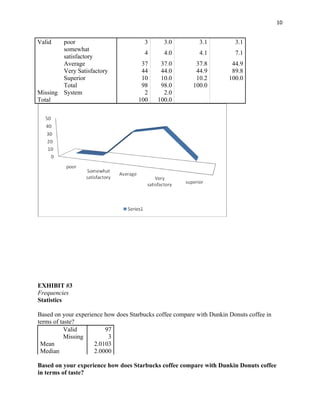
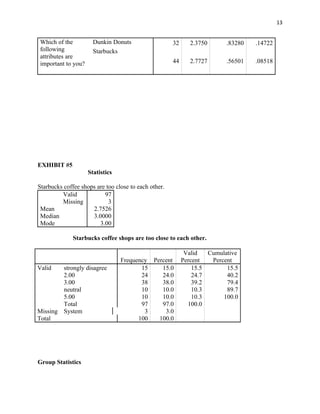
2) While customer service was rated as satisfactory overall, 44% of customers had neutral or poor ratings, indicating room for improvement.
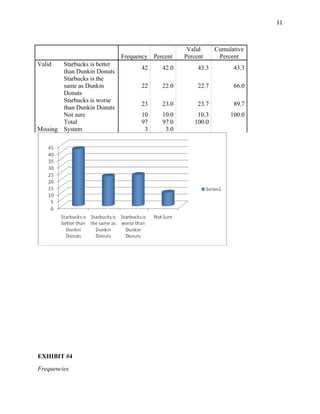
3) Dunkin' Donuts was identified as a major competitor, with 42% preferring Starbucks but 55% thinking they were similar or preferring Dunkin' Donuts instead.
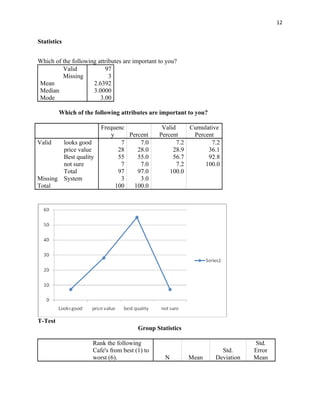
4) Price value was the most important attribute for coffee purchases, particularly for