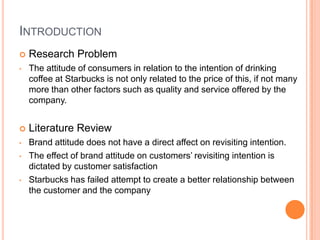
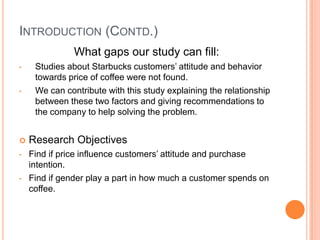
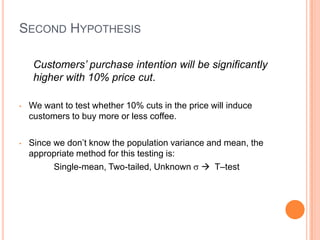
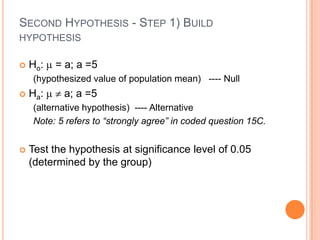
STARBUCKS CUSTOMERS’ ATTITUDE AND
BEHAVIOR TOWARDS PRICE OF COFFEE

Group members:
Lauren Basilone 001-17-7681
Rachel Hogue           001-73-2749
Benedetta Piva         001-95-5364
Eiman Rahimi           001-82-9559
Lorena Rivas           001-95-9132
Asia Usry              001-68-4987
AGENDA
   Introduction
   Hypothesis
   Sampling
   Data Analysis
   Conclusion
INTRODUCTION
   Research Problem
•   The attitude of consumers in relation to the intention of drinking
    coffee at Starbucks is not only related to the price of this, if not many
    more than other factors such as quality and service offered by the
    company.


   Literature Review
•   Brand attitude does not have a direct affect on revisiting intention.
•   The effect of brand attitude on customers’ revisiting intention is
    dictated by customer satisfaction
•   Starbucks has failed attempt to create a better relationship between
    the customer and the company
INTRODUCTION (CONTD.)
               What gaps our study can fill:
•    Studies about Starbucks customers’ attitude and behavior
     towards price of coffee were not found.
•    We can contribute with this study explaining the relationship
     between these two factors and giving recommendations to
     the company to help solving the problem.


   Research Objectives
•   Find if price influence customers’ attitude and purchase
    intention.
•   Find if gender play a part in how much a customer spends on
    coffee.
INTRODUCTION (CONTD.)
   Research Questions
•   What is the customer attitude toward Starbucks’ coffee?
•   How would decreasing price impact customers’ attitude
    and purchase intention?
•   Does gender play apart in how much a customer spends
    on coffee?


   Research contributions
•   Our study is unique because there have not been any
    studies conducted on US students.
•   Relation between coffee price and consumer attitudes has
    not been tested in past studies.
•   Our study can help Starbucks improve their service and
    relationship with its consumers and increase loyalty.
HYPOTHESIS
   Question 1
       What is the customer attitude toward Starbucks’ coffee?
   Hypothesis 1
       Customers’ attitude toward Starbucks’ coffee is low
        price (comparing with their major competitors such as
        Dunkin’ Donuts)

•   This will determine the customers’ current attitudes towards
    to price of coffee.
•   If there is a high percentage of respondents who think
    Starbucks coffee is high priced then Starbuck might want to
    consider promotional incentives, discounts or a price cut.
HYPOTHESIS (CONTD.)
   Question 2
       How would decreasing price impact customers’ attitude
        and purchase intention?
   Hypothesis 2
       Customers’ purchase intention will be significantly
        higher with 10% price cut.

•   This hypothesis was developed in order to measure
    customers’ buying behavior in relation to price reductions.
HYPOTHESIS (CONTD.)
   Question 3
       Does gender play apart in how much a customer
        spends on coffee?
   Hypothesis 3
       Amount of money spent at each Starbucks visit is
        independent of gender.

•   We had an interest in understand the gender roles of
    purchasing coffee.
•   Since we focused on participants between the ages of 16-
    24 we wanted to know if women or men purchased more
    coffee than the other.
•   Determining whether there is a relationship, Starbucks can
    market and advertise better to the gender and age that
    purchases coffee the most.
SAMPLING METHOD
   Participants
•   We selected 60 participants randomly. Our target audience
    was coffee drinks ages 16-24.
•   Coffee drinkers were targets mostly to benefit our research
    results to help find solutions to the hypotheses.


   Questionnaire Design
•   Assortment of question types and scales such as: nominal
    scale, interval scales, rating scales, Likert scale, and
    itemized category.
SAMPLING METHOD (CONTD.)

•   The survey questions involving answers on a scale, agree-
    disagree, important-non important.
•   A couple of open-ended questions


   Procedure
•   Survey made on KwikSurveys.com and posted online to
    make it more accessible
•   We were able to reach more respondent in this way
RESULT
   Data coding
•   Nine questions were coded from our survey and put into a
    table.

•   Most of the questions that were coded consisted of close-
    ended questions, with the exception of one open-ended.

•   The range values given to each answer provides key
    information of the value to be entered for each response.

•   Generally open-ended questions are more difficult to code
EXAMPLES OF CODING
3. Which place do you frequent the most for purchasing
   coffee?
o McDonald's
o Dunkin' Donuts
o 7-Eleven
o Starbucks
o If others, please list __________________________


•   Most Frequent Place for Purchasing coffee:
    0=McDonald's 1=Dunkin' Donuts, 2=7-Eleven,
    3=Starbucks

•   Other for “Place purchased” : 4=Home, 5= Other
    coffeehouse
EXAMPLES OF CODING (CONTD.)
20. Please indicate your age
o 16-24yrs

o 25-34yrs

o 35-44yrs

o 45-54yrs

o 55-64yrs

o 65 or older


•   Age Indication: 0=16-24yrs 1=25-34yrs 2=35-44yrs 3=45-
    54yrs 4=55-64yrs 5=65+
FIRST STEP ANALYSIS: SIMPLE TABULATION
•   Constructed simple tabulations for:
    Question 8 “Approximately how often do you visit
    Starbucks?”

    Question 13 “About how much do you spend at Starbucks
    per visit (not including tip)?

•   These questions are designed to measure the most
    important construct in this study: customer’s purchasing
    behaviour toward Starbucks.

•   Question 8 shows the customers’ purchase frequency and
    Question 13 indicates the customers’ monetary purchase
    quantity.
FIRST STEP ANALYSIS: SIMPLE TABULATION
(CONTD.)
•   The variable responses for Question 13 started at less than
    $3 dollars and went up to $11.

•   50% of respondents spend between $3 to $5 every time
    they visit Starbucks and just 1% of them stated that they
    normally spend $11 or more in their purchases.

•   Question 8 was asking about the frequency of visits.

•   Available responses: never, occasionally, monthly, weekly,
    1 to 3 times a week, and daily.

•   The answer “Occasionally” was the most chosen with
    39.34% of respondents.
FIRST STEP ANALYSIS: CROSS-TABULATION
•   We used cross-tabulation to analyze the relationship
    among gender and the amount of money spent at each
    Starbucks visit.

•    It is important to know if purchase expenditure varies
    depending on the gender, so in the future, Starbucks could
    use different strategies or promote different products to
    reach the two groups in different ways.

•   24 males and 36 females participated in the survey.
FIRST STEP ANALYSIS: CROSS-TABULATION
(CONTD.)
•   The most popular response was “$3 to $5” among both
    genders: 13 males and 17 females.

•   Since there are more females answering “$3 to $5” than
    males, this shows that females are more likely to spend
    that amount of money at Starbucks.

•   This is true also for greater amount: for response “$6 to
    $10” we had 10 females and 9 males, for response “$11 or
    more” we had 1 female and no males.
RESULT – HYPOTHESIS TESTING

o   Hypothesis testing is the use of statistics to
    determine the probability that a given hypothesis is
    true

o   Managers often make decisions based on statistical
    tests using data, whether from a controlled
    experiment or an observational study

o   The choice of an appropriate probability distribution
    depends on the purpose of the hypothesis test.
    Depending on whether the focus of hypothesis
    testing is mean-parameter or variance-parameter,
    we can use: Z-dist, T-dist, and chi-square, F-dist
FIRST HYPOTHESIS

     Customers’ attitude toward Starbucks’ coffee is low
     price.

•   Here, we want to test whether customers agree with the fact
    that Starbucks coffee is low priced or high priced.

•   Since the population variance and mean are unknown the
    appropriate method for this test is:
          Single-mean, Two-tailed, Unknown  T–test
FIRST HYPOTHESIS - STEP 1) BUILD HYPOTHESIS

   Ho:   = a; a =1
    (hypothesized value of population mean) ---- Null
   Ha:    a; a =1
    (alternative hypothesis) ---- Alternative
    Note: 1 refers to “strongly disagree” in coded question
    12B.


   Test the hypothesis at significance level of 0.05
    (determined by the group)
FIRST HYPOTHESIS - STEP 2) CALCULATE TEST
STATISTICS

   Information we know:
     X= 1.20; N=60; Sx =1.0954; α=0.05


   Type of test we need:
     single-mean, unknown , two-tailed  t–test


   Test Statistics Calculation:
     Standard error of sample mean: σX=0.1414
     The test statistics: tcalc= 7.0721
FIRST HYPOTHESIS - STEP 3) FIND THE CRITICAL
VALUE TDF, Α/2

   Significance level α=0.05

   Degree of freedom DF= N-1 = 60-1 = 59            60
                  tdf,α/2 = t60,0.025=2.000

    Note: since this a two-tailed test, we use α/2 instead of α
    to find the critical.
FIRST HYPOTHESIS - STEP 4) TEST HYPOTHESIS

   Decision Rule:
    If |tcalc|> tdf,α/2  Reject H0
    If |tcalc|≤ tdf,α/2  Accept H0


   Conclusion:
    Since |tcalc|=7.0721 > t11,0.005 = 2.000  We REJECT H0.


   Through this testing we found that customers do
    not feel that Starbucks’ coffee is low priced.
SECOND HYPOTHESIS

     Customers’ purchase intention will be significantly
     higher with 10% price cut.

•   We want to test whether 10% cuts in the price will induce
    customers to buy more or less coffee.

•   Since we don’t know the population variance and mean, the
    appropriate method for this testing is:
          Single-mean, Two-tailed, Unknown  T–test
SECOND HYPOTHESIS - STEP 1) BUILD
HYPOTHESIS

   Ho:   = a; a =5
    (hypothesized value of population mean) ---- Null
   Ha:    a; a =5
    (alternative hypothesis) ---- Alternative
    Note: 5 refers to “strongly agree” in coded question 15C.


   Test the hypothesis at significance level of 0.05
    (determined by the group)
SECOND HYPOTHESIS - STEP 2) CALCULATE TEST
STATISTICS

   Information we know:
     X= 3.52; N=60; Sx =1.3477; α=0.05


   Type of test we need:
     single-mean, unknown , two-tailed  t–test

   Test Statistics Calculation:
     Standard error of sample mean: σX= 0.1740
     The test statistics: tcalc= -8.5057
SECOND HYPOTHESIS - STEP 3) FIND THE
CRITICAL VALUE TDF, Α/2

   Significance level α=0.05

   Degree of freedom DF= N-1 = 60-1 = 59            60
                  tdf,α/2 = t60,0.025=2.000

    Note: since this a two-tailed test, we use α/2 instead of α
    to find the critical.
FIRST HYPOTHESIS - STEP 4) TEST HYPOTHESIS

   Decision Rule:
    If |tcalc|> tdf,α/2  Reject H0
    If |tcalc|≤ tdf,α/2  Accept H0


   Conclusion:
    Since |tcalc|=|8.5057|>t11,0.005=2.000  We REJECT H0.


   This hypothesis testing showed that a price
    reduction of 10% in Starbucks’ coffee would not
    please our customers.
THIRD HYPOTHESIS

     Amount of money spent at each Starbucks visit is
     independent of gender.

•   We want to test whether the amount of money spent at each
    Starbucks visit is independent of gender or there is an
    association between these two.

•   Therefore, the appropriate method for this testing is:
                 Chi-square test on independence
THIRD HYPOTHESIS - STEP 1) BUILD HYPOTHESIS

 H0: Amount of money spent at each Starbucks visit
  is independent of gender
 H1: There is an association between Amount of
  money spent and gender

   Test the hypothesis at significance level of α=0.05
THIRD HYPOTHESIS - STEP 2) CALCULATE TEST
STATISTICS Χ2

 Observations (O1 --- O8): calculated from data.
 Expectation (E1 --- E8): calculated from PA, PL, and
  sample size N.

    PL1=0.4            PL2=0.6PA1=0.16
    PA2=0.50           PA3=0.32      PA4=0.02

    E1=3.84            E2=5.76      E3=12
    E4=18              E5=7.68      E6=11.52
    E7=0.48            E8=0.72


   Test Statistics: χ2 = 3.41
THIRD HYPOTHESIS - STEP 3) CRITICAL VALUE Χ2V,
Α


 DF: v=(L-1)*(A-1)=(2-1)*(4-1)= 3
 χ2df,α= χ23,0.05=7.81
THIRD HYPOTHESIS - STEP 4) TEST HYPOTHESIS

   Condition:
    Under H0, χ2 ~ χ22
    if χ2> χ23,0.05  Reject H0
    if χ2≤ χ23,0.05  Accept H0

   Therefore:
    χ2=3.41<χ23,0.05=7.81  ACCEPT H0


   Our studies suggest that amount of money spent at
    each Starbucks visit is independent of gender.
CONCLUSION
   Rejection of all hypothesis

   Recommend a more in-depth study
     Promotional incentives
     Focus groups, target age groups
     Study of what causes customers to return
Thank you and Questions

Project final presentation

  • 1.
    STARBUCKS CUSTOMERS’ ATTITUDEAND BEHAVIOR TOWARDS PRICE OF COFFEE Group members: Lauren Basilone 001-17-7681 Rachel Hogue 001-73-2749 Benedetta Piva 001-95-5364 Eiman Rahimi 001-82-9559 Lorena Rivas 001-95-9132 Asia Usry 001-68-4987
  • 2.
    AGENDA  Introduction  Hypothesis  Sampling  Data Analysis  Conclusion
  • 3.
    INTRODUCTION  Research Problem • The attitude of consumers in relation to the intention of drinking coffee at Starbucks is not only related to the price of this, if not many more than other factors such as quality and service offered by the company.  Literature Review • Brand attitude does not have a direct affect on revisiting intention. • The effect of brand attitude on customers’ revisiting intention is dictated by customer satisfaction • Starbucks has failed attempt to create a better relationship between the customer and the company
  • 4.
    INTRODUCTION (CONTD.) What gaps our study can fill: • Studies about Starbucks customers’ attitude and behavior towards price of coffee were not found. • We can contribute with this study explaining the relationship between these two factors and giving recommendations to the company to help solving the problem.  Research Objectives • Find if price influence customers’ attitude and purchase intention. • Find if gender play a part in how much a customer spends on coffee.
  • 5.
    INTRODUCTION (CONTD.)  Research Questions • What is the customer attitude toward Starbucks’ coffee? • How would decreasing price impact customers’ attitude and purchase intention? • Does gender play apart in how much a customer spends on coffee?  Research contributions • Our study is unique because there have not been any studies conducted on US students. • Relation between coffee price and consumer attitudes has not been tested in past studies. • Our study can help Starbucks improve their service and relationship with its consumers and increase loyalty.
  • 6.
    HYPOTHESIS  Question 1  What is the customer attitude toward Starbucks’ coffee?  Hypothesis 1  Customers’ attitude toward Starbucks’ coffee is low price (comparing with their major competitors such as Dunkin’ Donuts) • This will determine the customers’ current attitudes towards to price of coffee. • If there is a high percentage of respondents who think Starbucks coffee is high priced then Starbuck might want to consider promotional incentives, discounts or a price cut.
  • 7.
    HYPOTHESIS (CONTD.)  Question 2  How would decreasing price impact customers’ attitude and purchase intention?  Hypothesis 2  Customers’ purchase intention will be significantly higher with 10% price cut. • This hypothesis was developed in order to measure customers’ buying behavior in relation to price reductions.
  • 8.
    HYPOTHESIS (CONTD.)  Question 3  Does gender play apart in how much a customer spends on coffee?  Hypothesis 3  Amount of money spent at each Starbucks visit is independent of gender. • We had an interest in understand the gender roles of purchasing coffee. • Since we focused on participants between the ages of 16- 24 we wanted to know if women or men purchased more coffee than the other. • Determining whether there is a relationship, Starbucks can market and advertise better to the gender and age that purchases coffee the most.
  • 9.
    SAMPLING METHOD  Participants • We selected 60 participants randomly. Our target audience was coffee drinks ages 16-24. • Coffee drinkers were targets mostly to benefit our research results to help find solutions to the hypotheses.  Questionnaire Design • Assortment of question types and scales such as: nominal scale, interval scales, rating scales, Likert scale, and itemized category.
  • 10.
    SAMPLING METHOD (CONTD.) • The survey questions involving answers on a scale, agree- disagree, important-non important. • A couple of open-ended questions  Procedure • Survey made on KwikSurveys.com and posted online to make it more accessible • We were able to reach more respondent in this way
  • 11.
    RESULT  Data coding • Nine questions were coded from our survey and put into a table. • Most of the questions that were coded consisted of close- ended questions, with the exception of one open-ended. • The range values given to each answer provides key information of the value to be entered for each response. • Generally open-ended questions are more difficult to code
  • 12.
    EXAMPLES OF CODING 3.Which place do you frequent the most for purchasing coffee? o McDonald's o Dunkin' Donuts o 7-Eleven o Starbucks o If others, please list __________________________ • Most Frequent Place for Purchasing coffee: 0=McDonald's 1=Dunkin' Donuts, 2=7-Eleven, 3=Starbucks • Other for “Place purchased” : 4=Home, 5= Other coffeehouse
  • 13.
    EXAMPLES OF CODING(CONTD.) 20. Please indicate your age o 16-24yrs o 25-34yrs o 35-44yrs o 45-54yrs o 55-64yrs o 65 or older • Age Indication: 0=16-24yrs 1=25-34yrs 2=35-44yrs 3=45- 54yrs 4=55-64yrs 5=65+
  • 15.
    FIRST STEP ANALYSIS:SIMPLE TABULATION • Constructed simple tabulations for: Question 8 “Approximately how often do you visit Starbucks?” Question 13 “About how much do you spend at Starbucks per visit (not including tip)? • These questions are designed to measure the most important construct in this study: customer’s purchasing behaviour toward Starbucks. • Question 8 shows the customers’ purchase frequency and Question 13 indicates the customers’ monetary purchase quantity.
  • 17.
    FIRST STEP ANALYSIS:SIMPLE TABULATION (CONTD.) • The variable responses for Question 13 started at less than $3 dollars and went up to $11. • 50% of respondents spend between $3 to $5 every time they visit Starbucks and just 1% of them stated that they normally spend $11 or more in their purchases. • Question 8 was asking about the frequency of visits. • Available responses: never, occasionally, monthly, weekly, 1 to 3 times a week, and daily. • The answer “Occasionally” was the most chosen with 39.34% of respondents.
  • 18.
    FIRST STEP ANALYSIS:CROSS-TABULATION • We used cross-tabulation to analyze the relationship among gender and the amount of money spent at each Starbucks visit. • It is important to know if purchase expenditure varies depending on the gender, so in the future, Starbucks could use different strategies or promote different products to reach the two groups in different ways. • 24 males and 36 females participated in the survey.
  • 20.
    FIRST STEP ANALYSIS:CROSS-TABULATION (CONTD.) • The most popular response was “$3 to $5” among both genders: 13 males and 17 females. • Since there are more females answering “$3 to $5” than males, this shows that females are more likely to spend that amount of money at Starbucks. • This is true also for greater amount: for response “$6 to $10” we had 10 females and 9 males, for response “$11 or more” we had 1 female and no males.
  • 21.
    RESULT – HYPOTHESISTESTING o Hypothesis testing is the use of statistics to determine the probability that a given hypothesis is true o Managers often make decisions based on statistical tests using data, whether from a controlled experiment or an observational study o The choice of an appropriate probability distribution depends on the purpose of the hypothesis test. Depending on whether the focus of hypothesis testing is mean-parameter or variance-parameter, we can use: Z-dist, T-dist, and chi-square, F-dist
  • 22.
    FIRST HYPOTHESIS Customers’ attitude toward Starbucks’ coffee is low price. • Here, we want to test whether customers agree with the fact that Starbucks coffee is low priced or high priced. • Since the population variance and mean are unknown the appropriate method for this test is: Single-mean, Two-tailed, Unknown  T–test
  • 23.
    FIRST HYPOTHESIS -STEP 1) BUILD HYPOTHESIS  Ho: = a; a =1 (hypothesized value of population mean) ---- Null  Ha: a; a =1 (alternative hypothesis) ---- Alternative Note: 1 refers to “strongly disagree” in coded question 12B.  Test the hypothesis at significance level of 0.05 (determined by the group)
  • 24.
    FIRST HYPOTHESIS -STEP 2) CALCULATE TEST STATISTICS  Information we know: X= 1.20; N=60; Sx =1.0954; α=0.05  Type of test we need: single-mean, unknown , two-tailed  t–test  Test Statistics Calculation: Standard error of sample mean: σX=0.1414 The test statistics: tcalc= 7.0721
  • 25.
    FIRST HYPOTHESIS -STEP 3) FIND THE CRITICAL VALUE TDF, Α/2  Significance level α=0.05  Degree of freedom DF= N-1 = 60-1 = 59 60 tdf,α/2 = t60,0.025=2.000 Note: since this a two-tailed test, we use α/2 instead of α to find the critical.
  • 26.
    FIRST HYPOTHESIS -STEP 4) TEST HYPOTHESIS  Decision Rule: If |tcalc|> tdf,α/2  Reject H0 If |tcalc|≤ tdf,α/2  Accept H0  Conclusion: Since |tcalc|=7.0721 > t11,0.005 = 2.000  We REJECT H0.  Through this testing we found that customers do not feel that Starbucks’ coffee is low priced.
  • 27.
    SECOND HYPOTHESIS Customers’ purchase intention will be significantly higher with 10% price cut. • We want to test whether 10% cuts in the price will induce customers to buy more or less coffee. • Since we don’t know the population variance and mean, the appropriate method for this testing is: Single-mean, Two-tailed, Unknown  T–test
  • 28.
    SECOND HYPOTHESIS -STEP 1) BUILD HYPOTHESIS  Ho: = a; a =5 (hypothesized value of population mean) ---- Null  Ha: a; a =5 (alternative hypothesis) ---- Alternative Note: 5 refers to “strongly agree” in coded question 15C.  Test the hypothesis at significance level of 0.05 (determined by the group)
  • 29.
    SECOND HYPOTHESIS -STEP 2) CALCULATE TEST STATISTICS  Information we know: X= 3.52; N=60; Sx =1.3477; α=0.05  Type of test we need: single-mean, unknown , two-tailed  t–test  Test Statistics Calculation: Standard error of sample mean: σX= 0.1740 The test statistics: tcalc= -8.5057
  • 30.
    SECOND HYPOTHESIS -STEP 3) FIND THE CRITICAL VALUE TDF, Α/2  Significance level α=0.05  Degree of freedom DF= N-1 = 60-1 = 59 60 tdf,α/2 = t60,0.025=2.000 Note: since this a two-tailed test, we use α/2 instead of α to find the critical.
  • 31.
    FIRST HYPOTHESIS -STEP 4) TEST HYPOTHESIS  Decision Rule: If |tcalc|> tdf,α/2  Reject H0 If |tcalc|≤ tdf,α/2  Accept H0  Conclusion: Since |tcalc|=|8.5057|>t11,0.005=2.000  We REJECT H0.  This hypothesis testing showed that a price reduction of 10% in Starbucks’ coffee would not please our customers.
  • 32.
    THIRD HYPOTHESIS Amount of money spent at each Starbucks visit is independent of gender. • We want to test whether the amount of money spent at each Starbucks visit is independent of gender or there is an association between these two. • Therefore, the appropriate method for this testing is: Chi-square test on independence
  • 33.
    THIRD HYPOTHESIS -STEP 1) BUILD HYPOTHESIS  H0: Amount of money spent at each Starbucks visit is independent of gender  H1: There is an association between Amount of money spent and gender  Test the hypothesis at significance level of α=0.05
  • 34.
    THIRD HYPOTHESIS -STEP 2) CALCULATE TEST STATISTICS Χ2  Observations (O1 --- O8): calculated from data.  Expectation (E1 --- E8): calculated from PA, PL, and sample size N. PL1=0.4 PL2=0.6PA1=0.16 PA2=0.50 PA3=0.32 PA4=0.02 E1=3.84 E2=5.76 E3=12 E4=18 E5=7.68 E6=11.52 E7=0.48 E8=0.72  Test Statistics: χ2 = 3.41
  • 35.
    THIRD HYPOTHESIS -STEP 3) CRITICAL VALUE Χ2V, Α  DF: v=(L-1)*(A-1)=(2-1)*(4-1)= 3  χ2df,α= χ23,0.05=7.81
  • 36.
    THIRD HYPOTHESIS -STEP 4) TEST HYPOTHESIS  Condition: Under H0, χ2 ~ χ22 if χ2> χ23,0.05  Reject H0 if χ2≤ χ23,0.05  Accept H0  Therefore: χ2=3.41<χ23,0.05=7.81  ACCEPT H0  Our studies suggest that amount of money spent at each Starbucks visit is independent of gender.
  • 37.
    CONCLUSION  Rejection of all hypothesis  Recommend a more in-depth study  Promotional incentives  Focus groups, target age groups  Study of what causes customers to return
  • 38.
    Thank you andQuestions

Editor's Notes

  • #7 One research article showed that customer retention is not based on brand attitude but the satisfaction of the product and service (Ku and Chiu, 2008). If it is discovered that our participants have n low standards of Starbucks coffee and service that could affect the decrease in recent coffee sells. Knowing and understanding the customer’s attitude toward Starbucks can help the Starbucks Corporation correct and improve their product and services. This hypothesis is unique because it was testing through majority students in Atlanta and there are no pervious study performed for this demographics and location.
  • #8 Since one study reveled that the price of coffee has increased by 200% but that the coffee industry is still striving it could benefit and increase Starbucks sells if there was a price reduction on coffee and specialty drinks (Roby, 2011).