Download as PDF, PPTX


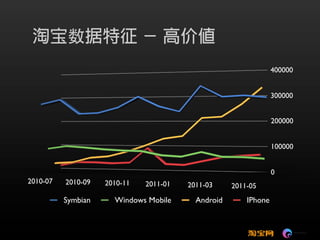
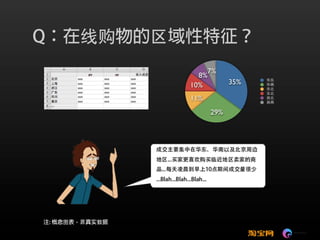


This document appears to contain charts showing smartphone operating system market share over time and in a particular quarter. The line chart shows market share percentages for Symbian, Windows Mobile, Android and iPhone between 2010 and 2011, with Android increasing dramatically. The pie chart for a single quarter breaks down market share as 35% Android, 29% Symbian, 11% iPhone and smaller shares for others.


