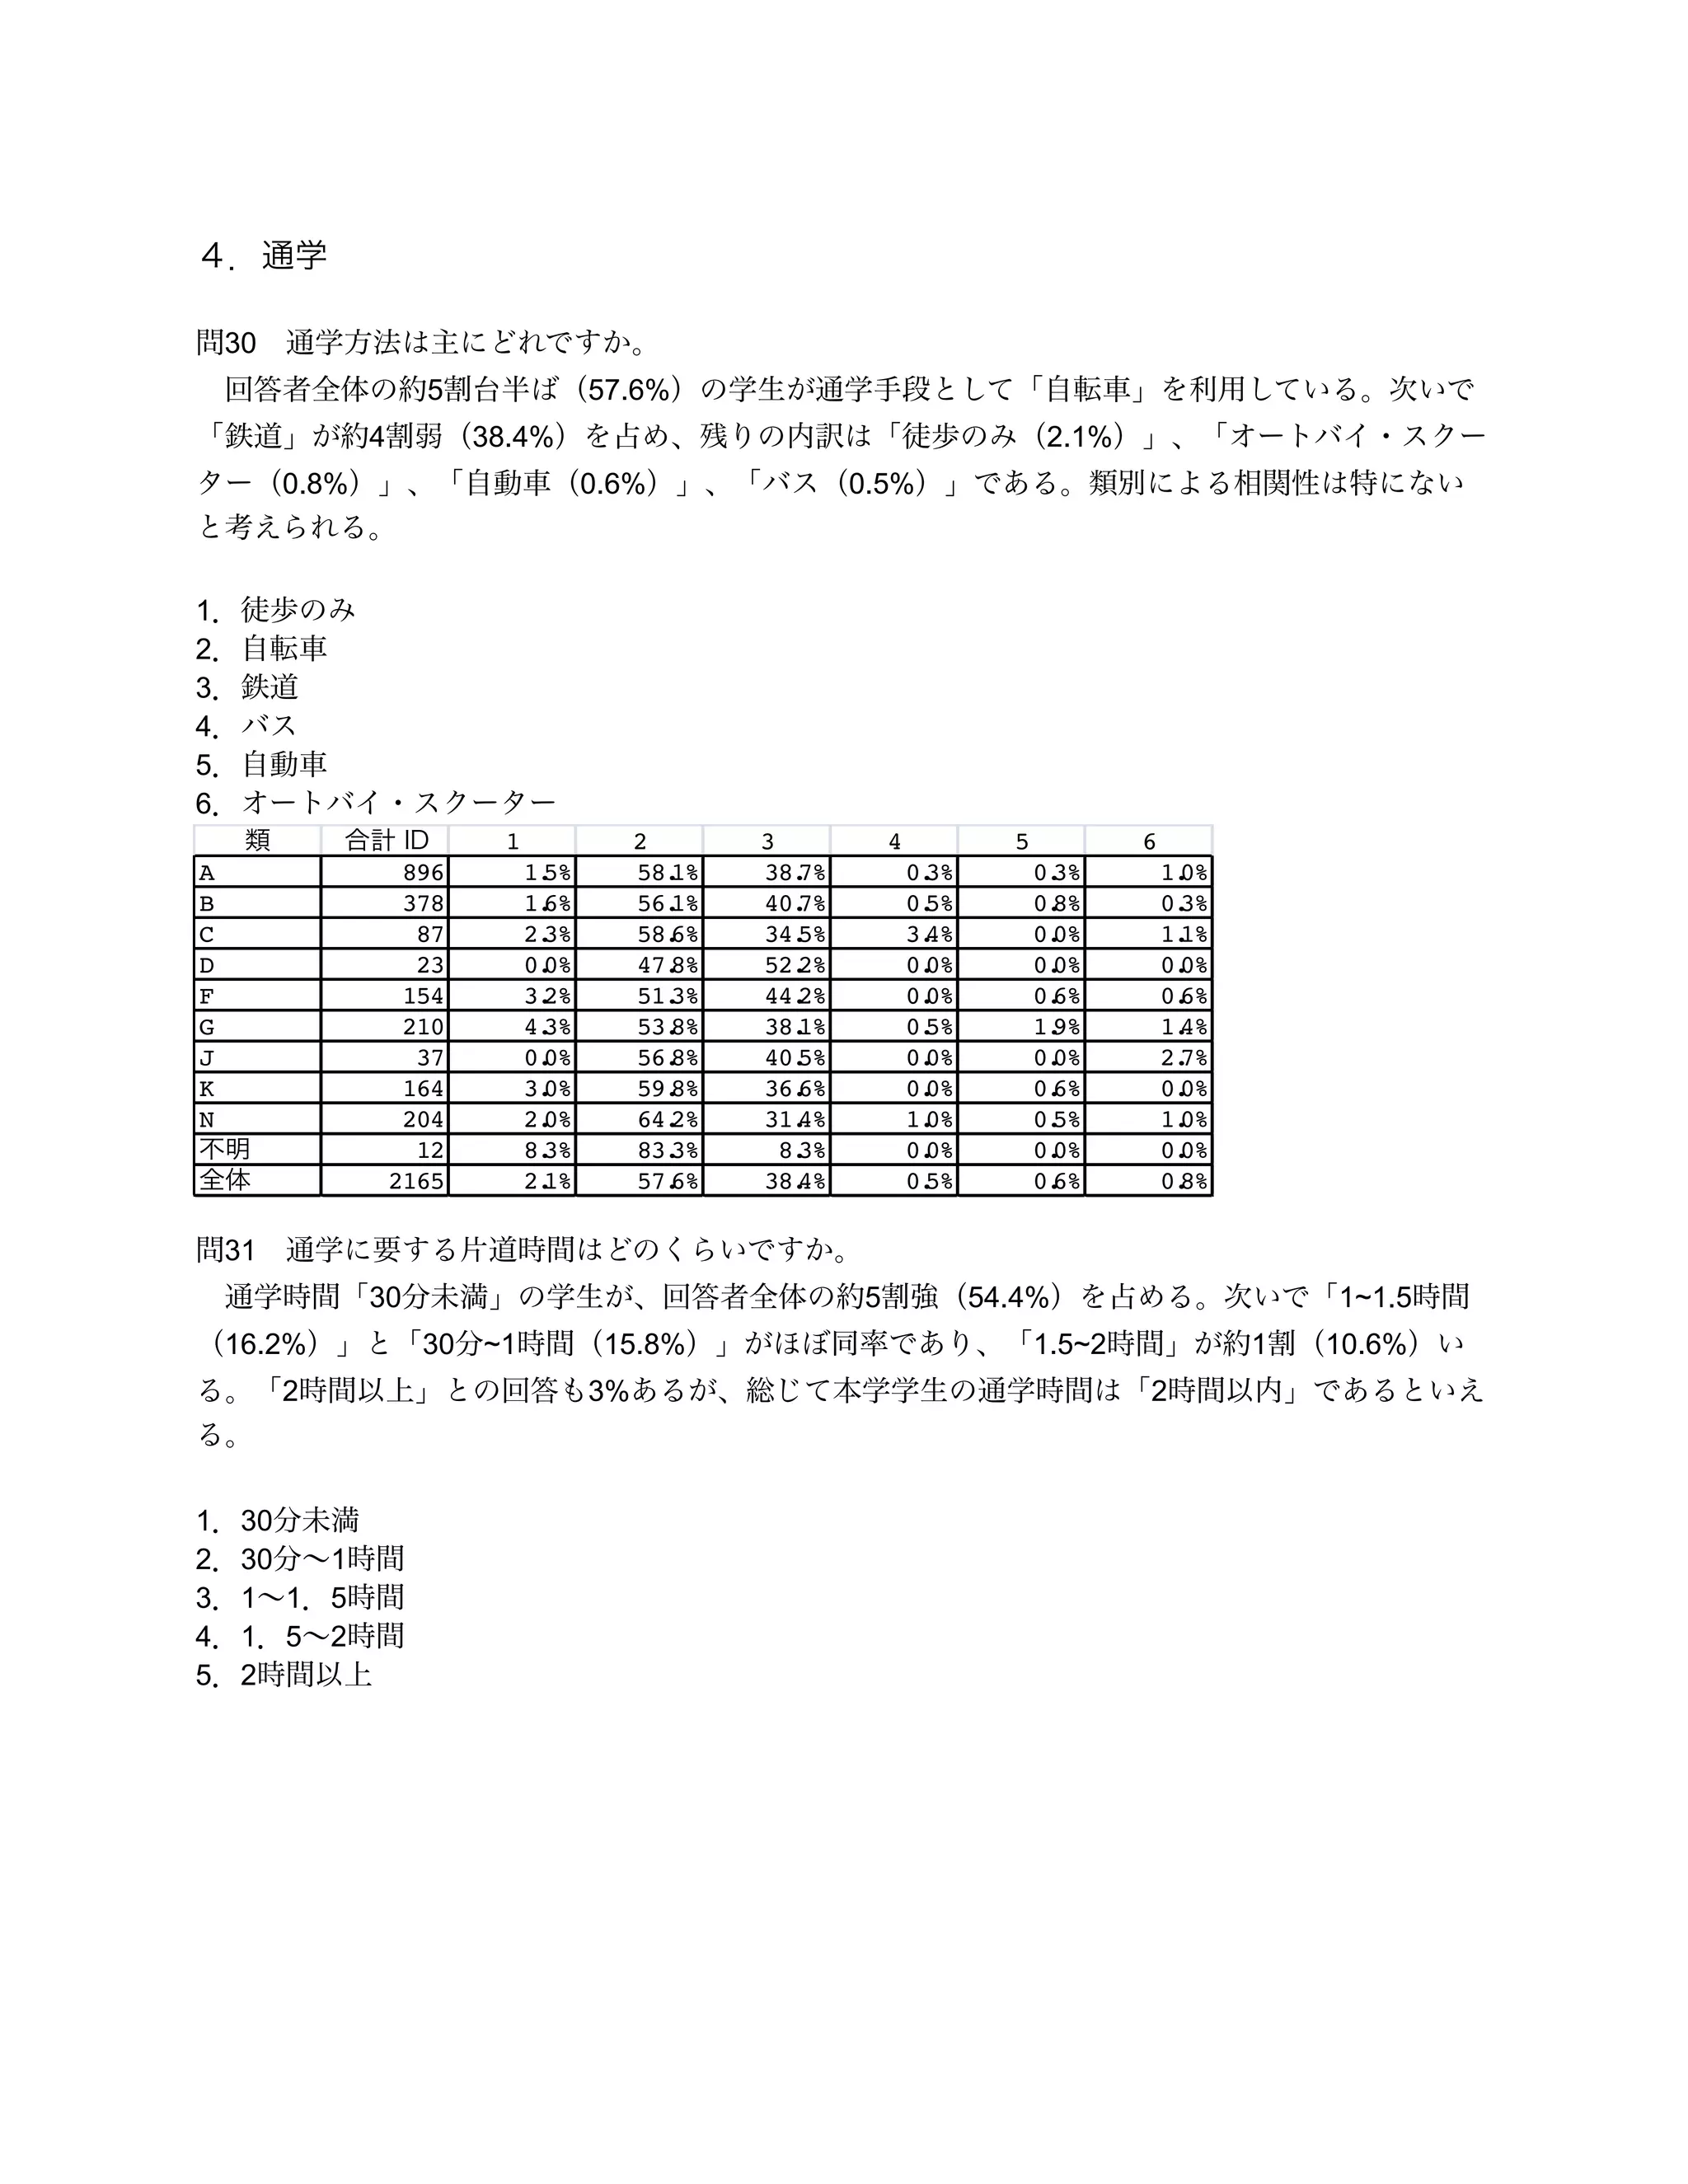
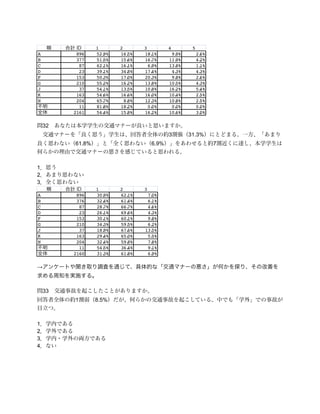
The document contains data presented in tables and charts. The first table shows that 57.6% of respondents chose 5 on a scale, with lower percentages for other options. The second table shows that 54.4% of responses were between 1-1.5 on another scale, with lower percentages in other ranges. The third chart shows the percentage breakdown of responses across 7 categories.


![[대학내일20대연구소] 청년의 진짜 행복을 위한 청년정책을 찾아서(연구리포트 2018-5)](https://cdn.slidesharecdn.com/ss_thumbnails/ir2018-5-180604052140-thumbnail.jpg?width=640&height=640&fit=bounds)
![[대학내일20대연구소] 소셜 V슈머 세대의 영상콘텐츠 소비 실태 (이슈페이퍼 2017-06)](https://cdn.slidesharecdn.com/ss_thumbnails/v-171025001355-thumbnail.jpg?width=640&height=640&fit=bounds)


