Spc interpreta 00
•
0 likes•1,174 views

SPC Interpretacion de graficos de control con base en las Nelson Rules.

Recommended
More Related Content
Viewers also liked
More from Edgar Mata
More from Edgar Mata (20)
Spc interpreta 00
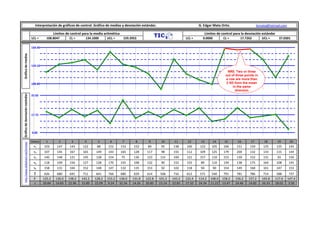
- 1. Interpretación de gráficos de control. Gráfico de medias y desviación estándar. G. Edgar Mata Ortiz. licmata@hotmail.com Límites de control para la media aritmética Límites de control para la desviación estándar LCL = 108.8047 CL = 134.1000 UCL = 159.3953 LCL = 0.0000 CL = 17.7262 UCL = 37.0301 159.40 Gráfico de medias 134.10 NR5. Two or three out of three points in a row are more than 108.80 2 SD form the mean in the same direction Gráfico de desviación estándar 37.03 17.73 0.00 Datos 1 2 3 4 5 6 7 8 9 10 11 12 13 14 15 16 17 18 19 20 http://www.slideshare.net/licmata/ x1 103 147 143 122 88 152 153 152 89 95 138 106 122 105 166 151 159 125 125 145 x2 107 145 167 165 149 143 165 128 117 98 155 112 109 125 179 204 132 133 115 144 x3 140 148 121 145 128 154 75 136 123 131 169 121 157 110 153 139 152 131 93 150 x4 118 109 156 127 128 170 155 108 132 90 152 155 89 110 139 138 175 164 108 145 x5 158 131 104 152 148 147 132 135 153 92 102 118 94 90 154 149 168 161 147 153 Ʃ 626 680 691 711 641 766 680 659 614 506 716 612 571 540 791 781 786 714 588 737 𝑥 125.2 136.0 138.2 142.2 128.2 153.2 136.0 131.8 122.8 101.2 143.2 122.4 114.2 108.0 158.2 156.2 157.2 142.8 117.6 147.4 s 20.84 14.83 22.96 15.89 22.09 9.24 32.34 14.26 20.85 15.14 22.83 17.10 24.34 11.22 13.47 24.46 14.82 16.33 18.02 3.50