Download to read offline
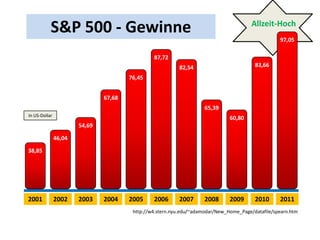
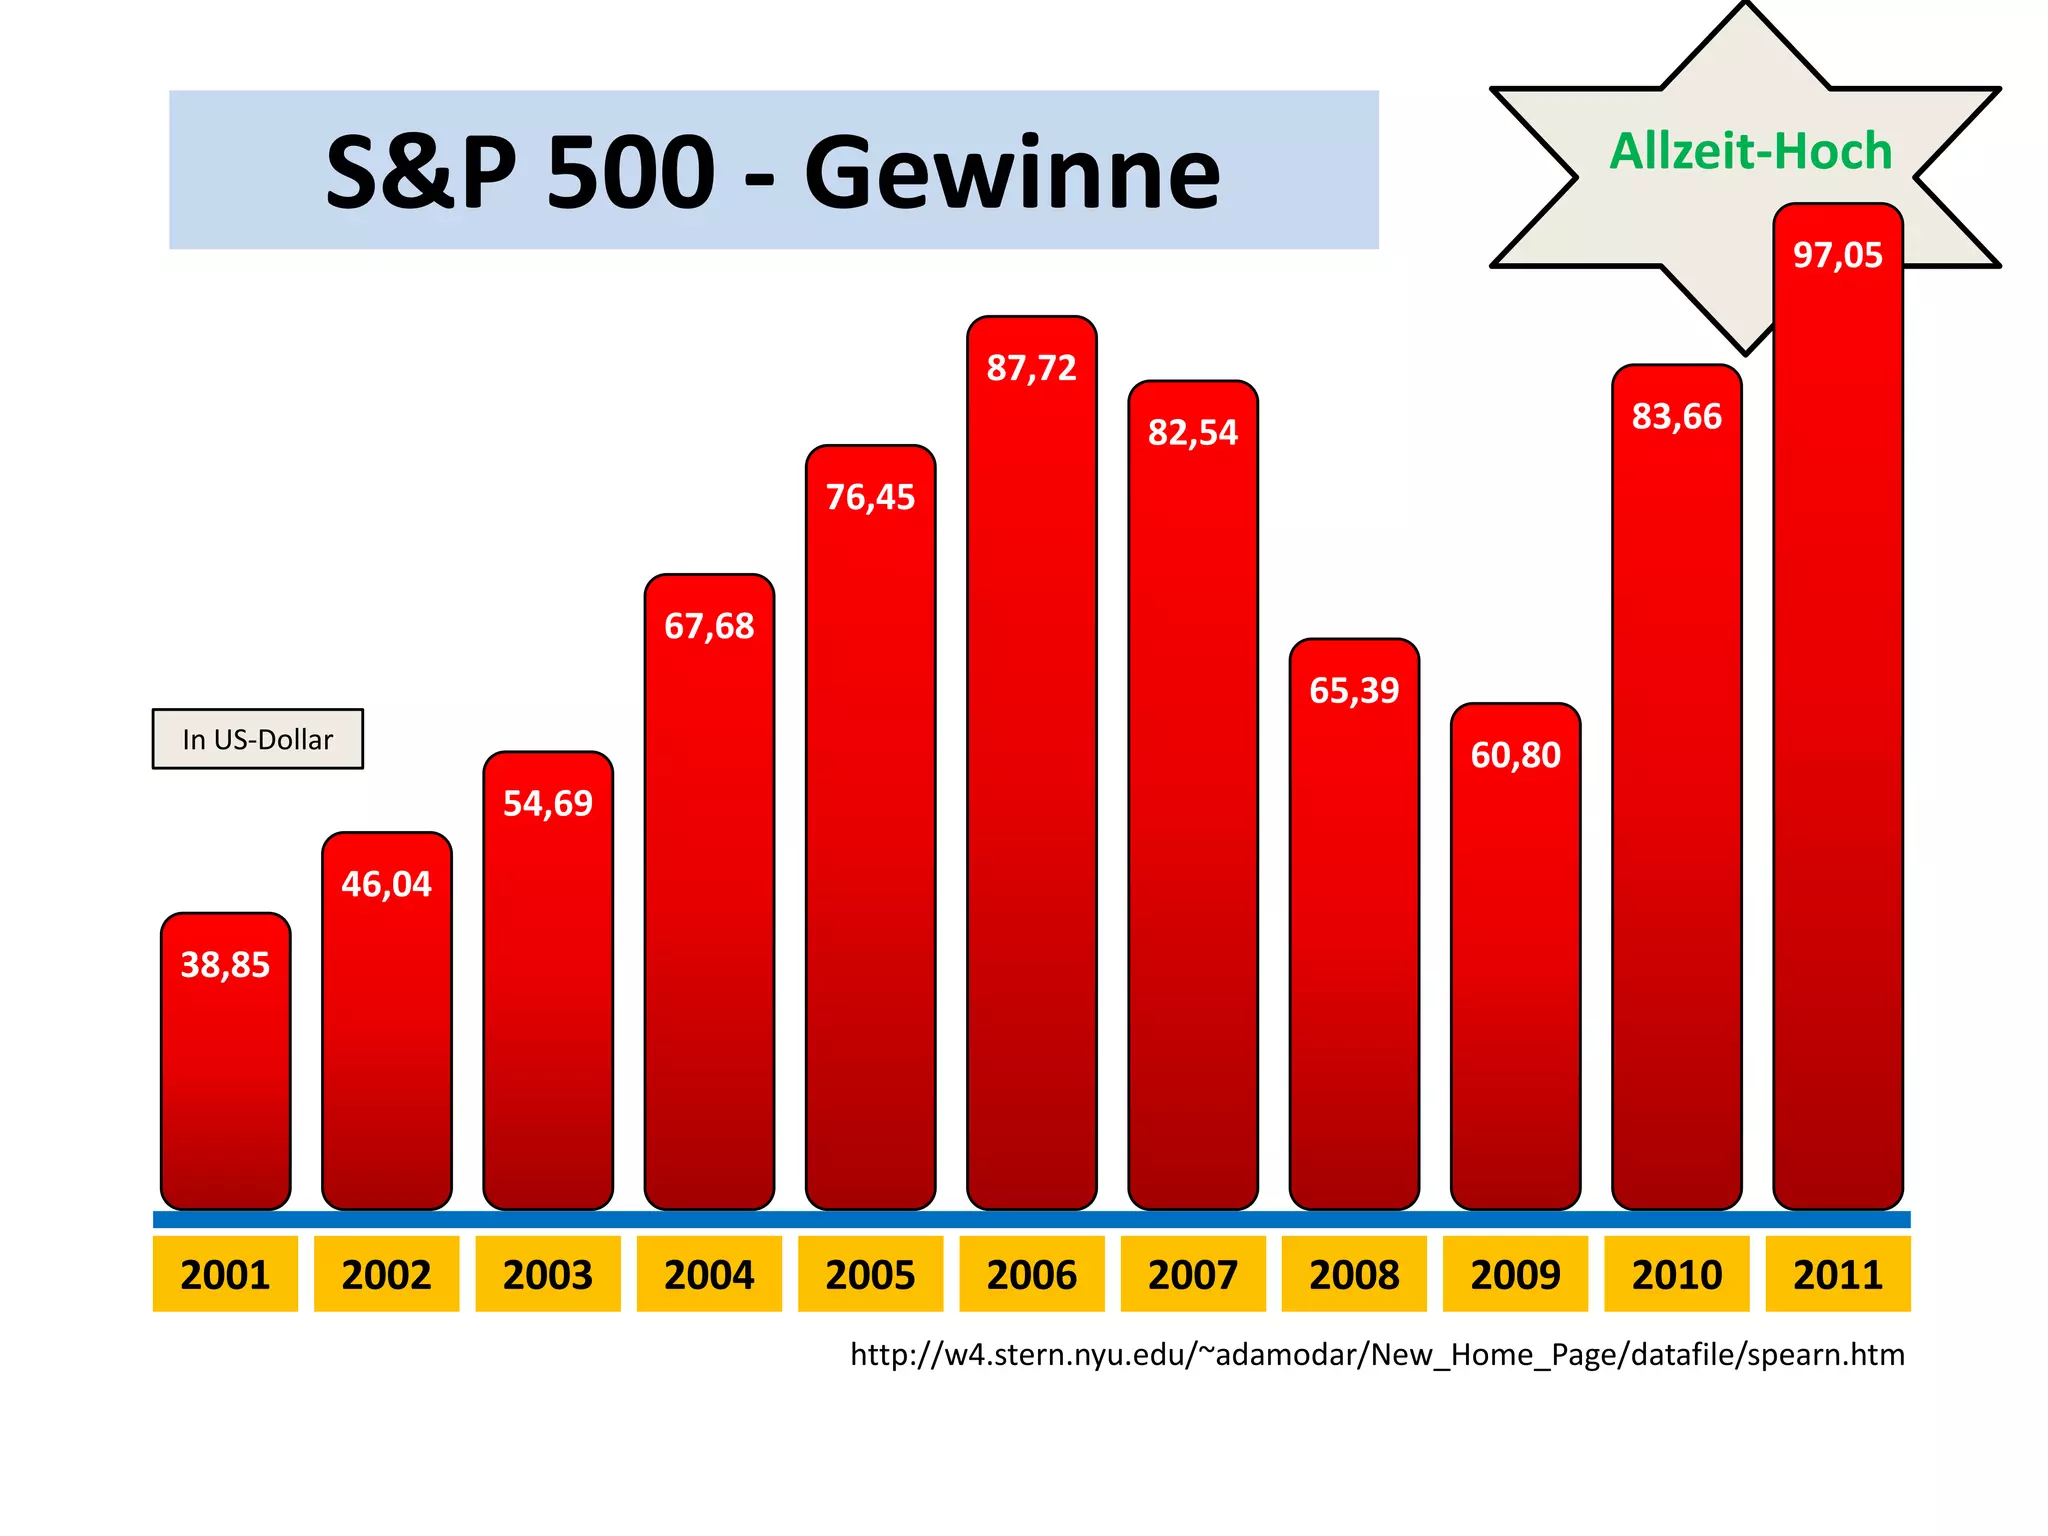

The document is a line graph showing the S&P 500 index over time from 2001 to 2011. It shows the index steadily increasing from around 38 in 2001 to over 97 in 2011, hitting several new all-time highs along the way and declining during the financial crisis in 2008 before rebounding in 2009 and continuing its upward trend. The graph provides a visual representation of the long-term growth of the S&P 500 index over the past decade.


