
Recommended
Recommended
More Related Content
Similar to Sofreco final scoping study - 9 september 2016 (2)
Similar to Sofreco final scoping study - 9 september 2016 (2) (20)
More from Ntalemu
More from Ntalemu (20)
Recently uploaded
Recently uploaded (20)
Sofreco final scoping study - 9 september 2016 (2)
- 1. Federal Democratic Republic of Ethiopia Private Enterprise Programme Ethiopia (PEPE) SCOPING STUDY REPORT NATIONAL COTTON DEVELOPMENT STRATEGY (2015-2030) August 2016 I1904 92-98 boulevard Victor Hugo - 92115 Clichy Cedex - France Tel. +33 1 41 27 95 95 – Fax. + 33 1 41 27 95 82 E-mail: agrind@sofreco.com
- 3. Scoping Study Report TABLE OF CONTENTS TABLE OF CONTENTS.................................................................... 1 ACRONYMS AND ABBREVIATIONS.............................................. 6 PROJECT SYNOPSIS.....................................................................11 EXECUTIVE SUMMARY .................................................................12 1 PROJECT RATIONALE..........................................................19 1.1 Preamble.............................................................................................19 1.2 Rationale of the Consultant’s Services ...........................................19 1.2.1 The Context .........................................................................................19 1.2.2 Consultant’s Services and Milestones .................................................20 1.2.3 Thematic Areas Covered by the Scoping Study..................................21 2 THEMATIC AREA A: PRODUCTION AND PRODUCTIVITY.22 2.1 Production Level and Trend .............................................................22 2.2 Farming systems in Ethiopia............................................................25 2.2.1 Categorisation of Cotton Farms in Ethiopia.........................................25 2.2.2 Production Level for Each Producing Zone ........................................27 2.2.3 Trends of Production............................................................................27 2.2.4 Cotton Production Potential of Ethiopia...............................................29 2.2.5 Consequences from the Production Trends ........................................30 2.2.6 Production 2014-2015 per Production System....................................31 2.3 Production Practices and Trends ....................................................34 2.3.1 Technical Issues ..................................................................................34 2.3.2 Cultivation Practices (Large Scale Commercial Farmers/Smallholders)........................................................................38 2.3.3 Harvest/Post-Harvest Practices (Including Contamination Management) ......................................................................................39 2.3.4 Trends in Cultivation/Post-Harvest Practice ........................................41 2.4 Production Cost and Margins...........................................................41 2.4.1 Price of Seed-cotton per kg Paid at Ginnery/Farm-Gate (Based on Quality/Grade).....................................................................................41 National Cotton Development Strategy - Ethiopia 1
- 4. TABLE OF Contents 2 SOFRECO 2.4.2 Comparison between Ethiopian and West African costs of production............................................................................................46 2.5 Production Constraints.....................................................................48 2.5.1 Technology ..........................................................................................48 2.5.2 Infrastructure........................................................................................48 2.5.3 Labour Shortage ..................................................................................49 2.5.4 Access to Finance................................................................................49 2.5.5 Institutional...........................................................................................49 3 THEMATIC AREA B: PROCESSING AND VALUE ADDITION ...............................................................................52 3.1 Present and Potential Markets for the Ginning Industry ...............52 3.1.1 Identification of Markets for Lint Cotton in Volume and Quality...........52 3.1.2 Estimation of Cotton Lint Surplus/Deficit for 5 Years Historical Statistics Until 2015.............................................................................54 3.1.3 Assessment of Current and Future Demand and Supply of Cotton to the Textile Industry..........................................................................57 3.1.4 Identification of the Cotton Seed Market (Local) .................................60 3.2 Profile and Performance of the Ethiopian Ginning Industry.........61 3.2.1 Profile of Ethiopian Ginning Industry ...................................................61 3.2.2 Standard Cotton Ginning Process .......................................................64 3.2.3 Condition and Performance of the Ginning Industry............................70 3.2.4 Assessment of Other Variable Costs...................................................79 3.2.5 Summary..............................................................................................80 3.3 Value Added in the Ginning Industry...............................................83 3.3.1 Cotton Quality Delivered by the Industry and Grading Procedures (by Ginners and/or Third Parties)........................................................83 3.3.2 Prices Currently Obtained Ex-Ginnery (Lint, Seed, Planting Seed) And Prices Paid For Seed-cotton - Revenues And Value Added In The Ginning Industry...........................................................................87 4 THEMATIC AREA C: COMPETITIVENESS AND MARKET ACCESS..................................................................................89 4.1 Domestic Demand for Imported Lint in Recent Years ...................89 4.2 Constraints to Marketing Efficiency and Opportunities for Improvement......................................................................................92 4.2.1 Assessment of Marketing Efficiency in Terms of Market Information (ICT, MIS)............................................................................................92 4.2.2 Assessment of Marketing Efficiency in Terms of Quality Assessment: Appropriate Standards, Grading System and Procedures..........................................................................................93 4.2.3 Assessment of Marketing Efficiency of Local Lint in Terms of Logistics Costs ....................................................................................97 4.2.4 Opportunities to Achieve a Better Response to Market Signals through Improved Marketing Efficiency...............................................97 4.3 Opportunities, Constraints and Required Support Actions for Accessing New Export Markets.....................................................100 4.3.1 Opportunities, Constraints for Accessing Non-Conventional New Export Markets (Organic, Fair Trade, Sustainable) ..........................100 4.3.2 Export Promotion and Branding of Ethiopian Cotton.........................105 2 SOFRECO
- 5. Scoping Study Report National Cotton Development Strategy - Ethiopia 3 4.3.3 Affiliation and Participation in Appropriate Regional and International Trade Programs ...........................................................106 4.3.4 Handloom...........................................................................................108 5 THEMATIC AREA D: VALUE CHAIN ORGANISATION AND SUPPORTING SERVICES....................................................111 5.1 General Organisation of the Cotton Sector in Ethiopia ...............111 5.2 Price Management System .............................................................113 5.2.1 The Recently Introduced Price Management System For Lint Cotton................................................................................................113 5.2.2 Assessment of Requirements and Constraints for Improving Stakeholders’ Participation and System Sustainability .....................115 5.3 Input Supply Contracting Systems ................................................116 5.3.1 Existing Contracting Systems, Input Packages and Level of Integration along the Value Chain in the Various Production Areas.116 5.3.2 Assessment of the Requirements and Constraints to Secure Adequate Input Supplies, Particularly through Seed Multiplication Systems.............................................................................................117 5.4 Financing Mechanisms of the Value Chain...................................120 5.4.1 Existing Financing Mechanisms in the Sector, both for Working Capital and Investment .....................................................................120 5.4.2 Assessment of Requirements and Constraints to Improve the Financing Mechanisms of the Sector................................................124 5.5 Cotton Research System ................................................................125 5.5.1 Present Status of Cotton Research Programs and Resources (Seed Selection and Others).............................................................125 5.5.2 Current Cotton Research Needs and Gaps.......................................128 5.5.3 Reasons for the low performance of the cotton research..................129 5.5.4 Research Strategies and Directions ..................................................130 6 THEMATIC AREA E: POLICY AND REGULATION.............131 6.1 Assessment of the Existing Specific Regulatory Framework for Cotton...............................................................................................131 6.2 Assessment of the General Regulatory Framework Applicable to the Cotton Sector........................................................................131 6.2.1 General Regulatory Framework for Water Management...................131 6.2.2 General Regulatory Framework for Agricultural Investment support 133 6.2.3 Bio Safety and GMO Regulatory Framework ....................................133 6.2.4 General Regulatory Framework for Industrial Investment .................134 6.2.5 Trade Licences ..................................................................................136 6.2.6 General Regulatory Framework for Standard Elaboration and Enforcement......................................................................................137 6.3 Current Cotton Policy......................................................................138 6.3.1 National Cotton Policy Formulation and Dissemination Processes in Ethiopia .............................................................................................138 6.3.2 Sector Policy Development Requirements vs. Sustainability Criteria for Market Access .............................................................................139 7 THEMATIC AREA F: SOCIAL IMPACT AND ENVIRONMENTAL COMPLIANCE.......................................142
- 6. TABLE OF Contents 4 SOFRECO 7.1 Impact Analysis of Intensive Production Systems ......................142 7.1.1 Introduction ........................................................................................142 7.1.2 Nature and Extend of Economic Impact of Conventional Practices in the Main Cotton Production Areas (Revenue) ..............................144 7.1.3 Nature and Extend of Social Impact of Conventional Practices in the Main Cotton Production Areas ....................................................146 7.1.4 Nature and Extend of Environmental Impact of Conventional Practices in the Main Production Areas (Land Use, Water Management, Pest Management).....................................................149 7.1.5 Potential Impact of GMO Adoption ....................................................157 7.1.6 Lessons Learnt ..................................................................................161 7.2 Sustainability Risks Associated with Climate Change in Cotton Production .......................................................................................162 7.2.1 Climate Change and Subsequent Changes of Farming Practice Observed in the Main Cotton Production Areas................................162 7.2.2 Receptiveness of Cotton Producers to Participate in Weather- Derived Risk Insurance Scheme.......................................................167 7.3 Sustainability Risks Associated with Human Factors in Cotton Production .......................................................................................170 7.3.1 Sustainability of Cotton Production in Relation with Local Communities Rights (Governance)...................................................170 7.3.2 Sustainability of Cotton Production in Relation with the Use of Casual Labour (Health and Safety, Gender Equity)..........................172 7.3.3 Lessons Learnt ..................................................................................173 7.4 Opportunities and Constraints in the Design and Implementation of Sustainable Cotton Projects ..........................174 7.4.1 Assessment of Sustainable Requirements and Trends on Major Export Markets ..................................................................................174 7.4.2 Addressing Social and Environmental Impact in the Design of Sustainable Cotton Projects (Eco-Friendly Technologies) ...............178 7.4.3 Lobbying and Advocacy Requirements in Buyer Countries for Sustainable Cotton Projects..............................................................183 7.4.4 Lessons Learnt ..................................................................................185 APPENDICES: Appendix 1: Monthly Rainfall in Ethiopian Cotton Growing Areas (Long-Term Averages) Appendix 2: Zonal Production in Ethiopia Appendix 3: Cotton Production in Ethiopia 2011-2015 Appendix 4: Main Cotton Pests in Ethiopia Appendix 5: Production Costs in Large Irrigated Farms and in Smallholder Farm Appendix 6: Ethiopian Lint Grading and Price Management System Appendix 7: Estimation of Working Capital Requirements for Two Business Models in the Ethiopian Cotton Sector (For 1 ha) Appendix 8: Documents Received from the Beneficiary in August 2016
- 7. Scoping Study Report National Cotton Development Strategy - Ethiopia 5 Appendix 9: The Cotton Corporation of India, an Example of a Supporting Government Agency ANNEX: Field Visits Reports (as a separate volume)
- 8. 6 SOFRECO Acronyms and Abbreviations ACRONYMS AND ABBREVIATIONS AbTF Aid by Trade Foundation ACA African Cotton Association ACTIF African Cotton and Textile Industries Federation AGOA African Growth and Opportunity Act AILAA Agricultural Investment Land Administration Agency AISCO Agricultural Inputs Supply Enterprise APMC Agricultural Produce Market Committee AwBA Awash (River) Basin Authority BCI Better Cotton Initiative BMP best management practice bph bales per hour Bt Bacillus Thuringiensis CA Conservation Agriculture CBE Commercial Bank of Ethiopia CCI Cotton Corporation of India CmiA cotton made in Africa CO2e carbon dioxide equivalent Cotlook cotton outlook (cotton market monitor) CROPWAT piece of software designed for the calculation of the right amount of water needed for the irrigation of crop fields CSA Central Statistical Agency DAP diammonium phosphate DAE Day after emergence DBE Development Bank of Ethiopia DFID UK Department for International Development DP 90 variety from Delta Pine Seed Company DTMPCI double trigger multiple peril crop insurance
- 9. National Cotton Development Strategy - Ethiopia 7 Scoping Study Report EAC East African Community ECOWAS Economic Community of West African States ECPGEA Ethiopian Cotton Producers, Ginners and Exporters’ Association ECX Commodity Exchange in Addis Ababa EEA Ethiopian Economics Association EIA Environmental impact assessment EIAR Ethiopian Institute of Agricultural Research EIC Ethiopian Insurance Corporation EIIDE Ethiopian Industrial Inputs Development Enterprise ELS Extra-long staple cotton ETB Ethiopian Birr ETIDI Ethiopian Textile Industry Development Institute FAO Food and Agriculture Organisation FDI Foreign direct investment FDRE Federal Democratic Republic of Ethiopia FSU Former Soviet Union FT fair trade GE genetically engineered (crop) GDP gross domestic product GHG greenhouse gas GM genetically modified GMO GM organism GoE Government of Ethiopia GOT ginning out turn GSP generalised system of preferences GTP Growth and Transformation Plan ha hectare HHP highly hazardous pesticide HVI high volume instrument ICA International Cotton Association ICAC International Cotton Advisory Committee of FAO ICT information and communications technology IFAD International Fund for Agricultural Development IFPRI International Food Policy Research Institute ILO International Labour Organisation IPCC International Panel on Climate Change IPM integrated pest management IRAC Insecticide Resistance Action Committee ITC International Trade Centre (Geneva) K potassium kg kilogramme LAFCU Lumme-Adama Farmers Corporative Union
- 10. 8 SOFRECO Acronyms and Abbreviations m metre m 2 square metre m 3 cubic metre METB million ETB MFI microfinance institutions MIS marketing information system(s) MoANR Ministry of Agriculture and Natural Resource of the FDRE MoARD Ministry of Agriculture and Rural Development of the FDRE MoFED Ministry of Finance and Economic Development of the FDRE MoI Ministry of Industry of the FDRE MOWIE Ministry of Water, Irrigation and Energy of the FDRE MS Microsoft Company MSP minimum support price Mt million t MUSD million USD MW megawatt N nitrogen NBE National Bank of Ethiopia NGO non-governmental organisation NISCO Nyala Insurance SC NMA National Meteorological Agency NSC National Steering Committee for Cotton NVRC National Variety Release/Registration Committee NWG National Working Group ºC degree Celsius OE Organic exchange OPP Obsolete Pesticide Project P phosphorus Pan UK Pesticide Action Network UK PEPE Private Enterprise Programme Ethiopia (funded by DFID) PP polypropylene PPP public-private partnership qt quintal RBA River Basin Authority RBO River Basin Organisation RR “Roundup Ready” (GM crop tolerating glyphosate herbicide) SC seed-cotton SC share company (when following a firm name) SEEP ICAC Expert Panel on the Social Environmental and Economic Performance of Cotton Production SMART specific, measurable, attainable, relevant, trackable (criteria or indicators) SNNP Southern Nations, Nationalities, and Peoples' Region of the FDRE t tonne (metric)
- 11. National Cotton Development Strategy - Ethiopia 9 Scoping Study Report TC technical committee TIDI Textile Industry Development Institute TIN Tax payer registration number TWG Technical Working Group UK United Kingdom UN United Nations UNFCCC United Nations Framework Convention on Climate Change US United States (of America) USA United States of America USAID US Agency for International Development USD US dollar USDA US Department of Agriculture VSI voluntary sustainability initiative WAF West Africa WARC Werer Agricultural Research Centre WB The World Bank WCED UN World Commission on Environment and Development WCP water crop productivity WFP World Food Programme WICI weather index crop insurance WRSI water requirement satisfaction index All dates are according to the Gregorian Calendar (day/month/year).
- 12. 1 0 SOFRECO Acronyms and Abbreviations Disclaimer This study has been prepared by SOFRECO from information provided by the Ministry of Industry of the Federal Democratic Republic of Ethiopia and a number of other sources. Neither SOFRECO nor the UK Department for International Development (DFID) nor DAI Europe Ltd take any responsibility for losses incurred by any person or government or corporate body which relies on the information contained in this report. The contents of this study are the sole responsibility of SOFRECO and can in no way be taken to reflect the views of DFID or any organisation mentioned in the report.
- 13. National Cotton Development Strategy - Ethiopia 1 1 Scoping Study Report PROJECT SYNOPSIS Designation Information Client: DFID Beneficiary: Federal Democratic Republic of Ethiopia Oversight Body: Ministry of Industry Programme: Private Enterprise Programme Ethiopia (PEPE) (2013-2020) Assignment: National Cotton Development Strategy (2015-2030) Contractor: DAI Europe Ltd 2nd Floor, 63 Gee Street, London EC1V 3RS, UK Subcontractor (or the Consultant) SOFRECO 92-98, boulevard Victor Hugo, 92115 Clichy cedex, France Subcontract Agreement Reference Number 14013B/PO1355/Sofreco Dated 26 November 2015 Amendment No. 1 Signed on 11 December 2015 Amendment No. 2 Signed on 29 March 2016 Amendment No. 3 Signed on 19 May 2016 Mission Supervision and Guidance: Technical Working Group (TWG) of the National Steering Committee (NSC) for Cotton Start/End: 01 December 2015 – 19 August 2016
- 14. 1 2 SOFRECO Acronyms and Abbreviations National Cotton Development Strategy - Ethiopia 11
- 15. National Cotton Development Strategy - Ethiopia 1 3 Scoping Study Report EXECUTIVE SUMMARY Ethiopia now produces on average 55,000 tonnes lint cotton for the past 5 years (2011-2015). the current gap is 20,000 tonnes lint yearly gap to meet the domestic demand of the developing textile industry. It targets at least lint self-sufficiency and eventual surplus for export when the estimated country production potential is fixed at 1 million tonnes seed-cotton. The present due diligence of the national cotton value chain is the first stage towards the further identification of a (2015 – 2030) National Cotton Development Strategy and of a relevant Road Map. It has been implemented through field visits, from December 2015 to June 2016, in 6 Regions cumulating more than 90 % of the cotton production (quoted by alphabetic order: Afar, Amhara, Benishangul Gumuz, Gambela, SNNPR, Tigray) as well as through meetings with a very broad range of stakeholders of the value chain. Six core thematic areas are tackled. Thematic Area A - Production and Productivity Ethiopian farmers have been growing cotton for centuries and it still remains the traditional smallholder cash crop grown from first rains (mid-June to end September) to harvest (September – December) on est. 80,000 ha, out of which 40,000 ha by small producers (including 30% irrigated) and 60,000 ha by commercial farms. The 136,000 tonnes/year national production is built from yields ranging from 2-3 t/ha raw cotton in irrigated areas to 1.2 – 1.7 t/ha in rainfed farms. The lint gap (20,000 tonnes/year) is compensated by imports now monopolised by a state company. The value chain provides incomes to est. 57,000 smallholding cotton farmers, jobs to est. 150,000 workers employed in 1,020 cotton producing commercial farms and est. 2,000 jobs in 21 ginneries. Large-scale “commercial” and medium-scale cotton farms contribute to more than 70% to the nation’s lint production, many of them producing under irrigation (Awash and Omo valleys) while Western Ethiopia (Humera, Metema, Benishangul- Gumuz, Gambela) depends on rainfalls. Smallholder production is mainly constrained by low technical productivity (compared to large-scale irrigated or mechanised farming), climatic changes effects and the competition of more profitable cash crops. Cultivation practices are quite different from large mechanised farms to smallholder farms. Regarding the latter, irrigated cropping in the Afar Region and South Omo
- 16. 1 4 SOFRECO Acronyms and Abbreviations 12 SOFRECO
- 17. National Cotton Development Strategy - Ethiopia 1 5 Scoping Study Report area follows mono-cropping whereas the cropping system in the rainfed areas of Western Ethiopia is mixed (i.e. sesame, sorghum and maize). Farmers in North Gondar (Amhara Region) recently adopted the CmiA 1 sustainable production system while farmers in the Arba Minch area (SNNPR) try to start organic 2 cotton production The “no change” long-term trend partly explains the very modest improvement of technical productivity or production. Apparently no cotton growers use herbicides although weeding is a serious issue requiring a lot of hand labour difficult to get. However, progress is noticed (ex: jute instead of polypropylene bags to control contamination). Unlike lint, there is no seed-cotton market price system but there has been a steady decline in the price of seed-cotton during the last two years. Although there are no clear data on this issue, most of the cotton produced in Ethiopia is actually sold as lint and seed, after commission ginning. The high trash content in seed- cotton is directly correlated to the absence of quality-supportive incentive. Lint (and consequently seed-cotton) price decrease lead to very low even negative gross margin of the cotton crop. Unless productivity increases (yields) and/or some of the costs can be reduced, only an increase of the price of seed-cotton, up to at least 12 ETB/kg, can make cotton an attractive crop for farmers and lead to a significant increase of production. Technical constraints to improving cotton productivity and production may easily be reduced or removed in the short-term but the medium to long-term binding constraint require a proper strategy of development of the sector. Challenges as land development, input supply, availability of farm machineries and implements, ginneries, oil pressing mills could be considered as potential investment opportunity areas whereas others like cotton classification and grading, marketing, technology generation and dissemination can be addressed through coordination, collaboration, partnership, information technology, training and professional management Thematic Area B - Processing and Value Addition There is 21 installed plants, 16 ginneries are operational, providing approximately 2 000 jobs. Most plants are using the saw ginning technology (17). Global estimated capacity is 180,000-270,000 tonnes seed-cotton per season but their geographical distribution leads to ginning capacity gaps (2,000 t/year in Gambela up to 42,000 t/year in Tigray) except in Addis Ababa (4 units 37,000 tonnes with 1 not functional) and Oromia (5 units 116,000 tonnes). This unbalanced geographical distribution is being compensated by a trend to relocate westwards, when cotton competes with other crops for water resources. Poor infrastructure and outdated technology impact production and maintenance costs as well as the lint and seed quality when seed-cotton is handpicked with high trash and contaminant concentration. Other negatively impacting factors are: storage infrastructure deficiency, missing equipment along the processing line (feed control, lint cleaning, moisture restoration, bad quality bales cover, rare fire protection), lack of quality control. 1 Cotton made-in Africa. 2 Not certified yet.
- 18. 1 6 SOFRECO Acronyms and Abbreviations National Cotton Development Strategy - Ethiopia 13
- 19. National Cotton Development Strategy - Ethiopia 1 7 Scoping Study Report Ginning yield only is 36 % in Ethiopia, to be compared to 42 % in Western Africa (both handpicked) Ginneries operation face numerous constraints: due to inadequate geographical capacity distribution, frequent long distance raw cotton transport leads to high costs and insufficient moisture content at ginning impacting fiber quality, raw cotton contamination (stones, polypropylene,..), shortage of labour force in Addis and Afar Regions linked to low wages and mitigated by migrants from the South, frequent power cuts, difficult access to spare parts (and to foreign currency), long terms of payments and poor support from the banks, no curriculum and resource for specific staff training. The major business model prevailing is that of private self-standing companies only providing ginning services with the exception of Tiret (Amhara) ginning for producers and traders and buying cotton, and ELSE International Ginnery & Spinning developing integration through a 560-ha farm in the Omo Valley to overcome quality problems. Please explain the business models properly a) farm integrated ginners b) self- standing c) fully integrated ginnery (garment/textile/spinning/farm). Contract farming is poorly developed due to the following factors: delivery time and schedule are generally not met, product remote quality control is practically impossible, rain-fed production contracted quantity delivery is at high risk, Middlemen are managing the cotton marketing scheme and are missing real market links and no raw cotton quality control is applied. Thematic Area C – Competitiveness and Market Access Ethiopian Supply and Demand, and Positioning Since 2010, consumption has shown a strong growth in Ethiopia and has increased by 3 times. It is now lagging behind, stabilising at about 40,000 t/year and, since 2014, Ethiopia is a net importer of cotton, mainly from India, including some organic. Cotton seeds production has increased accordingly but market easily absorbed this production since cotton edible oil is popular and the demand for cattle feeding is strong. Ethiopia vs. East Africa: Ethiopia represents today about 50% of total East Africa consumption, Tanzania being the second largest consumer. East Africa is traditionally a cotton exporter, led by Tanzania but East Africa production has strongly decreased in the past year, because of unfavourable international prices and a complex local market situation. Imports, excluding Ethiopia, in East Africa remain negligible: Ethiopia can only rely on its own consumption to find a local/regional market. Overseas: mainly due to China’s strategic policy, world cotton market is full of stocks, accounting for almost one year of consumption. However, since 2014 China has shifted its policy and is now releasing huge stocks on its domestic market. This now strongly limits China’s imports, while the Chinese imports represented the main cotton market driver for the last 15 years. World export opportunities are rare. Currently, China is getting rid of its stock and started buying new stock which is inducing world price to increase nowadays. On the longer term (2025) perspective, China will again be a strong importer as well as Vietnam, Indonesia, Bangladesh or Turkey, which will have a strong
- 20. 1 8 SOFRECO Acronyms and Abbreviations consumption growth. Only Turkey has a domestic production (covering roughly 50% of their past requirements). Indonesia, Vietnam and Bangladesh are fully dependent on imports. The USA, India and Central Asia will remain important 14 SOFRECO
- 21. National Cotton Development Strategy - Ethiopia 1 9 Scoping Study Report exporters, but exported quantities shall remain stable. However, West Africa and Brazil shall increase their exports. Becoming a major cotton exporter will obviously imply to compete with the West African exporting countries. Ethiopia is in deficit of cotton, and it shall increase over the next years due to consumption growth while exports possibilities, within East Africa or in the World, appear today limited, because of huge world stocks and lower imports demand. Competition with Brazilians or West African cotton will be very challenging, especially considering their quality: very low contamination, homogeneity, high grade and long staple length. Ethiopian strong domestic consumption represents a huge opportunity with both industrial and handicraft textile industries able to absorb a wide variety of cotton. Export Opportunities Despite the Ethiopian cotton deficit context, three labels have a good development and visibility in international markets: BCI (for Better Cotton Initative), CMiA and Organic cotton. They have been created for final users who want to make sure that purchase environmentally and socially friendly items. They are an opportunity to tap with a clear potential advantage. Joining international cotton associations can also help Ethiopian cotton to be more visible in the world market (International Cotton Association created by merchants and spinners 175 years ago, African Cotton Association, pan African producers Association) and the AGOA program provides the competitive advantage of trade preferences with USA for export of finished products. Ethiopia also benefits from EU prefercial trade agreement, i.e. EBA which is the 80% destination for the garment export . Muya Brand (Addis Ababa) and Jano Hand Craft (Arba Minch) illustrate success stories confirming that handloom market opportunities are huge since it can process almost any cotton quality. Assessment of Cotton Quality Constraints Seed-cotton received at the ginneries is not representative of what handpicked cotton should be: leaf content is far too high, contamination is very important (jute bags, PP or PE covers). Long transportation from fields to gins, a lot of dust, water and oil also deteriorate seed-cotton quality. It is not known if Ethiopian cotton is sticky or not and where. Seed-cotton quality has room for improvement, from fields to gins, in order to improve cotton profitability and reputation. Lack of quality monitoring and control: cotton quality is determined by the spinners, when transformed. Made at this stage of the value chain, it is too late since it may average down sale price because of non-homogeneous lots. Farmers do not know exactly which quality they produce, ginners do not know exactly the quality of the seed-cotton they are paying for, and spinners never know what they will have available for spinning. Cotton quality grading in Ethiopia is more demanding than international requirements: grading is based on HVI (technological grading) asking 48-hour conditioning for testing, following American standards (complicated criteria for non- textile engineers). HVI is currently utilized by ETIDI to test lint cotton and yet not decentralized upto district level. This renders difficult any monitoring from fields to gins and limits reactivity. Visual classing (basis of handpicked cotton) is rapid and generally very efficient; it is following very simple criteria understandable by all actors of textile industry: farmers, ginners and spinners. It is on this basis that the
- 22. 2 0 SOFRECO Acronyms and Abbreviations majority of offers are being made on the international market. National Cotton Development Strategy - Ethiopia 15
- 23. National Cotton Development Strategy - Ethiopia 2 1 Scoping Study Report Quality monitoring and grading have to bring clarity to quality in order to enable farmers and ginners to pay/receive the right price and spinners to be offered homogeneous lots meeting their specific requirements. Assessment of Constraints in Terms of Market Framework The market framework offers a lot of different combinations to market seed-cotton or cotton lint inside the industry. It reduces market transparency and clarity for smaller operators. EIIDE (a Governmental body) intervention is targeting to encourage cotton cropping by providing liquidity in relationships between producers and spinners but also provides some credit facilities and handles cotton imports. EIIDE has no limit in volume or value to support liquidity, but it seems that members are in great need of training about what cotton market is and how to improve their competences for a better performance. Yet, EIIDE only buys lint cotton and yet not raw cotton/seed cotton. EIIDE intervention is one year old it may then be an opportunity to evaluate this organisation and clearly define its role to contribute to the simplification of Ethiopian cotton market and improve all operators efficiency and transparency. The organization has also serious limitation on the number of geographically distributed warehouses. Farmers are bearing a lot of risks and this may be limiting their willingness to produce more cotton. This is also detrimental to ginners who may not have as much cotton to gin as they expect. Market fluidity is also impacted by logistics challenges. Limited quality control and monitoring worsen this situation since there is no clarity for the operators about these crucial pieces of information: what is produced? what is available? what is required? This is particularly the case for the handloom sector, which could generate much more work, added value and demand. Today, farming appears to be the crucial point for the textile industry development: no farmers, no cotton! Thematic Area D – Value Chain Organisation and Supporting Services and Thematic Area E – Policy and Regulation Input Supply There are very few contract farming systems where a large farm would supply the inputs to out-growers, mainly because of lack of financing capacities. Fertiliser imports are undertaken by AISCO (public company) based on declared farmers. Cooperatives deliver inputs to smallholders, through a credit system, based on loans from commercial banks often guaranteed by the Regional Government. The other inputs are most of the time supplied by private dealers. The Difficult access to foreign currency represents indeed a limiting factor for the supply of critical inputs (such as the insecticides for instance). Cotton seed production and supply are poorly organised, most of the seed being supplied by a few large farms using the same seed from year to year. A seed certification system, involving the cotton research centre, private breeders and seed multiplication farms is necessary. Value Chain Financing Ways of investments and working capital cotton production financing depend on the farms size:
- 24. 2 2 SOFRECO Acronyms and Abbreviations 16 SOFRECO
- 25. National Cotton Development Strategy - Ethiopia 2 3 Scoping Study Report Development Bank of Ethiopia (DBE) finances new or expansion of large investments projects in the agricultural sector (including cotton) with a 200 ha minimum cultivated area. Despite assessments of business plans by the Bank and a close monitoring of the use of the funds is expected, it appears that large amounts of funds have been actually diverted from their initial purpose during the last years. Commercial Bank of Ethiopia (CBE) provides loans to large commercial farmers (minimum 30 ha of land), after assessment by a technical team. Cooperatives face difficulties and are dependent on guarantees from government bodies to obtain loans from the banking system; so far, they are not able to purchase the seed-cotton produced by their members (or very small quantities) and private dealers finance this operation. Smallholders rely on micro-finance institutions, usually efficient but with serious challenge in , but not suitable to finance investments (high interest rates). Considering the two main cotton business models (seed-cotton and lint sale), requirements in working capital financing are quite similar for the two main cotton business models (seed-cotton and lint sale): about 25,000 ETB/ha or est. 2.5 billion ETB for a 100,000 ha cotton area. Thematic Area F – Social Impact and Environmental Compliance Agro-climatic conditions are good (as for instance in the Gafo Goma zone, SNNPR), conventional practices, along with limited diversification efforts appear sufficient to secure satisfactory margin, despite high costs and delays of imported inputs, coupled with high logistics costs. The economic attractiveness of organic production is limited. Social impact: commercial farms provide a series of benefits on top of wages, usually including housing, food, drinking water and medical treatment. Workers exposure to pesticides is generally high, due to frequent lack of personnel protective equipment but varies with the region and the practices. Despite the freedom of association, no workers association operates in the cotton farming industry. (pls include some few words on the social impact on workers and surrounding neighbours). Environmental impact: there are significant variations in the proper use of pesticides on cotton, depending on regions. Water management: surface irrigation is the only methods practiced on cotton but farmers are sometimes facing increasing difficulties in getting sufficient amounts of water (for instance: Omo Valley). Salinisation represents an acute problem for land use, and is in progress. The Werer Agricultural Research Centre has been studying water management practices but its findings did not reach end users and practices are largely unchanged. Soil conservation: large scale commercial farms have sometimes been growing cotton for many years, without any rotation and mostly without fertiliser. Good soils (volcanic, black cotton soils) offer the “mining agriculture” farming system opportunity, which is not sustainable in the long run. While alternative conservation agriculture on large cotton farms is becoming in many countries a major agronomic issue (for instance: no tillage in Brazil), they have not reached Ethiopia so far. Biodiversity and land use: in many areas (for instance: South Omo area), the number of trees to be kept in the fields for environmental protection and biodiversity are not considered by investors, some of them being even engaged in
- 26. 2 4 SOFRECO Acronyms and Abbreviations National Cotton Development Strategy - Ethiopia 17
- 27. National Cotton Development Strategy - Ethiopia 2 5 Scoping Study Report charcoal production while clearing the forest. In some cases, local communities are being pushed towards National Parks (for instance: Mago, Hamar & Bana National Parks) and the game population is drastically reducing. Climate change: country wide studies and projections have shown that average climatic variables will shift and weather variability will intensify; future temperature projections of the IPCC mid-range scenario (compared to the 1961 to 1990 normal) predict an average rise of temperature by 0.9 ºC to 1.1ºC by 2030, 1.7 ºC to 2.1ºC by 2050 and 2.7 ºC to 3.4ºC by 2080. Rainfalls should increase by 1.4 to 4.5%, 3.1 to 8.4%, and 5.1 to 13.8% over 20, 30 and 50 years respectively. While cotton production is not likely to be affected unfavourably by these two factors, the increase in frequency of extreme climatic events is critical: 4 out the 7 censored floods and one of the 3 censored droughts in the 1960- 2010 period occurred in the last 12 years. In 2014, violent floods in Middle Awash practically destroyed all cotton crops. Against this background, weather insurance packages relevant to small farmers were introduced in three regions in 2010 by NYSCO Company, based on a rainfall deficit computation panel. Farmers’ unions are the main availing channel of such micro-insurance products. By the end of 2010, the number of farmers insured was over 2,000, for food crops essentially, notably grain legumes. No cotton producers union joined the scheme yet, and no commercial investor has really expressed interest for such a scheme. Sustainable cotton requirements and trends on export markets: the supply increased significantly in the last few years. It was estimated to represent 8% of global production in 2014 and its share should reach 13% in 2015. Nearly 2 million tonnes of Better Cotton were produced in 2014 and the gap between production and consumption however is widening. Better Cotton ginner uptake was just below 50% of production in 2014. In spite of major brands and retailers having committed to source more sustainable cotton (IKEA commitment: 100% sustainable in 2015 for instance), sustainable sourcing has slipped down the agenda of many others mainly due to a lack of awareness of sustainable cotton, a confusing number of labels on the consumer side, and difficulties to manage sustainable cotton supply on company side. The Voluntary Sustainability Initiatives (VSIs) are stepping stones on the way to organic production and Fair Trade, which are the most demanding systems requiring sustainable cotton farming complex systems (but similar systemic concepts may also be applied to other VSI) and also requiring a sustainable cotton farm environment, involving trade relations between farmers and the value chain, and supporting services in terms of finance, research and education. Lobbying and advocacy for sustainable cotton projects in buyer countries: it falls under the framework of the four pillars - GoE’s green economy strategy. Ethiopia could tap into climate funding for GHG abatement, notably the carbon market and emerging international funds under the UNFCCC (cf. Australia’s industry’s best management practice program and specific module for the management of cotton farms natural assets).
- 28. 2 6 SOFRECO Acronyms and Abbreviations 18 SOFRECO
- 29. National Cotton Development Strategy - Ethiopia 2 7 Scoping Study Report 1 PROJECT RATIONALE 1.1 Preamble The present document is the Scoping Study foreseen in the Terms of Reference (ToR) of the above Project. A first issue (rev1) was developed from Consultant’s meetings and investigations in Ethiopia from 30 November 2015 till 11 May 2016, including several visits in Addis Ababa, its surroundings and in other FDRE Regions. A second issue (rev2) was issued following additional field visits in the SNNPR and in Tigray Region. The present final issue follows the National Validation Workshop held in Addis Ababa on 12 July 2016 and chaired by their Excellencies the Minister of Industry and the Minister of Agriculture and Natural Resources. Some useful documents were also transmitted to the Consultant following the Workshop (see list in Appendix 8). 1.2 Rationale of the Consultant’s Services 1.2.1 The Context The Federal Democratic Republic of Ethiopia is a landlocked low income country of the Horn of Africa with a high central plateau and lowlands around, divided by the South/North Great Rift Valley. It has a 99.5 million multi-ethnic and multi-religion population on a 1,104,300 km 2 territory (including 104,300 km 2 lakes) and natural resources are concentrated on small reserves of gold, platinum, copper, potash, natural gas and hydropower. The country is a federation of 9 regional states (divided into woredas and kebeles) with full legislative, executive and judicial powers over their own internal affairs, and two self-governing cities (Addis Ababa and Dire Dawa). Cotton is grown on an estimated area of 80 000 ha, out of which 40 000 ha by small producers (including 30% irrigated) and 60 000 ha by commercial farms, with a national production estimated to 55,000 tonnes of lint per year.
- 30. 2 8 SOFRECO Acronyms and Abbreviations National Cotton Development Strategy - Ethiopia 19
- 31. National Cotton Development Strategy - Ethiopia 2 9 Scoping Study Report Yields are ranging from 2-3 t/ha raw cotton in irrigated areas to 1.2 to 1.7 t/ha in rainfed farms. More than 90% of the domestic production is concentrated in 6 states where most areas receive rain from mid-June to end September. Cotton is harvested in the September – December period (see Appendix 1: Monthly Rainfall In Ethiopian Cotton Growing Areas). Cotton production provides incomes to an estimate of 57 000 smallholding cotton farmers, jobs to an estimate of 150 000 workers, employed in 1 020 cotton producing commercial farms; Cotton ginning employs an estimate of 2 000 people in 21 ginneries. The national production does not meet the demand of the expanding textile industry and the gap, estimated 20 000 tonnes lint/year on average, is compensated by imports now monopolised by a state company. The Government seeks opportunities to develop the textile, garment and apparel sector on the basis of the following assets: o Promotion of incentives to attract investment, including FDI, in a developing industry, o Availability of trainable labour force and low cost electricity, o Technically estimated potential for domestic cotton production (3 million ha whenmillion is cultivated) to overcome the 20, 000 tonnes/year lint deficit now compensated by currency-costing imports for the textile/garment/apparel industry. 1.2.2 Consultant’s Services and Milestones In this context, the Government has transferred responsibility of the cotton sector from the Ministry of Agriculture to the Ministry of Industry (MoI) two years ago and the latter leads the present identification of a National Cotton Development Strategy (2015-2030) to be integrated in GTP 2 once endorsed by Ethiopian Authorities. After implementation of a tending procedure, a subcontract agreement number 14013B/PO1355 has been signed accordingly between DAI Europe Ltd and SOFRECO on 26 November 2015 for the DFID-financed Private Enterprise Programme Ethiopia (PEPE) supporting the Ministry of Industry (MoI), with the purpose to design a National Cotton Development Strategy. This Scoping Study report involved the participation of: 7 international experts; and 7 national experts, from 30 November 2015, date of first meeting in Addis Ababa with His Excellency Ato Tadesse, State Minister at the Ministry of Industry, till submission of this report. Visits by the Consultant to stakeholders were performed in the periods: December 2015; March-April 2016; and in May-June 2016 (thanks to Amendment 3 to the Consultant’s Contract). Field visits reports are presented as a separate volume in Annex.
- 33. National Cotton Development Strategy - Ethiopia 3 1 Scoping Study Report 1.2.3 Thematic Areas Covered by the Scoping Study The following Scoping Study report is structured according to the 6 thematic areas defined in the ToR, namely: Thematic Area A: Production and Productivity; Thematic Area B: Processing and Value Addition; Thematic Area C: Competitiveness and Market Access; Thematic Area D: Value Chain Organisation and Supporting Services; Thematic Area E: Policy and Regulation; Thematic Area F: Social Impact and Environmental Compliance.
- 34. 3 2 SOFRECO Project Rationale National Cotton Development Strategy - Ethiopia 21
- 35. National Cotton Development Strategy - Ethiopia 3 3 Scoping Study Report 2 THEMATIC AREA A: PRODUCTION AND PRODUCTIVITY 2.1 Production Level and Trend It is widely believed according to anecdotal sources that Ethiopia recently added more value than any other sub-Saharan Africa to the cotton-textile value chain. Current seed-cotton production levels however still explain neither the cotton sub- sector’s potential nor the satisfying of domestic-industry’s demand. Recent years have seen a decline in cotton production levels which may be explained by factors such as (i) market fluctuations 3 , ( ii) (iii) the comparative advantage in rain-fed production of other crops such as sesame and sorghum (Berhanu and Asefa, 2014). Large-scale “commercial” and medium-scale cotton farms contribute on average more than 70% to the nation’s lint production and many of these farms produce under irrigation especially in the Awash Valley and the Omo Valley. Some of the Western Ethiopia farms such as those in Humera, Metema, Benishangul-Gumuz and Gambela however depend on rain-fed cotton production. Large-scale farmers struggle against natural and human made uncertainty such as the emergence of new pest, water-scarcity and salinity. There are also and perhaps more importantly human-made factors that are critical to the survival of these cotton farms such as security 4 and land-use rights 5 . Large-scale farmers and smallholders depend on1980s-varieties but they are believed to have lost their potential-yield-capacity and fibre quality through identity-change that in turn was due to outcrossing and mixing in the ginnery or elsewhere. It is generally acknowledged however that there is vast potential in Ethiopia for increased large scale farms and smallholder production of cotton. It grows in a wide range of ecological zones including areas where food crop production is no 3 Adverse movement in price or quantity demanded. 4 Narrowly-defined such as economic and broadly-defined such as political. 5 Included in previous footnote.
- 36. 3 4 SOFRECO Thematic Area A: Production and Productivity 22 SOFRECO
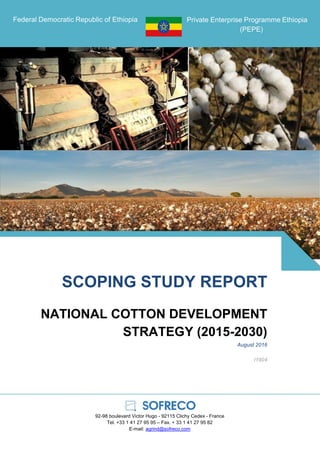
- 37. National Cotton Development Strategy - Ethiopia 3 5 Scoping Study Report longer financially profitable 6 . Ethiopian farmers for centuries grew cotton and it still remains the traditional smallholder cash crop. Smallholder cotton production has been contributing at least 30% to total cotton production and mainly satisfying the demand of the handloom industry and weavers. However, smallholder production is mainly constrained by: Low technical-productivity compared to that of the large-scale irrigated or mechanised production; Climatic changes effects; Development of cash crops more profitable than cotton. The low cotton productivity 7 of smallholders is mainly due to: Lack of or poor extension service, less research outreach; Lack of access to improved variety and quality-seed; Poor pest control; Knowledge gap in crop-management. The next figure shows a map of the evolution of seed-cotton production (t) in Ethiopia from 2011-2015nshown in Appendix 3 (data from ETIDI). In order to assess the potential of cotton production in Ethiopia, it is necessary to compare the actual cotton area grown (and number of farmers) with the total potential cotton growing area. A table with all the minimum necessary information has been designed and is presented in Appendix 2. It has to be filled up, only with the zones suitable to cotton production in Ethiopia. The table is designed for the previous production year (2015 cropping season), but it would be useful to have the data for the last three years. 8 6 Although comparative advantage is a dynamic process or concept i.e. what is financially profitable today may not be financially profitable tomorrow. 7 Technical productivity. 8 The 2015 cropping season has been bad because of the poor rainy season. National Cotton Development Strategy - Ethiopia 23
- 38. 3 6 SOFRECO Thematic Area A: Production and Productivity Seed-cotton Production (in tonnes) by Region between 2011 to 2015
- 39. National Cotton Development Strategy - Ethiopia 3 7 Scoping Study Report 2.2 Farming systems in Ethiopia 2.2.1 Categorisation of Cotton Farms in Ethiopia It is generally considered that there are two types of cotton farms in Ethiopia: Smallholders; and Large scale “commercial” farms. However, designating large farms as “commercial” farms does not prevent smallholders to not sell their product on the market! Indeed, smallholders usually cultivate and sell one crop (“cash crop”), cotton or sesame for instance as many smallholders are not subsistence farmers in Ethiopia, according to the definition of such of farm, as shown in the table below: Criteria Subsistence farm Commercial farm Purpose of farming Own consumption Profit Size Small Big Use of machinery no machines Machines Relationship of farm with other business no relations A lot, agribusiness There can be several ways of categorising farms, according to their respective objectives. It would be interesting to consider a categorisation that can be useful for the development of the cotton sector, in terms of strategies of support to each of the identified categories of farms. Actually, one could consider that there are three categories of cotton farms in Ethiopia, the main criteria of distinction being the size. There are also other criteria of differentiation such as: The farm machinery; The buildings; The internal organisation; The services supplied or received; The access to finance; The cotton business model. The table below describes the characteristics of the three types of farms. Cotton production can be developed with the three categories of farms, but the motivations for growing cotton are specific to each of them. The identification of those issues will be crucial in order to design a strategy of development of the cotton production in Ethiopia. It should be possible to design “tailor made” support programmes for the three categories of farms: National Cotton Development Strategy - Ethiopia 25
- 40. 26 SOFRECO Thematic Area A: Production and Productivity Typology of Cotton Farmers in Ethiopia Farm Services Services Types size Farm machinery Farm Buildings Internal organisation supplied to other received from Access to finance Cotton business (Area in and credit model ha) farmers other farmers A Small < 30 - None - None 100% family - ++ Tractor services Contract farming Inputs through cooperatives Micro finance institutions No collateral Sale of seed-cotton (to coops or traders) B Medium 30 – 200 + One tractor + plough / disc harrow + Storage facilities Shed Family business: owner = manager + max 2 permanent employees + Tractor services (ploughing) - Inputs through cooperatives Loans from commercial banks Collateral Sale of seed-cotton or sale of lint C Large > 200 +++ Several tractors + various kinds of machinery +++ Several kinds of buildings (storage, workshop, administrative buildings) Owner usually different of the manager; Several departments (Technical, Machinery, Accounting etc.) More than 5 permanent employees ++ Contract farming with neighbouring smallholders - Inputs through cooperatives Loans from commercial banks and Development Bank of Ethiopia Collateral Sale of lint after commission ginning Source: CBE and DBE financing criteria; etc.
- 41. Scoping Study Report 2.2.2 Production Level for Each Producing Zone Unfortunately, data related to zone-disaggregated raw cotton production and number of cotton producers are not available. However, it may be stated that the Afar regional influence in cotton production has recently declined. The Lower Awash Valley was completely converted to state- owned sugarcane production while more than 8 000 ha, historically cultivated to cotton, on the Amibara farm in the Middle Awash Valley were also converted to the production of sugarcane in order to feed the state-owned Kesem Sugar Plant. Currently, the cotton production is nationally more and more concentrated in the Western regions of Ethiopia, although some opportunities may exist in the Somali Region for instance. 2.2.3 Trends of Production For the period 2011-2016, raw cotton production trend at regional level is illustrated in Appendix 3 9 . As zonal-level, raw cotton production data was unavailable or not made available as mentioned earlier. This makes the assessment of the situation very difficult, as the regional level is too wide for detailed analysis of the data. Also, although tables (templates) were provided to the TWG (ETIDI) 10 , no data were supplied to the Consultant about (i) the general farming situation: number of farmers (large scale farms and smallholders), area cropped for the main crops, (ii) the disaggregated figures of irrigated and rain-fed areas per type of farms, (iii) the production per zone, types of farms, etc. To our knowledge, data are available at the various Ministry of Agriculture bureaux (regions, zones and districts), where there are teams of specialists who gather this kind of information. This illustrates (i) a lack of coordination between the Ministry of Agriculture and Natural resource and the Ministry of Industry (ETIDI) and (ii) the absence of an efficient monitoring and evaluation system in the cotton sector. The graphs below show the evolution of the cotton area, production and yield per region from 2011 to 2015: 10 ETIDI is the only designated organization responsible to follow up cotton production throughout the country. National Cotton Development Strategy - Ethiopia 27
- 42. Thematic Area A: Production and Productivity 28 28 SOFRECO The following observations can be made by taking into consideration the existing data:
- 43. Scoping Study Report For the large farms, cotton area cropped and production show significant variations from year to year. As an average over 5 years, cropped area represents 56 000 ha and yearly production 95 000 t. The large farms represent about 70% of the area cropped and 72% of the seed- cotton production. The average (2011-2015) seed-cotton yields are quite similar per region, Afar being the best, thanks to the irrigated farming systems used in the region. 2.2.4 Cotton Production Potential of Ethiopia According to MoANR (2002 and 2008) estimation, Ethiopia has more than 3 million ha potential land for cotton production. The 2002 Report categorised 1 identified potential into: High potential and Medium potential areas. The criteria for categorisation are: Feasibility for full irrigation and availability of abundant water (rivers, ground water); Full mechanisation; and Rainfed production and/or supplementary small-scale irrigation. An area falling into the high potential category is generally a vast lowland suitable for full irrigation and full mechanisation. Medium potential category area is suitable for rainfed production and/or small- scale supplementary irrigation. Under medium potential, the MoARD report included pocket areas that are either growing perennial cotton (Birrsheleko in Amahara Region) or areas that are not growing cotton currently (parts of Borrena, Dedesa, Belesa, Raya Valley, etc.). According to this categorisation, 1,986,530 ha (or 66%) of the potential is suitable for full irrigation while 1,014,280 ha (or 34 %) potential is suitable for rainfed and small-scale supplementary irrigation. However, aforementioned potential is also suitable for various crops (industrial, cash and food crops). High potential area is equally suitable for sugarcane plantation while medium potential area is suitable for sesame, sorghum, fruits and vegetables etc. Hence, unless there is a well-defined incentive for cotton production, it could be difficult to exploit identified potential for cotton sector development. For each region (by alphabetical order), cotton production areas are estimated in the following table according to their potential: National Cotton Development Strategy - Ethiopia 29
- 44. Thematic Area A: Production and Productivity 30 30 SOFRECO Region High potential Medium potential Total potential area (ha) area (ha) area (ha) Afar 150,000 50,000 200,000 Amhara 544,303 134,680 678,710 Benishangul 79,930 223,240 303,170 Gambela 262,850 53,600 316,450 Oromia 205,490 201,930 407,420 SNNP 385,400 215,530 600,930 Somali 150,000 75,000 225,000 Tigray 208,830 60,300 269,130 Total 1,986,530 1,014,280 3,000,810 Source: MoARD, 2002, 2008 and Key informants (Ato Bante Kassie, Cotton development directorate, Director- ETIDI, Ato Arkebe G/Egziabher, National cotton Research Coordinator, WARC-EIAR, Dr. Workafes, Team Leader, AILAA – MoANR) Consultant’s comments: This total potential area suitable for cotton is “theoretical” and does not mean that it will or can be sown with cotton. Some other factors have to be considered, as the necessary crop rotation, diversification at farm level etc. It is therefore very difficult to assess a realistic potential figure for cotton production in Ethiopia. However, taking into consideration those figures and comparing with the two largest producers of West Africa, namely Burkina Faso and Mali, with a much lower potential area and a production of 500,000 to 600,000 t/year of seed- cotton, a national production of 1 Mt/y of seed-cotton appears as a realistic objective, which may be achieved over a 10 year-period, for instance. 2.2.5 Consequences from the Production Trends The main production trend is the shift from Eastern to Western Ethiopia. One of the main consequences is the fact that the ginning capacity becomes less and less adapted to the situation. The table and the graph below show the ginning capacity per region (by alphabetical order), in comparison with the average 2014-2015 production:
- 45. Scoping Study Report Ratio Ginning Capacity Average Seed- Ginning Region T seed-cotton/ cotton Production Capacity/SC year 11 2014-2015 Production % Addis-Ababa 36 740 0 NA Afar 31 660 25 000 127% Amhara 54 500 38 400 142% Benishangul 13 700 0% Gambela 9 630 9 650 100% Oromia 116 260 0 NA SNNP 17 510 33 000 53% Tigray 30,00 0 26 700 112.4% Total 273 920 146 450 187% Comparison between ginning capacity and average seed-cotton production (years 2014-2015) per region 150 000 100 000 50 000 0 Ginning capacity Tons seed-cotton / year Average Seedcotton production 2014-2015 Although the total ginning capacity is much higher than the curent production, there is clearly an over-capacity in some region (Oromia, Afar, Addis) and, at the contrary, a deficit in the growing cotton production regions (SNNP, Amhara, Benishangul, Gambela). 2.2.6 Production 2014-2015 per Production System The Appendix 3 shows, for the 2 last cropping seasons, the area grown in cotton and the production of seed-cotton, for the (i) large farms and the smallholders and (ii) the irrigated and rain-fed crops. The table and the graphs below summarise the data for the two years: 11 See chapter 3.2.3 National Cotton Development Strategy - Ethiopia 31
- 46. Thematic Area A: Production and Productivity 32 32 SOFRECO Type of Farm & Farming System Cotton Area (ha) Seed-Cotton Production Seed-Cotton Yield (Qt/ha (T) 2014 2015 2014 2015 2014 2015 Large Irrigated 26 299 13 168 65 748 36 352 25 28 Large Rain-fed 42 311 29 047 71 929 39 754 17 14 Small Irrigated 955 1 476 2 388 3 984 25 27 Small Rain-fed 29 013 21 594 37 723 34 776 13 16 Total 98 578 65 284 177 787 114 866 18 18 45 000 40 000 35 000 30 000 25 000 20 000 15 000 10 000 5 000 0 Evolution 2014-2015 of the area in cotton (ha) per type of farm & farming system Large Irrigated Large Rainfed Small Irrigated Small Rainfed 2014 2015 80 000 70 000 60 000 50 000 40 000 30 000 20 000 10 000 0 Evolution 2014-2015 of the seed-cotton production (Tons) per type of farm & farming system Large Irrigated Large Rainfed Small Irrigated Small Rainfed 2014 2015
- 47. Scoping Study Report Seedcotton yield (Qt / ha) 2014 & 2015 per type of farm and farming system 30 25 20 15 2014 2015 10 5 0 Large Irrigated Large Rainfed Small Irrigated Small Rainfed The year 2015 has been a very bad year for cotton (and other crops), because the rainfall has been poor in most of the regions (actually, there was not enough rain at the beginning of the cropping season and too much at the end). Therefore, it is quite difficult to draw any conclusion of the only two years of data. In terms of relative proportion of each Type of farm/Farming system, the table below show the evolution of the situation from 2014 to 2015 cropping seasons: Year 2014: Type Area Irrigated Rainfed Total Large scale 26,7% 42,9% 69,6% Smallholders 1,0% 29,4% 30,4% Total 27,6% 72,4% 100,0% Type Production Irrigated Rainfed Total Large scale 37,0% 40,5% 77,4% Smallholders 1,3% 21,2% 22,6% Total 38,3% 61,7% 100,0% Year 2015: Type Area Irrigated Rainfed Total Large scale 20,2% 44,5% 64,7% Smallholders 2,3% 33,1% 35,3% Total 22,4% 77,6% 100,0% National Cotton Development Strategy - Ethiopia 33
- 48. Thematic Area A: Production and Productivity 34 34 SOFRECO Type Production Irrigated Rainfed Total Large scale 31,6% 34,6% 66,3% Smallholders 3,5% 30,3% 33,7% Total 35,1% 64,9% 100,0% 2.3 Production Practices and Trends 2.3.1 Technical Issues Soil Fertility and Fertiliser Recommendations The availability of N, P, K, and water are the major constraints in cotton production in most cotton producing environments (Morrow and Krieg, 1990). Nitrogen is the nutrient, to which cotton most consistently responds and plays a major role in determining the expression of a wide range of plant variables such as plant size, fruit intensity, boll retention rate, boll size and total number of bolls per plant (Bouquet et al, 1993; Silvertoothet al, 1999). Nitrogen is generally considered a yield limiting factor in cotton production systems that demand for optimum yield. Time of application of nitrogen is also critical factor with respect to its availability at different crop growth stage. Nitrogen requirement of cotton reaches maximum during the period from peak squaring to blooming and continues through major boll-filling stage (Silver tooth et al., 1999). Most of previous investigations in several cotton producing countries indicated a positive linear relationship between N fertility level and yield. In a 3-year experiment, lint yield increased linearly with N fertility levels each year, attaining maximum yield of 1842 kg ha -1 at 224 kg ha -1 (Fritschi et al., 2003). The authors also reported a positive linear relationship between N fertility level and fibre strength while Boman and Westerman (1994) showed no relationship between fibre strength and N rate. Lower lint quality in terms of fibre length, length uniformity and fibre strength was observed in plots that did not receive N fertilisation (Bauer and Roof, 2004). Sawanet al. (2006) reported significant increase in yield with increase in N rate from 95 to 143 kg ha -1 . The mean values of 2.5 and 50% span length, micronare and flat bundle strength were also significantly increased by the use of the higher N rate but effects were too small to affect use quality. In a long term experiment at Oklahoma, lint yield was significantly increased with application of N and P while K did not affect lint yield (Girma et al., 2007). Nitrogen-deficient cotton may become chlorotic and not photosynthesise enough to meet the demands of plant growth; have reduced leaf area and use water poorly which in turn reduce growth, increase fruit shedding and decrease yield (Radin and Mauney, 1984; McConnell, 1998). Excessive levels may result in excessive vegetative growth at the expense of reproductive development thereby reducing economic yield. Mono-cropping has remained the dominant production system in most of major cotton production areas in Ethiopia with no or little addition of external input which often reputed to result in depletion of essential plant nutrients as well as deterioration of soil physical, chemical and biological properties. Cotton is
- 49. Scoping Study Report considered a low residue crop that may not provide sufficient residue to the soil (Daniel et al., 1999). Thus it can be expected that continued mono-cropping with cotton could result in low total soil N and organic matter and poor soil protection. Middle Awash cotton growing soils are predominantly Vertisols and Fluvisols having alluvial origin deposited from Awash River. Previously, the area was known to be under natural forest and grassland ecology before introduction and expanded production of cotton. It used to be a high potential area for cotton production and yield was considerably high. Total N of soils of Melka Werer Research Centre and Melka Sedi State Farm were however, reported to be low (Kamaraet al, 1990). State farms were used to apply nitrogen fertiliser in the form of urea at the rate of 100 kg/ha split-applied half at planting and half at peak flowering on farms where positive response and economic return were expected. Lately however, based on results of the research centre, it was realised that there was poor response to fertiliser application to cotton in the area that would not warrant economic benefit. As a result, fertiliser application has been terminated. Similar to Middle Awash cotton soils, soil fertility assessment study by Engdawork et al. (2002) revealed that total N of Arba Minch State Farm was very low in all described profile while level of available P was in medium to high range. Level of K was also high in the entire soil described. The low level of N in the soils was attributed to low rate of decomposition of organic matter by microorganisms owing to the prevailing high temperature in the area. Yield levels remained low and were particularly prevalent in some of the farms which often considered as older. Stunted growth, premature senescence, pale/bright green appearance of leaves and ultimately recorded lower yield has been noticed in some of the cotton farms. These observations led to further and continued investigations on fertiliser studies, exhaustion trials (see chapter 7.1.4). Pests Problems Existing cotton pests Because of the nature of agro ecology where cotton is growing, insect pests are among the major yield and quality limiting factors. There are 68 known insects that attack cotton (Geremew and Ermias, 2006). In Ethiopia, the crop is heavily attacked by several types of insects such as boll worms, aphids, thrips, jassid, seed bug, flea beetles and others (Geremew and Ermias, 2006) and mealy bug (Meisso, 2014). Besides the yield reduction, toward the end of the growing season after most of the cotton bolls are open sucking insect pests deteriorate the quality of lint through their sugary secretions termed as ‘honey dew’ which significantly affects the downstream processes such as spinning. Studies indicated that seed- cotton yield losses caused by bollworms, sucking pests in general and cotton aphid alone were 36-60%, 22%, and 14% respectively. Bollworms are the most common pests in all cotton growing regions of Ethiopia. There are four known bollworms that feed on cotton flowers (square) and cotton boll namely, African boll worm, Sudan boll worm, Spiny boll worm) and Pink boll worm. Mealy bug (Phenacoccussolenopsis), a new invasive pest to Ethiopia, has become headache of cotton producers cotton since its arrival in the middle Awash, Afar National Cotton Development Strategy - Ethiopia 35
- 50. Thematic Area A: Production and Productivity 36 36 SOFRECO Region. Currently, mealy bug is reported to be prevalent in all cotton growing regions although it’s not devastating as the middle Awash area. The bulk of chemical insecticides are being heavily used to control cotton pests with high risk to human health and the environment. See Annex (4) for cotton pests, chemicals used for each pest and IP options. Use of Integrated Pest Management (IPM) In cotton growing areas of Ethiopia, conventional reliance on synthetic pesticides has caused serious health and environmental problems, not least in the accumulation of stockpiles of hazardous, obsolete insecticides. The joint national Obsolete Pesticide Project (OPP) by the Ethiopian Federal Government and the United Nations Food and Agriculture Organisation (FAO) collected and repacked 1,500 tonnes of out-dated and poorly stored pesticides in 2003, which were sent to Europe for disposal. Of these, 10% (150 tonnes) came from only 15 stores in the Awash cotton plantations area (Tadesse Amera, 2009). IPM utilises all suitable techniques and methods in as compatible manner as possible and maintains the pest population below the economic injury level. Often, the term includes all elements contributing to an effective, safe, sustainable and economically sound crop protection system. The Ethiopian Institute of Agricultural Research has carried out research since the 1960s into Integrated Pest Management (IPM) of cotton pests. IPM options, particularly those with significant reduction in use of chemical insecticides either were not available or had technical limitations to apply them. Hence, large-scale farms and farmers have made little use of these recommendations. Ethiopia’s draft national IPM Policy therefore identifies cotton as one of the five major crops where IPM should be introduced as a priority. In 2006, the ‘prevention’ component of the OPP (now part of the Africa Stockpiles Programme) supported a 10-month IPM training for small-scale farmers through the Farmer Field School (FFS) methodology, focusing on cotton in the Arba Minch area in the SNNPR and farmers are exploiting IPM (Tadesse Amera, 2009). In 2014, cropping season molasses trap as IPM to control bollworm was introduced to farmers at Metema and Quara districts of North Gondar Zone as part of CmiA sustainable cotton production. Since then, this practice expanded to all cotton growing regions including mechanised large scale producers in the middle Awash, SNNPR, Gambela and Tigray (Berhanu Woldu, 2016). Weed Management and Use of Herbicide Weed Management Weeds and their competition are the major constraints in cotton production in Ethiopia and elsewhere. Weeds reduce the yield of cotton, impair the quality, increase cost of hand and mechanical tillage, fertiliser and herbicides, prevent efficient irrigation water management and harvesting, and serve as hosts and habitats for pests (Kohel and Lewis, 1984). In the middle Awash, yield of cotton was greatly reduced due to the naturally-occurring mixed weed population in which a seed-cotton yield loss of 62.43 - 96.21% occurred when weeding was completely denied throughout the crop growing season (Esayaset al., 2013). A previous similar experiment conducted at the same place indicated a seed-cotton yield loss of 73% when weeding was not practiced throughout the crop growth period (Tadesse and Ahmed, 1985).
- 51. Scoping Study Report As cotton-weed competition is concerned, the critical period of cotton plant is very important to determine the effective time of weed management in which weeding results in higher yield and economic advantage. In this connection, Zimdahl (1980) noted that the time of weed removal is as important as the weed removal itself. The critical period represents the time interval between two separately measured components: the maximum weed-infested period or the length of time that weeds which have emerged with the crop can remain before they begin to interfere with crop growth; and the minimum weed-free period or the length of time a crop must be free of weeds after planting to prevent yield loss. The two threshold points, onset and end of the critical period, were determined to be 20 and 60 DAE, respectively. Weed control practices should be given due attention during this period in order to get better seed-cotton yield (Esayaset al., 2013). A study by Esayaset al. (2007), found that the best and most economical cultural practice to control cotton weeds in Middle Awash is to use: pre-planting irrigation + pre-planting machine cultivation + manual cultivation at 15, 35 and 75 DAE (days after emergence). The report also indicated that providing a basket of options for agricultural producers with different economic status is believed to be a good approach. Accordingly, for small scale cotton farmers that practice dry planting and cannot afford machine cultivation they can use: manual cultivation at 20, 40 and 75 DAE and at 15, 35 and 75 DAE, respectively. Herbicide Use Weeding is purely manual operation on most of the farms. At the time of labour shortage or family members are not available for the purpose, chemical weed control can be utilised as a final resort. Although pre-plant, pre-emergence and post emergence chemicals are available in the market (see table), the use of herbicides in cotton is rare in Ethiopia for various reasons. Irrigated large-scale farms use pre-plant irrigation and “lilistone” (trailed-rotary- chopper) cultivation during planting in which emerging early flush of weeds are reduced as pre plant weeding mechanism. This practice is well established in the middle Awash Area and SNNPR. After slashing they use residual moisture for planting and they come back for irrigation after 14/21 days after emergence. Subsequent three time hand weeding (15 DAE, 30-40 DAE, 65-70 DAE) after emergence is common. Large-scale farms in rainfed areas prepare land when it is dry, otherwise rain interruption will complicate land preparation operation. Few small-scale farmers at Metema and Quara and other areas use roundup/glyphosate as pre- land preparation weed control mechanism in a limited condition. The reasons behind total refusal of herbicide by cotton producers are: There is no effective (effective for grass and broadleaved weeds) post emergence chemical recommendation for cotton. Pre-plant and pre-emergence chemicals do not fit rainfed large scale producers (at least according to producers, and time of land preparation) Research institutes and chemical suppliers in the country are not enthusiastic on handling verification trials on cotton herbicides as equally as they do for cereals or cotton insect pests. National Cotton Development Strategy - Ethiopia 37
- 52. Thematic Area A: Production and Productivity 38 38 SOFRECO Table: Available or Recommended herbicides for cotton Registered herbicides Time of Application Status Roundup / Glyphosate Pre-planting/pre-land preparation Broad-spectrum Under Commercial use by small-scale farmers Stomp Pre-planting/pre-land preparation Recommended for cotton, under commercial trial by large scale producers in Benishangul area Codal gold Pre-emergence broad spectrum (effective) Recommended for cotton, not commercialised yet Fusilade forte Post-emergence (grass weed) Recommended for cotton, (less effective) and not commercialised yet Source: MoANR, Animal and Plant Health Regulatory Directorate 2.3.2 Cultivation Practices (Large Scale Commercial Farmers/Smallholders) The cultivation practice including planting periods of commercial 12 farmers and smallholders varies in different cotton-producing regions depending mainly on climatic condition and producer-capacity. The cultivation practices are quite different according the type of farms, i.e., large mechanised farms and smallholder farms. Pest control, a major issue with cotton, is quite similar with both types of farms. The table in Appendix 4 shows the main types of pests in Ethiopia and the various ways of fighting them, by using chemicals or IPM solutions. During the last years, the use of molasses traps has been successfully introduced with smallholders, mainly through the CmiA project, to fight against bollworms. It has later been tried with some large-scale farms and has shown good results; it is likely to expand in the coming years. Large and medium-scale farmers In irrigated areas such as the Awash Valley in the Afar Region and the Omo Valley in the SNNPR, land preparation starts in January by clearing the stalks of previous crop while ploughing begins in March and April. Large-scale and medium-scale farms use the disk plough to make a good tilt. Land-levelling and ridging are important operations that allow irrigation-water movement. In the irrigated Middle Awash and Gamo Gofa Zone, around Arba Minch in the SNNPR, cotton-planting commences in mid-April to mid-May while planting for irrigated production in the South Omo Valley in the SNNPR is conducted in May to August. Row-planting in irrigated areas is a common practice using a row- planter. The row space is normally 90 cm with a plant-spacing of 20 cm. Most of the large-scale and medium- scale farmers use a delinted seed rate of 15-20 kg/ha. Replanting and thinning operations follow to maintain the desired population of 55 000-70 000 plants/ha. Open-channel irrigation using either the siphon or the furrow is the most common practice. In the Afar Region and South Omo area, farmers use pre-plant irrigationas early weed management. Starting from 20 days after plant-emergence to 12 Large-scale and medium-scale.
- 53. Scoping Study Report harvesting, most of the farmers weed at least three times 13 excluding mechanical cultivation 14 in order to facilitate irrigation-water movement. Some of the large farms, such as the Amibara Enterprise, use areal spray but most of the farmers use tractor-mounted or motorised-sprayers to control insect pest. In the rain-fed areas of Metema, Humera, Gambela and Benishangul-Gumuz, planting is conducted in June-July following the onset of rainfall after clearing and land preparation. Most of the rain-fed medium-scale cotton-farmers use the broadcasting type of planting as it is not complicated. Such broadcasting however has the following drawbacks (i) high competition and high seed consumption and (ii) difficulty in (a) weed management (b) optimum-plant maintenance (c) cultivation (d) thinning (e) gap-filling (f) replanting (g) spraying (h) pest scouting and (i) harvesting. These drawbacks have long been recognised by the GoE extension service. Smallholders The cultivation practice of smallholders in Amhara, Tigray and the SNNPR includes use of the oxen-plough for land preparation. The smallholders use broadcasting and fuzzy seed of 35-40 kg/ha. Delinted-seed-use by farmers has recently increased although empirical data on this is still unavailable. Weed management and insect-pest control is the same as that for large-scale farmers. Afar smallholders are recent converts to farming and to its mechanisation. Irrigated cotton production in the Afar Region and South Omo area follows mono- cropping whereas the cropping system in the rain-fed areas of Western Ethiopia is mixed i.e. sesame, sorghum and maize are planted alternately as rotation by large- scale farmers, medium-scale farmers and smallholders. Farmers in the Arba Minch area in the SNNPR also plant cotton with cassava, banana and maize as a pattern or in rotation. Some of the farmers in North Gondar in the Amhara Region recently adopted the CmiA 15 sustainable production system while farmers in the Arba Minch area are also trying to start organic 16 cotton production. 2.3.3 Harvest/Post-Harvest Practices (Including Contamination Management) Manual cotton picking is the common harvesting practice in Ethiopia. Large-scale farmers on irrigated fields pick twice with the first picking done after 70% of the bolls are open while the remaining cotton is harvested three weeks after the first harvest. Unlike the irrigated area, large-scale and small-scale rain-fed farmers often harvest their cotton once when all of the bolls are open. All the handling of seed-cotton is done manually and by using bags of various sizes. No system of bulk handling and compaction of seed-cotton have been experimented. The main competitive advantage of African cotton comes from manual harvesting. Seed-cotton picked by hand is cleaner, and the lint obtained has fewer neps and a lower short lint content than machine-picked cotton, which must be cleaned more 13 20 Days after Emergence (DAE), 40 DAE and 65 DAE. 14 Furrow opening. 15 Cotton made-in Africa. 16 Not certified yet. National Cotton Development Strategy - Ethiopia 39
- 54. Thematic Area A: Production and Productivity 40 40 SOFRECO vigorously at the ginnery, since it has a higher content of vegetable matter. Over time, the theoretical advantage conferred by manual picking has been lost because of the presence of foreign matter in the lint. As contamination of seed-cotton by foreign matters is the main concern for quality yarn and fabric producers, spinners tend to give preference for machine-picked cottons over handpicked cottons. Also hand picking is time consuming and laborious compared to very efficient and few work force requirement of machine harvest. The share of mechanically harvested cotton now exceeds 55% of the world export market. Although Ethiopia has abundant human power for any labour intensive jobs like cotton farming, high cost of labour for harvest would make cotton unattractive business. Moreover, transportation cost of labour from SNNPR, security issue, and strong competition from sugarcane and coffee plantation would urge for considering mechanical harvesting. Adoption of machine harvest is uneasy job as current production system by large scale and small scale producers all over the country needs adjustment that comes with significant cost and changes in agronomic practices. For machine harvest, it requires suitable varieties (compact type), seed rate for mechanical harvesting of cotton should be increased to attain higher plant density compared to conventional manual picking. As the height of the plants need to be uniform and much lower than in the conventional way, the plant population needs to be much higher in order to achieve sufficient yields. In the conventional way, the cotton plant will have much more branches and more number of bolls per plant than in the cotton field cultivated for mechanical harvesting. The inter-row and inter-plant spacing for mechanical harvesting is also much less to accommodate more number of plants. The cotton plants that are going to be mechanically harvested also need to be sprayed with defoliant chemicals in order to make proper planting method, use of harvest aids like growth regulator, defoliants and boll openers to enable the harvesting process clean and efficient. In the gin, high impact pre-cleaner is required before ginning to overcome high trash compared to handpicked cotton. Since the cotton passes through the machines, the fibre quality would be impacted, increase short fibre content and neps. This can be minimised with roller ginning with additional high impact pre-cleaner installation. Roller ginning produces lint that is longer, has fewer short lint, seed coat fragments, and neps. Adoption of mechanical harvest is not an overnight process and the major drivers of long lasting processes are cost of labour, agronomy and Government policy. These 3 factors played a role in different cotton growing countries around the world. In the USA, it took 30 years to achieve 100% mechanisation, Brazil took 45 years to achieve 100% mechanisation, Turkey reached 75% of mechanisation in 15 years and China took 20 years to reach 15% mechanisation. Over all, mechanical harvest is an invention of 1940s and it took several decades to become attractive everywhere. Hence, before introduction of the technology for wide use, feasibility study and clustering of producers is very important as along with suitable agronomic practice, volume of production might be determining for profitability of machine picking. However, private companies with profound capacity could take advantage of the technology. One issue related to the mechanical harvesting of cotton that should also be considered is its cost. It would require high investments and use significant amounts of foreign currency. At the moment, the price of a “state of the art” cotton picker amounts to about USD 600,000, without including the other equipment needed to purchase (cotton modules system, etc.).
- 55. Scoping Study Report 17 The use of herbicide has been developed in Western and Central Africa since the early 80s. May2014 June July Aug Sept Oct Nov Dec2014 Jan2015 Feb March April May June July Aug Sept Oct Nov Dec2015 2.3.4 Trends in Cultivation/Post-Harvest Practice The long-term cultivation practice trend is essentially one of “no change” which explains partly why there has been little or no sustained increase in technical productivity or production. Apparently, very few cotton growers use herbicides in Ethiopia, although (i) weeding is a serious issue, requiring a lot of hand labour and it is difficult to get in some places and very expensive (100 ETB/man-day), (ii) herbicide are widely used on cotton crops for several decades everywhere in the world, including Africa. 17 In order to fight the contamination problems, some farmers have started (in SNNPR for instance) to use jute bags instead of the traditional polypropylene ones. This trend has to be encouraged, as contamination is a serious issue in some areas. 2.4 Production Cost and Margins 2.4.1 Price of Seed-cotton per kg Paid at Ginnery/Farm-Gate (Based on Quality/Grade) Unlike with the lint price, there is no market price system for seed-cotton. Although there are no clear data on this issue, most of the cotton produced in Ethiopia is actually sold as lint and seed, after commission ginning. ETIDI is supposed to do weekly surveys of the price of seed-cotton in the 6 cotton- producing regions of Ethiopia (total of 19 contacts, including ginneries and producers), as done for the lint. Unfortunately, those data were not supplied to the Consultant. From the interviews with cotton producers and buyers, it appears that there has been a steady decline in the price of seed-cotton during the last two years, from approx. 14 ETB/kg to approx. 10 ETB/kg at the moment. This trend is clearly linked to the decrease in the world price of cotton lint, as explained in paragraph 5.1. It should be noted that the recent evolution of the world prices of crops in competition with cotton at farm level have also shown a similar or even worse (sesame) decline, as shown in the graph below: 120 Relative evolution of the monthly worlds prices from May 2014 to December 2015 (source: World bank) 100 80 60 Sesame Cotton 40 Maize 20 Sorghum 0 National Cotton Development Strategy - Ethiopia 41
- 56. Thematic Area A: Production and Productivity 42 42 SOFRECO In terms of proportion of the value chain received by the seed-cotton producers, if we consider 10 ETB/kg for SC, 38% of ginning out turn and 32 ETB/kg for lint, the proportion is (1 x 10) / (0.38 x 32) = 10/12.16; representing 82.2% (for lint). This rate is quite good compared to similar rates in the world. In francophone African countries, for instance, it is usually around 70%. This can be explained by the fact that cotton can be sold in Ethiopia to the local textile industry that is prepared to pay the lint at a price equal to the world price + the cost of importing lint from abroad, while the West and Central African lint exporters can sell their lint at the world price – the cost of exporting lint to the foreign markets. If we consider the same proportion of the lint price paid to the producers (82.2%), the SC price could be higher with a better ginning outturn (GOT). For instance, with a GOT = 40%, the SC price would be (32 x 82.2%) x 40% = 10.52 ETB/kg instead of 10 ETB/kg. The use of varieties with better GOT and the improvement of ginning quality should therefore be a priority of the cotton sector. However, the usually low GOTs are somehow misleading as the percentage of trash is most of the time very high in the SC. With a standard trash rate, the “real” GOT would be higher, as shown in the example below, where it has been considered a 3% trash ratio in the seed-cotton instead of 7% often measured (with a similar proportion lint/seed): Seed-cotton components Average current situation Improved seed-cotton quality Lint ratio 38% 39.6% Seed ratio 55% 57.4% Total 93% 97% Photograph of a polypropylene bag with a high proportion of trash: (Awash farms, December 2015): Presently, because of the high rate of trash in the seed-cotton, it can be considered that trash is paid to the cotton producers at the price of cotton! This is encouraged by the fact there is no incentive for quality seed-cotton, with no differential prices between good quality low-trash content seed-cotton and poor quality high-trash content seed-cotton. In most of African countries, the seed-cotton price system involves different prices according to the quality. Below is an example of “box” showing two qualities of
- 57. Scoping Study Report seed-cotton (grades A & B, used in Ghana), with a difference of price of at least 10% between the two types 18 : The perspectives for the cropping season 2016-2017 do not look very promising for the cotton prices, as for most of the agricultural commodities. In Francophone countries, the prices have already been set, at an equivalent of 9 to 9.5 ETB/kg of seed-cotton for the highest grade. Profitability of the Seed-Cotton Business Model The business model based on the purchase of seed-cotton is mostly used with smallholders, from whom private traders buy their production, gin it and then sell lint and seed. Below is an estimation of the profit of such a business model, using the current prices: Assumptions made: Purchase price of seed-cotton: 10 ETB/kg; Sales prices: 32 ETB/kg for lint & 6 ETB/kg for seed; Ginning outturn: 38% lint and 55% seed (7% trash); Ratio Lint/Seed: 38% SC/55% SC 69%; Costs of transport and handling: 1 ETB/kg; Cost of commission ginning: 1.50 ETB/kg of SC (incl. handling). Estimation of profit for one kg of lint: Estimation of income and costs ETB/kg of lint Income Lint: 1 kg x 32 ETB/kg = 32.00 Seed: 1/0.69 1.45 kg of seed x 6 ETB/kg = 8.70 Total = 40.70 Costs Purchase of seed-cotton: 1 kg lint/38% = 2.63 kg SC x 10 ETB/kg = 26.30 Ginning (and handling at ginnery): 2.63 kg of SC x 1.5 ETB/kg = 3.95 Transport and handling of SC: 2.63 kg x 1 ETB/kg = 2.63 Transport and handling of Lint: 1.0 kg x 1 ETB/kg = 1.00 Transport and handling of Seed: 1.45 kg x 1 ETB/kg = 1.45 Total = 35.33 Profit per kg of lint = 40.70 – 35.33 = 5.37 Profit per kg of seed-cotton = 5.37 x 38% 2.04 18 The West African “grade B” seed-cotton is better that most of the seed-cotton seen during the mission. National Cotton Development Strategy - Ethiopia 43
- 58. Thematic Area A: Production and Productivity 44 44 SOFRECO It should be noted that this “gross-profit” does not take into account the financial costs and other miscellaneous costs (cost of trade license, taxes, etc.). Direct Cost per kg to Produce Seed-Cotton Ex-Farm (Inputs, Hired Labour) and Gross Margins From the numerous interviews with cotton farmers in all the regions, a lot of data has been gathered, that can enable the calculation of the cost of production of seed-cotton at farm level. However, the analysis of all the data collected shows it is a difficult task as some of the information are contradictory and obviously sometimes unreliable. In Appendix 5, estimations have been made for large scale irrigated farms and smallholder farms, based on the data collected during the interviews with the farmers and farm managers. Large Scale Farms Costs of Production: Irrigated Cotton Large-scale farms show significant variations between the unit costs, and also the quantity of inputs used. This results in very different costs of production per kg of seed-cotton. In the tables presented in Appendix 6, two situations have been considered: a “low cost” farm and “high cost” one. The main differences (rounded figures) in costs are: (i) the cost of labour, from below 50 ETB/man-day (Gambela) up to 100-150 ETB/man-day (Amhara), (ii) the cost of harvesting (linked to the cost of labour), from 1.5 to 2.5 ETB/kg of SC, (iii) the cost of insecticides, from 1,000 to 3,500 ETB/ha, (iv) the cost of irrigation, from 100 to 1 000 ETB/ha, (iv) the cost of fertiliser, from 0 (no fertiliser used) up to 150 kg/ha and (vi) the cost of diesel, from 25 to 50 litres/ha. From those different figures, two estimations of the costs of production have been made, with the same yield of 30 qt of SC/ha; the graph below shows the breakdown of costs: Comments: The total costs of production are very different between the two options, from 3.76 to 8.9 ETB/kg of seed-cotton. This result is however misleading, because
- 59. Scoping Study Report CostinBirr/kgofseedcotton each option uses the lowest cost for each component of the total costs. In fact some of factors are high and some are low. The average direct cost of production is probably about 6 ETB/kg. In regions where the cost of labour is very high (> 100 ETB/man-day), the use of herbicide is an absolute necessity, and should lead to a decrease of at least 50% of the weeding costs. The total costs of production, including fixed costs, are very difficult to estimate, because they depend of every specific farm situation. The gross margin depends of course a lot of the selling price of seed-cotton; with the current price of 10 ETB/kg, some of the farms will definitely make a loss with cotton, especially when taking into consideration the fixed costs of the farms. Large Scale Farms Costs of Production: Rain-Fed Cotton Estimations have also been made for large farms rain-fed cotton; two options have also been considered, high and low unit costs of production. An average yield of 15 qt of seed-cotton/ha has been considered. The graph below shows the breakdown of costs: Breakdown of direct cotton costs of production for large rainfed farms: low and high costs 12.00 10.00 8.00 6.00 4.00 Other direct costs Labour Inputs 2.00 0.00 Low cost High cost Similar comments as for the irrigated farms can be made for the rain-fed ones. Because of the lower yields, the cost of production of the rain-fed cotton is higher than the irrigated one. The high costs farms are probably at the moment making a loss with the present price of cotton. Smallholders farms costs of production Detailed figures were gathered in Amhara region, currently main smallholder area for cotton production. The estimation of the costs of production are summarised in the table in Appendix 5. The yield has been estimated at 15 qt of SC/ha. A shown in the graph below, the total cost of production is estimated at 9.2 ETB/kg of SC, which is currently just below the selling price. National Cotton Development Strategy - Ethiopia 45