Basic X-ray PowderDiffraction (XRPD)
• Solid-State, Material Science
– Crystalline (Scattering : diffraction)
– Non-crystalline (Scattering)
• Analytical Tool
• Qualitative and Quantitative Analysis
– Quantitative Phase Analysis: determine the relative amounts of phases in a mixture by referencing
the relative peak intensities
• Unit cell lattice parameters and Bravais lattice symmetry
– Index peak positions
– Lattice parameters can vary as a function of, and therefore give you information about, alloying,
doping, solid solutions, strains, etc.
• Residual Strain (macrostrain)
• Crystal Structure
– By Rietveld refinement of the entire diffraction pattern
• Epitaxy/Texture/Orientation
• Crystallite Size and Microstrain
– Indicated by peak broadening
– Other defects (stacking faults, etc.) can be measured by analysis of peak shapes and peak width
• in-situ Experiments
– evaluate all properties above as a function of time, temperature, and gas environment
2.
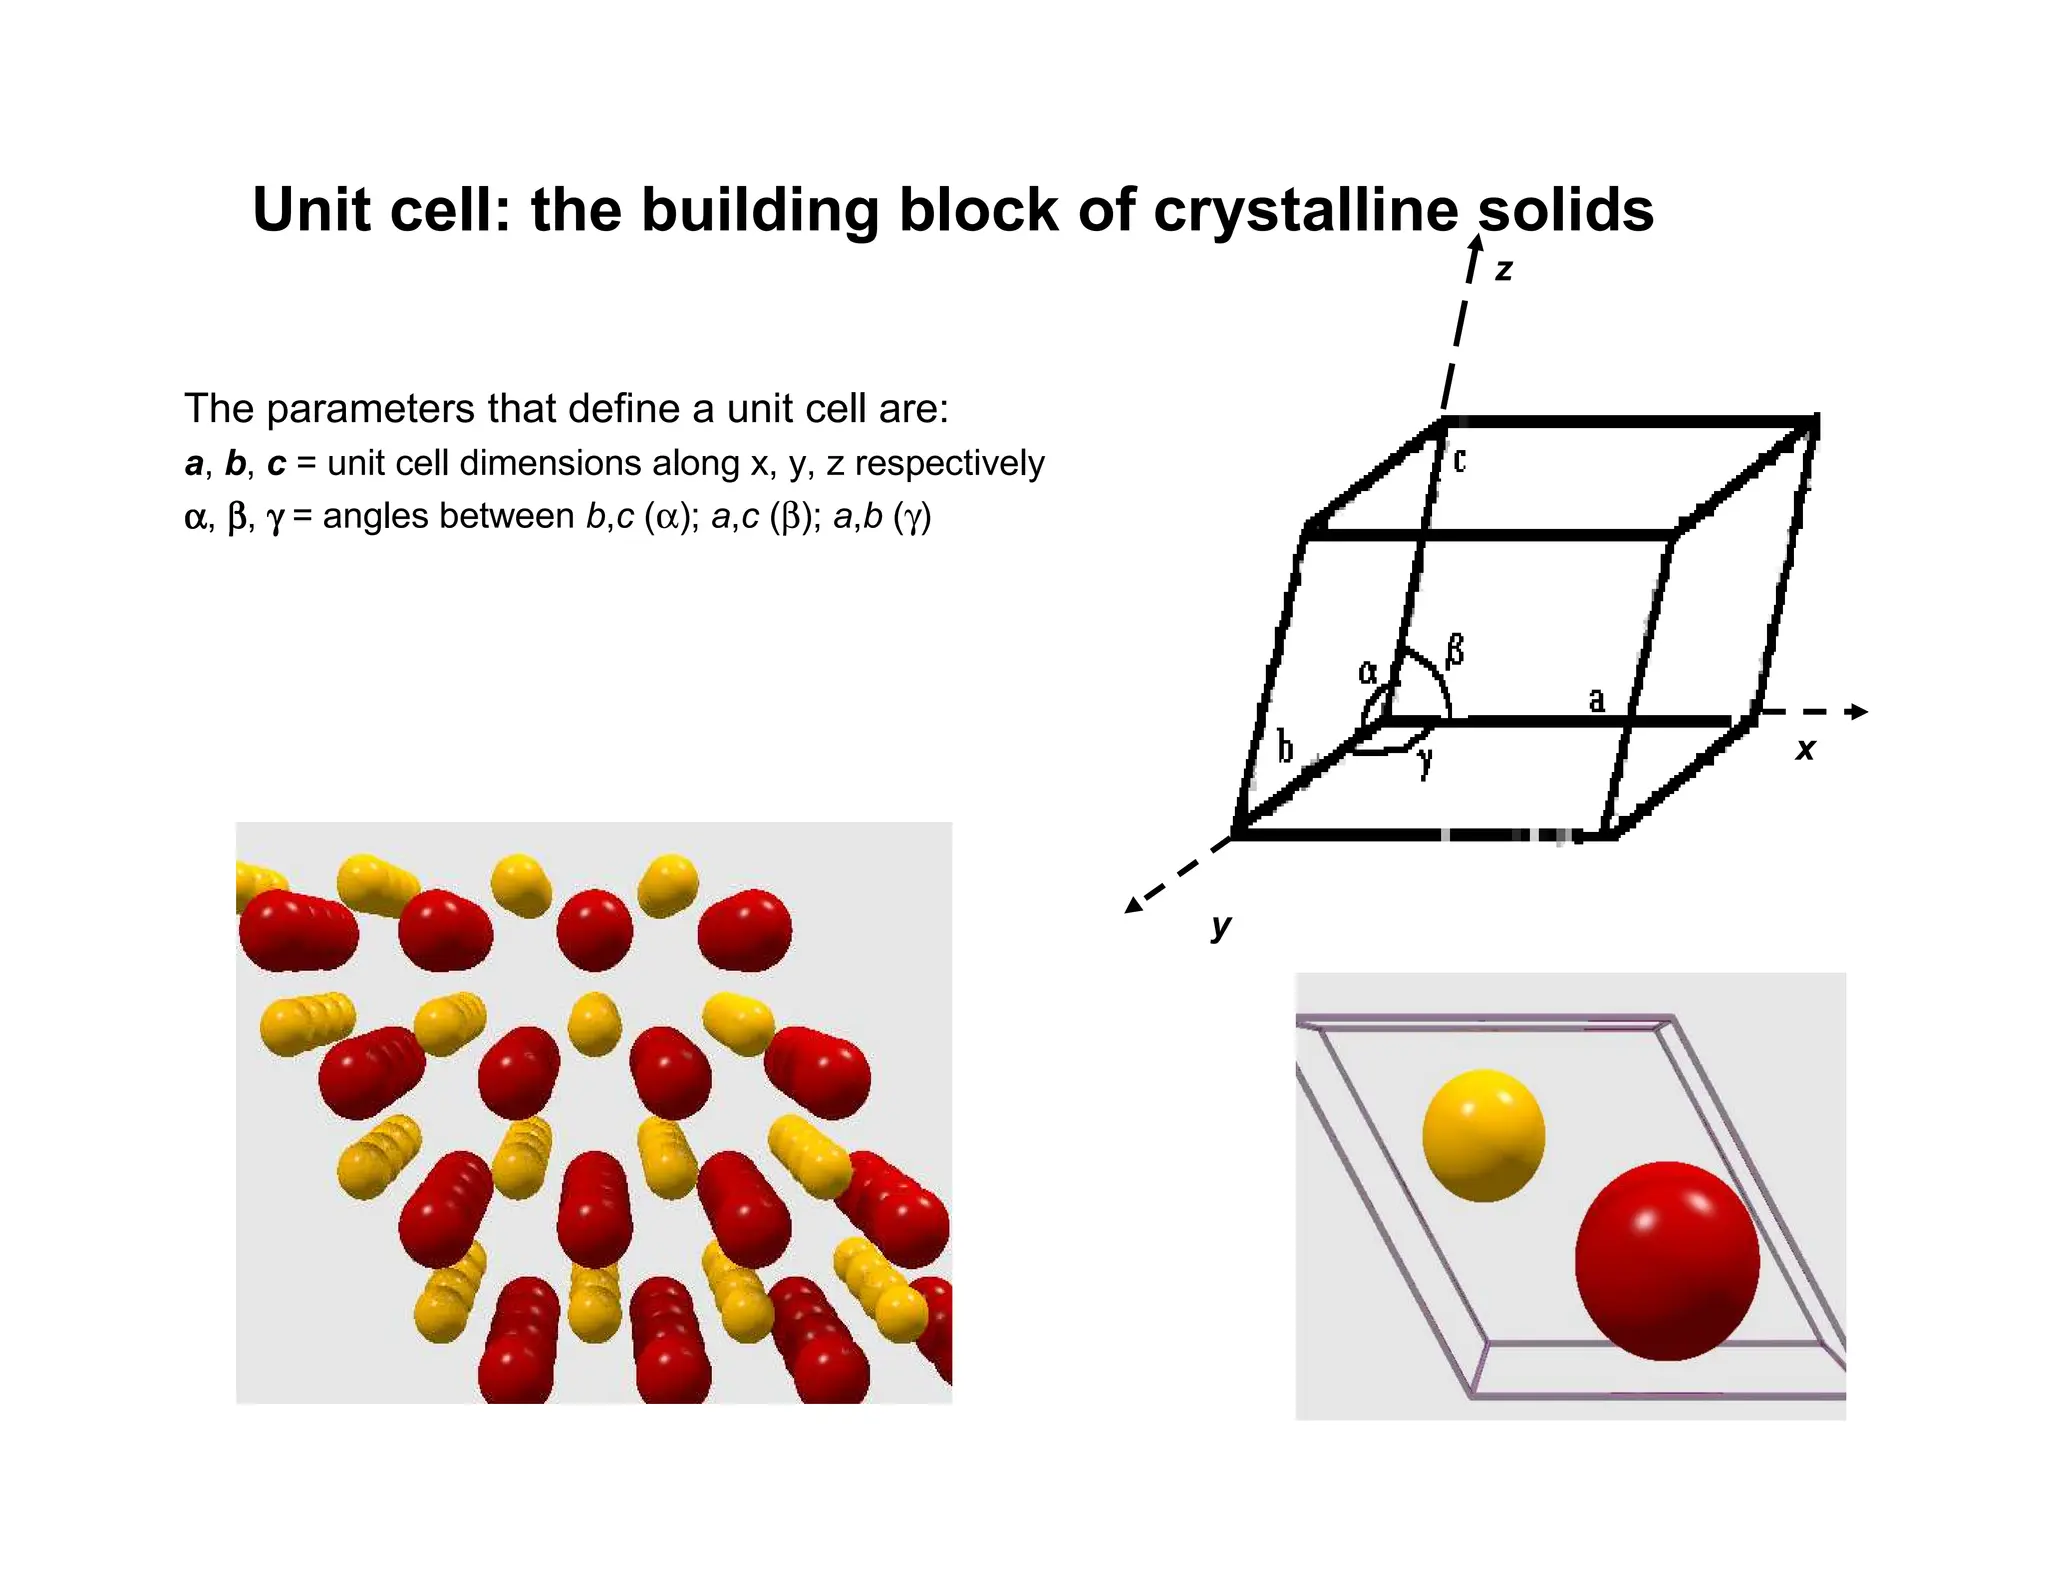
The parameters thatdefine a unit cell are:
a, b, c = unit cell dimensions along x, y, z respectively
α
α
α
α, β
β
β
β, γ
γ
γ
γ = angles between b,c (α); a,c (β); a,b (γ)
z
y
x
Unit cell: the building block of crystalline solids
3.
°
=
=
=
=
= 90
γ
β
α
;
c
b
a
Shapes ofunit cells
All the possible shapes of a unit cell are defined by 7 crystal systems,
which are based on the relationship among a,b,c and α, β, γ,
Cubic system
°
=
=
=
≠
= 90
γ
β
α
;
c
b
a Tetragonal system
°
=
=
=
≠
≠ 90
γ
β
α
;
c
b
a Orthorhombic system
°
≠
≠
≠
≠
≠ 90
γ
β
α
;
c
b
a Triclinic system
°
=
°
=
=
≠
= 120
90 γ
β
α ;
;
c
b
a Hexagonal system
°
≠
=
=
=
= 90
γ
β
α
;
c
b
a Rhombohedral system
β
γ
α ≠
°
=
=
≠
≠ 90
;
c
b
a Monoclinic system
4.
Crystalline materials arecharacterized by the
orderly periodic arrangements of atoms.
• The unit cell is the basic repeating unit that defines a crystal.
• Parallel planes of atoms intersecting the unit cell are used to define
directions and distances in the crystal.
– These crystallographic planes are identified by Miller indices (hkl).
The (200) planes
of atoms in NaCl
The (220) planes
of atoms in NaCl
5.
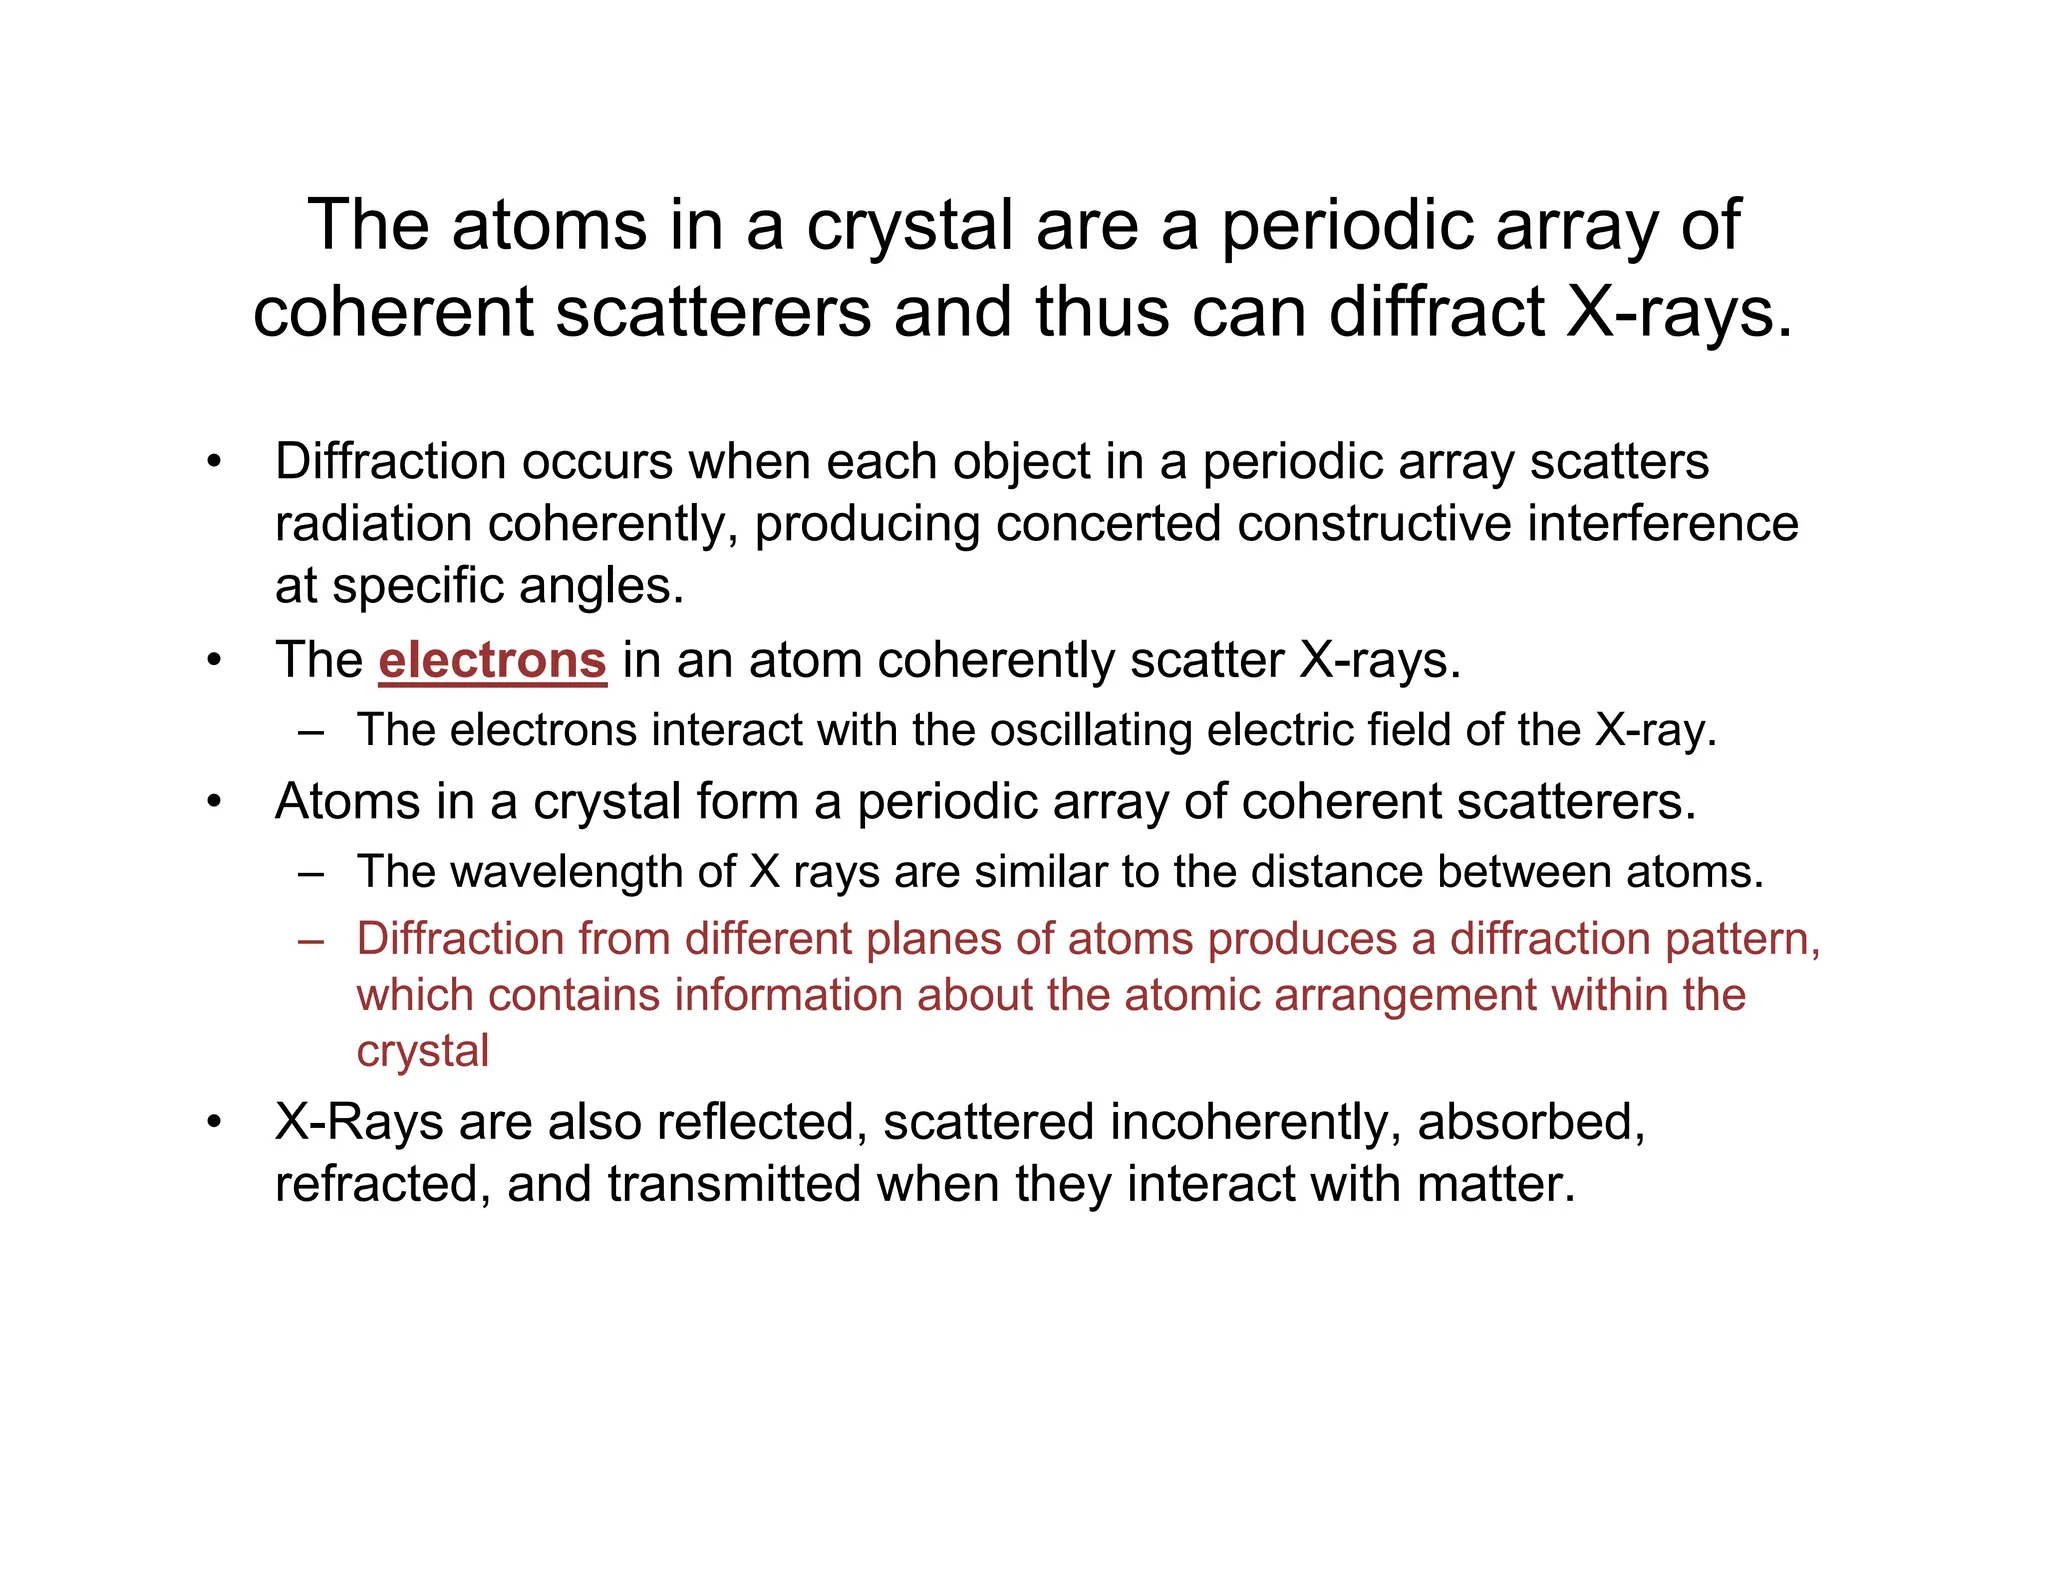
The atoms ina crystal are a periodic array of
coherent scatterers and thus can diffract X-rays.
• Diffraction occurs when each object in a periodic array scatters
radiation coherently, producing concerted constructive interference
at specific angles.
• The electrons in an atom coherently scatter X-rays.
– The electrons interact with the oscillating electric field of the X-ray.
• Atoms in a crystal form a periodic array of coherent scatterers.
– The wavelength of X rays are similar to the distance between atoms.
– Diffraction from different planes of atoms produces a diffraction pattern,
which contains information about the atomic arrangement within the
crystal
• X-Rays are also reflected, scattered incoherently, absorbed,
refracted, and transmitted when they interact with matter.
6.
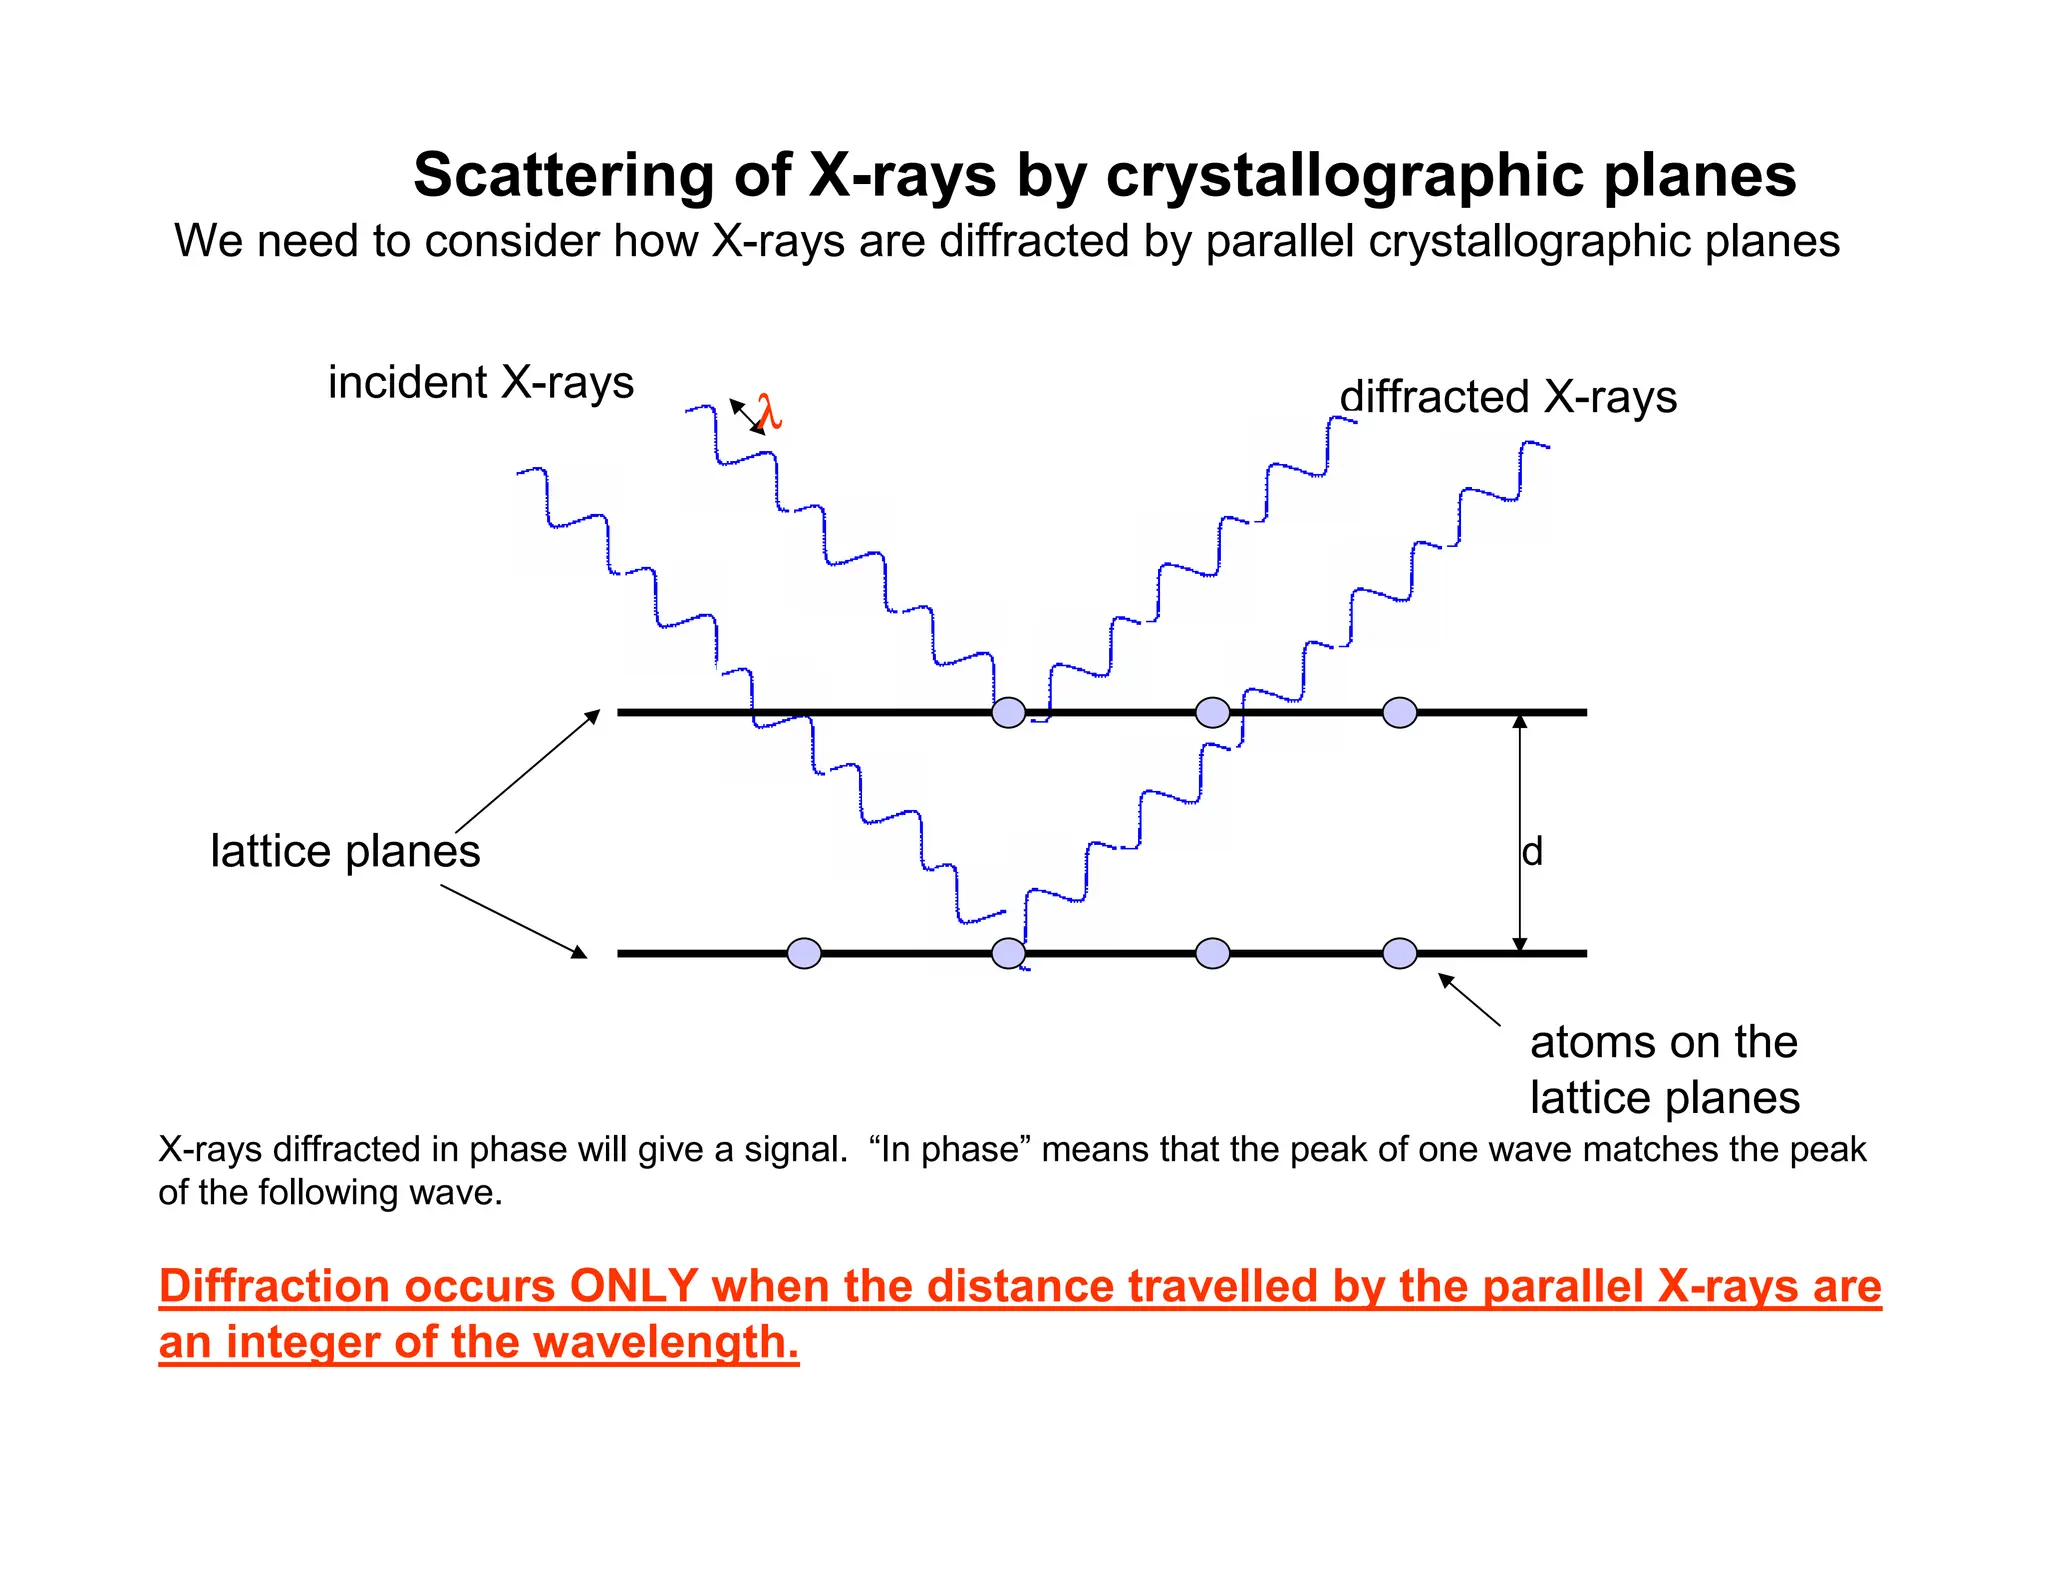
Scattering of X-raysby crystallographic planes
We need to consider how X-rays are diffracted by parallel crystallographic planes
diffracted X-rays
lattice planes
atoms on the
lattice planes
d
λ
λ
λ
λ
incident X-rays
X-rays diffracted in phase will give a signal. “In phase” means that the peak of one wave matches the peak
of the following wave.
Diffraction occurs ONLY when the distance travelled by the parallel X-rays are
an integer of the wavelength.
7.
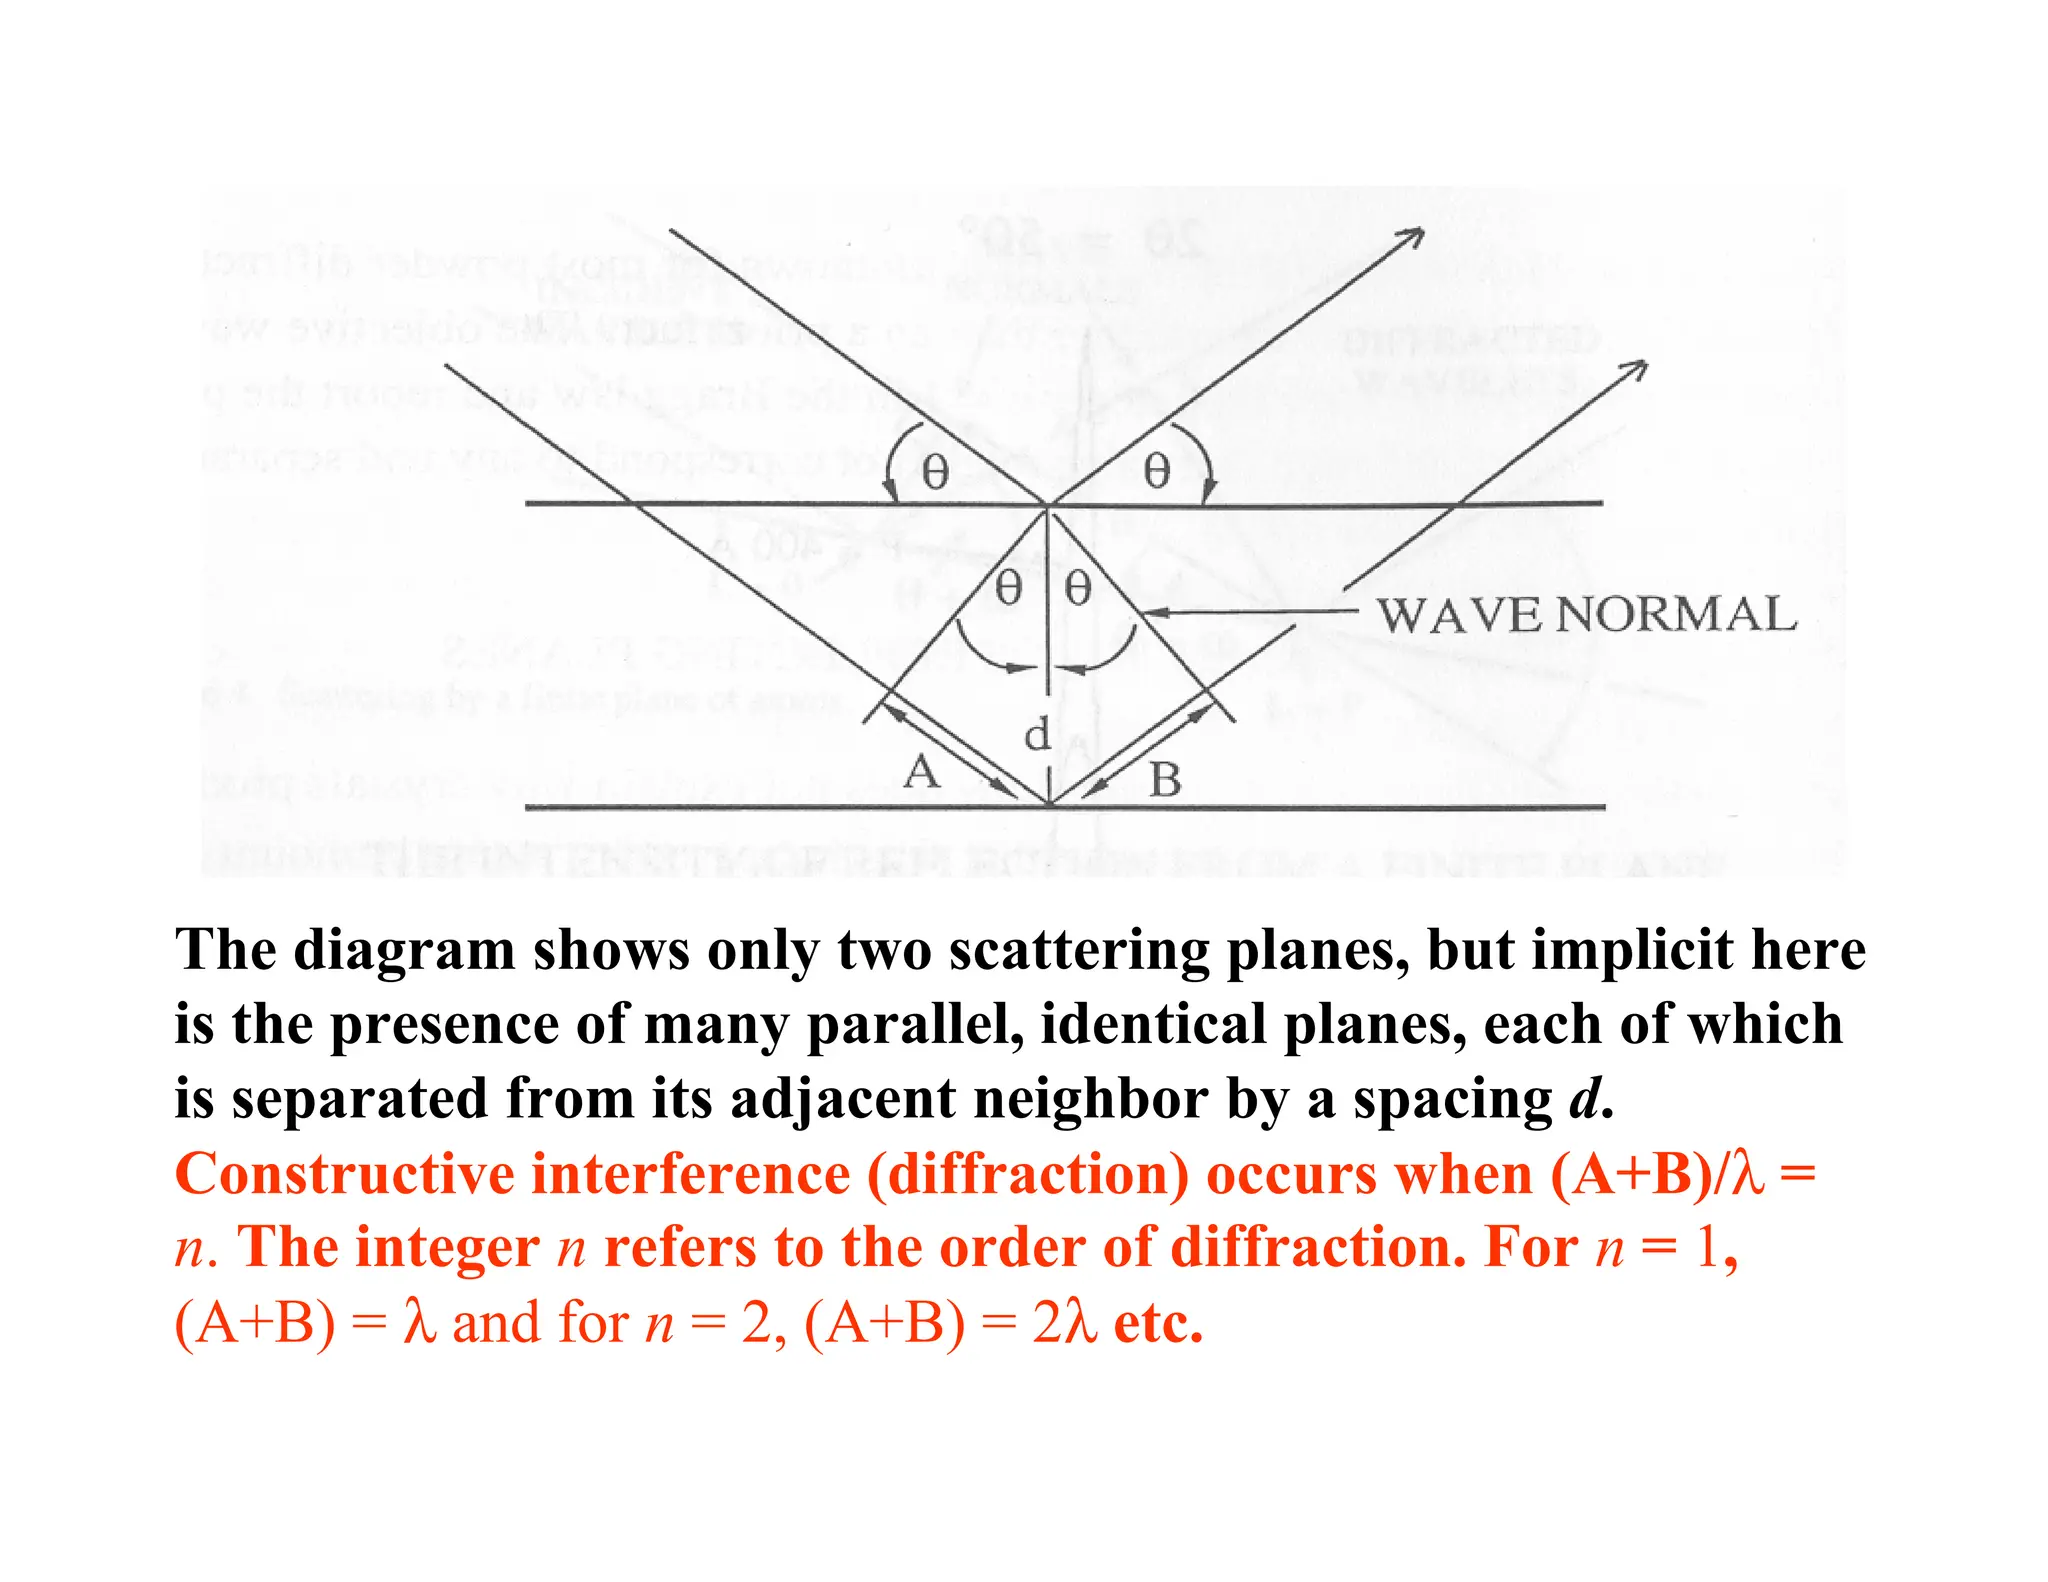
The diagram showsonly two scattering planes, but implicit here
is the presence of many parallel, identical planes, each of which
is separated from its adjacent neighbor by a spacing d.
Constructive interference (diffraction) occurs when (A+B)/λ =
n. The integer n refers to the order of diffraction. For n = 1,
(A+B) = λ and for n = 2, (A+B) = 2λ etc.
8.
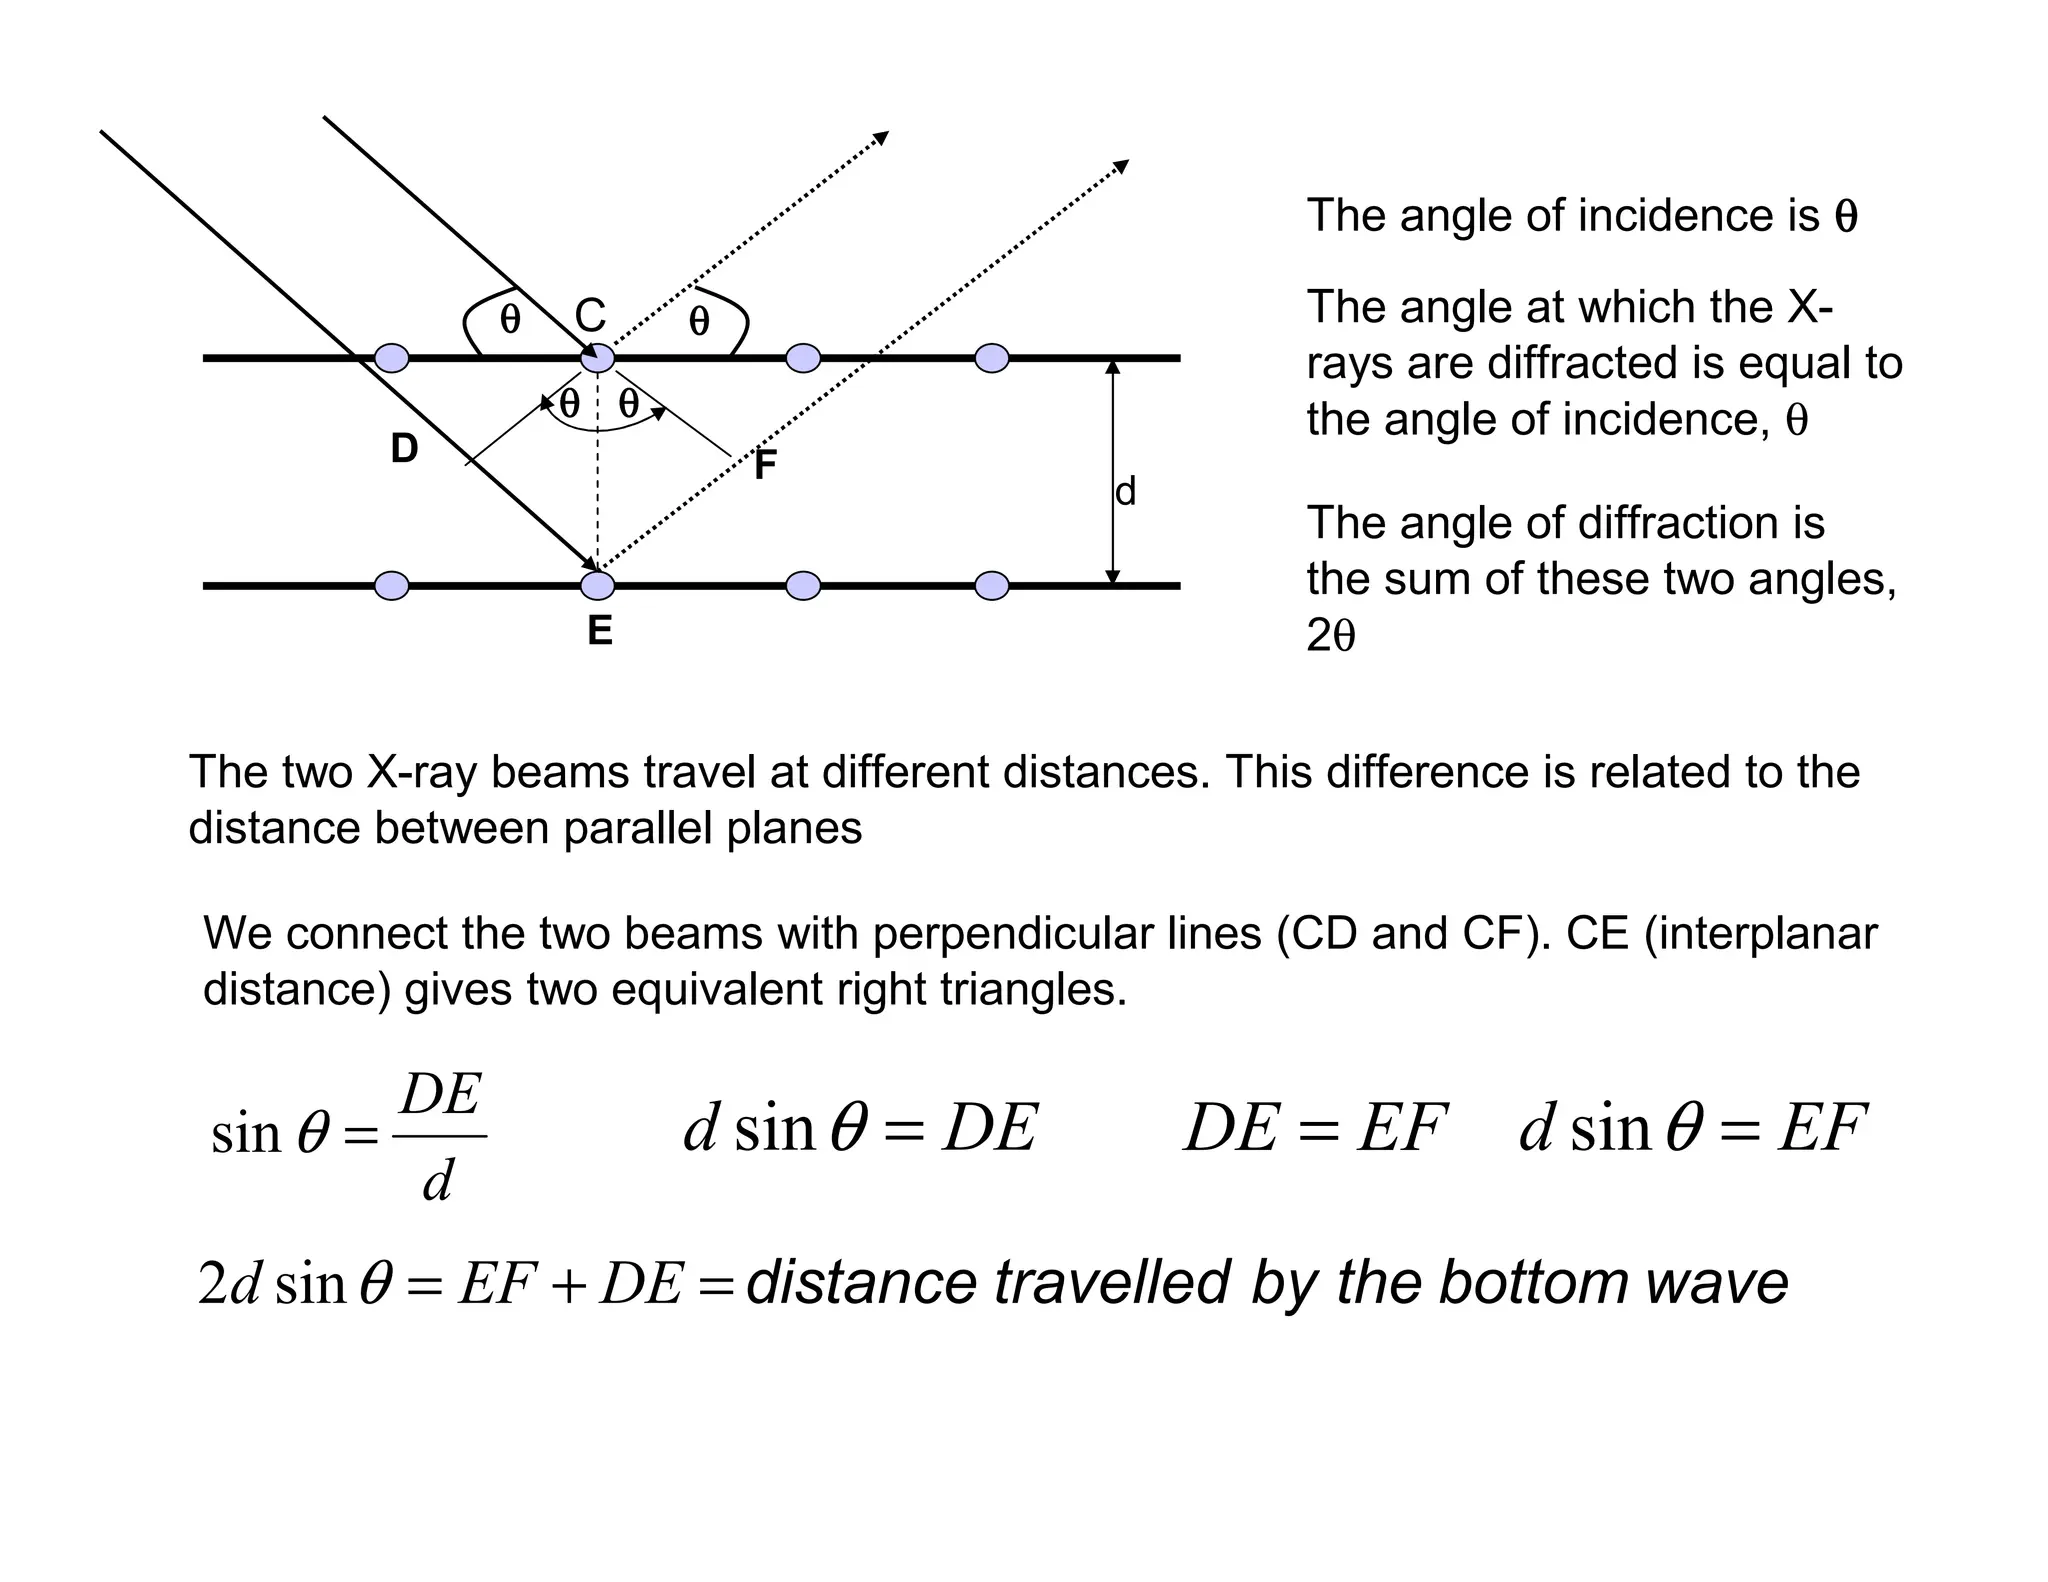
d
θ
θ
θ
θ θ
θ
θ
θ
θ
θ
θ
θ
D
E
F
C
The twoX-ray beams travel at different distances. This difference is related to the
distance between parallel planes
θ
θ
θ
θ
We connect the two beams with perpendicular lines (CD and CF). CE (interplanar
distance) gives two equivalent right triangles.
d
DE
=
θ
sin DE
d =
θ
sin EF
DE = EF
d =
θ
sin
wave
bottom
the
by
travelled
distance
DE
EF
d =
+
=
θ
sin
2
The angle of incidence is θ
θ
θ
θ
The angle of diffraction is
the sum of these two angles,
2θ
The angle at which the X-
rays are diffracted is equal to
the angle of incidence, θ
9.
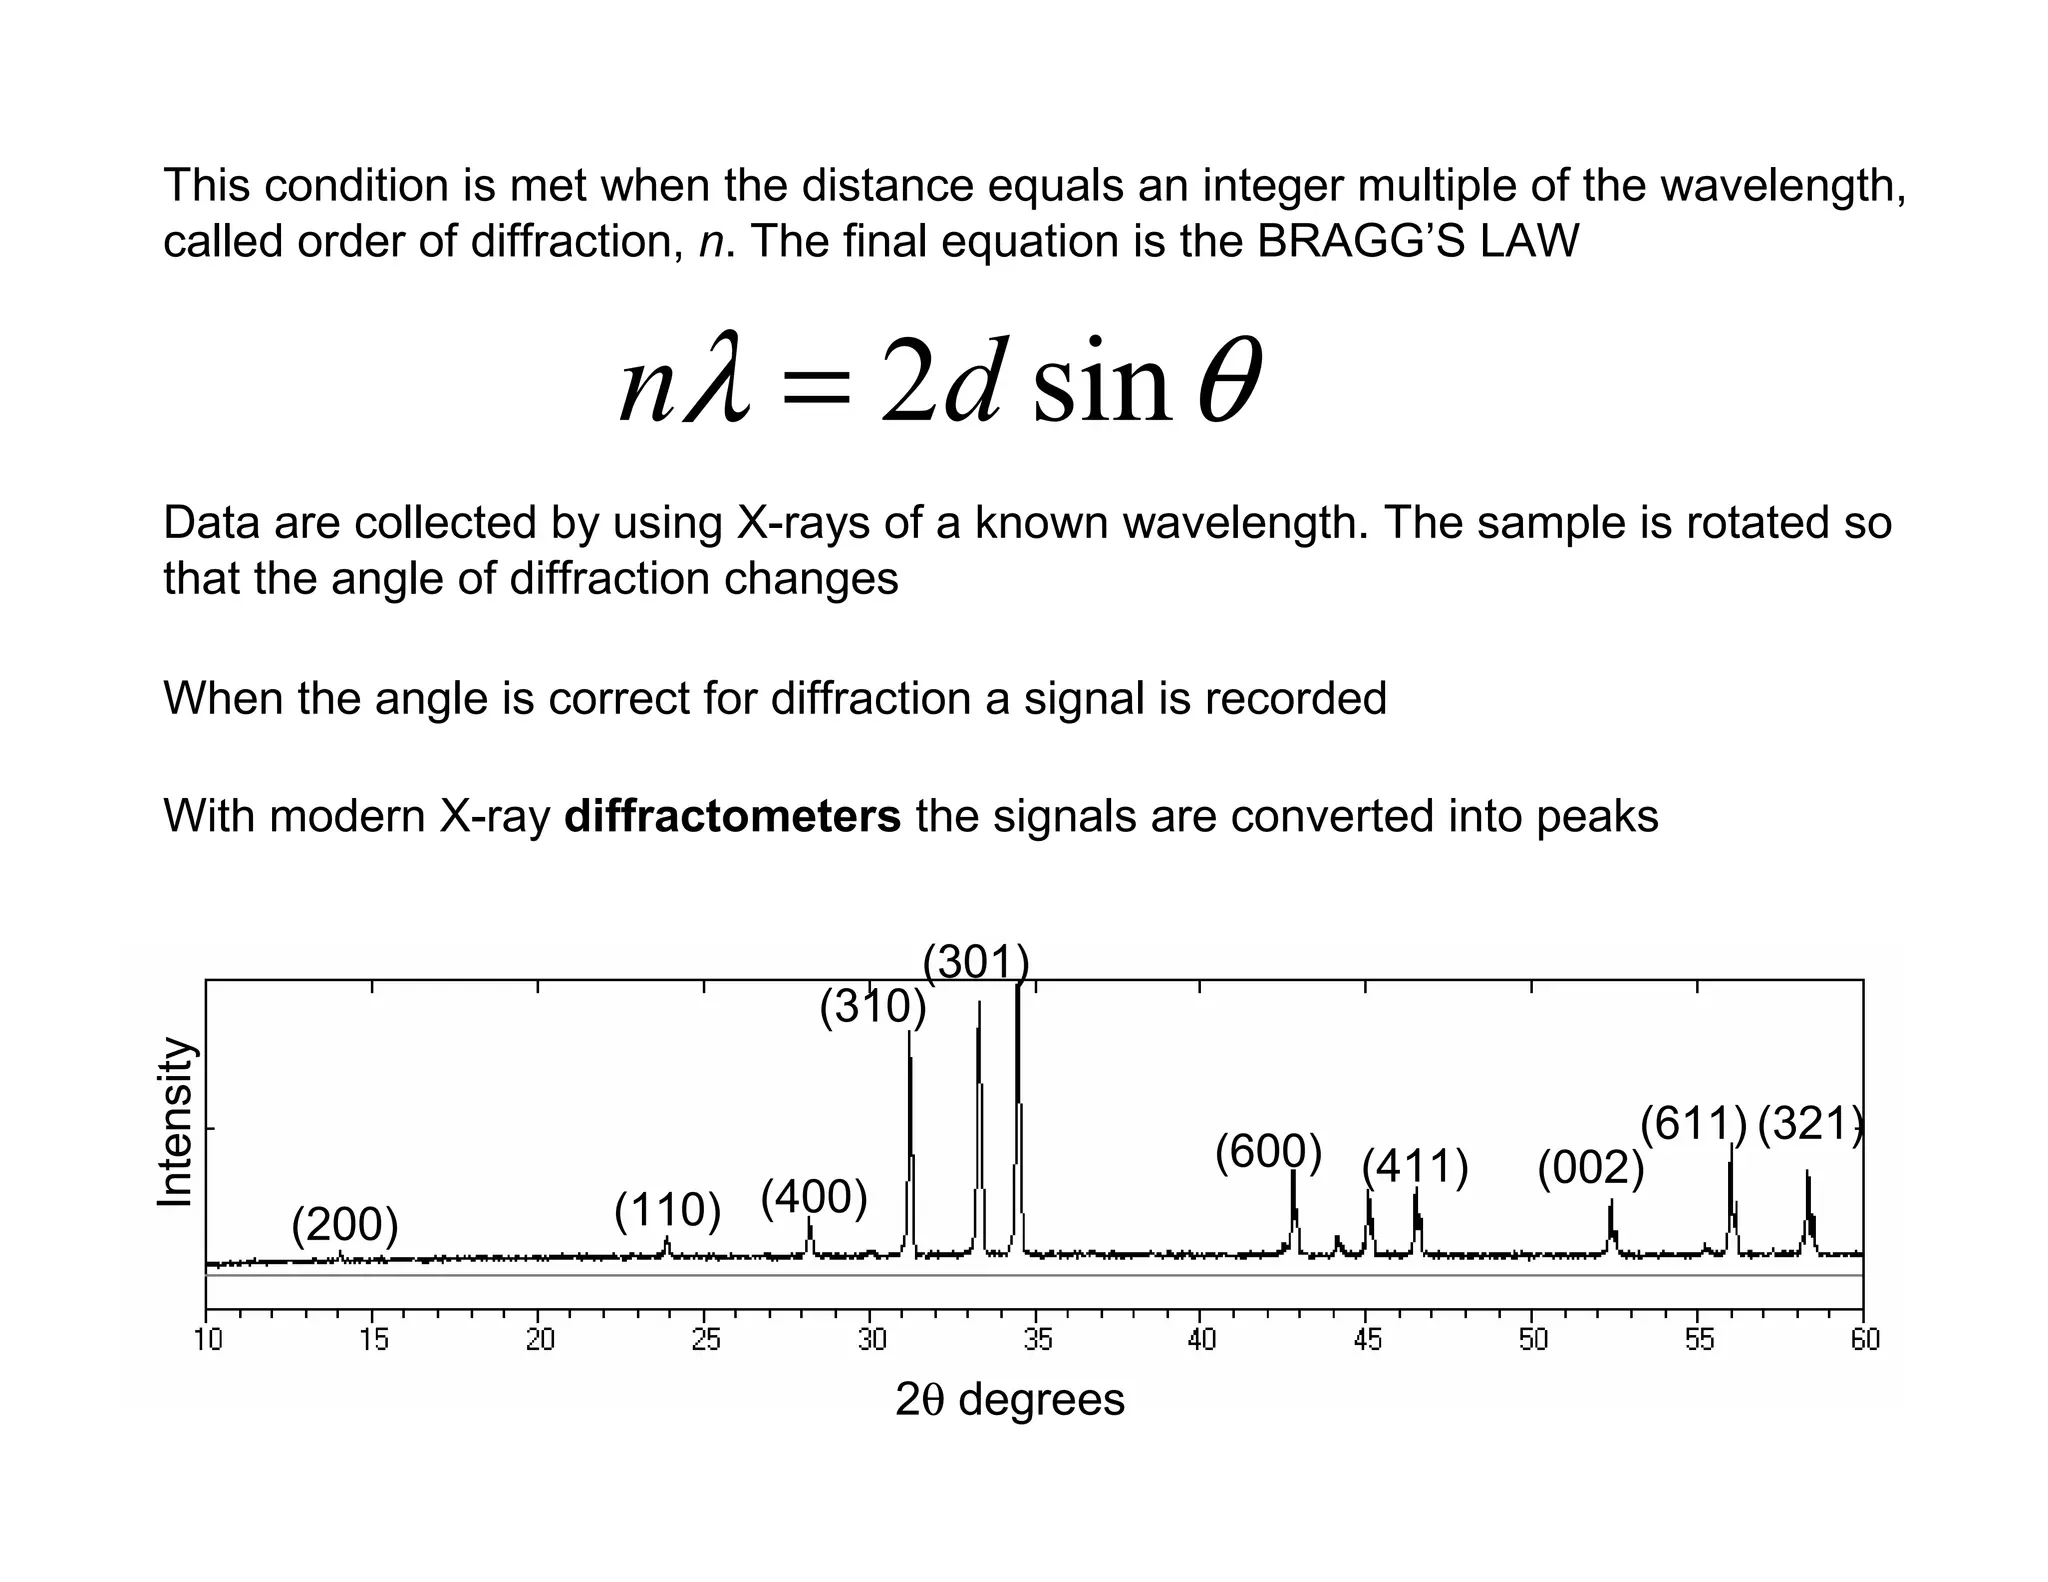
This condition ismet when the distance equals an integer multiple of the wavelength,
called order of diffraction, n. The final equation is the BRAGG’S LAW
θ
λ sin
2d
n =
Data are collected by using X-rays of a known wavelength. The sample is rotated so
that the angle of diffraction changes
When the angle is correct for diffraction a signal is recorded
With modern X-ray diffractometers the signals are converted into peaks
Intensity
2θ degrees
(200) (110) (400)
(310)
(301)
(600) (411) (002)
(611) (321)
10.
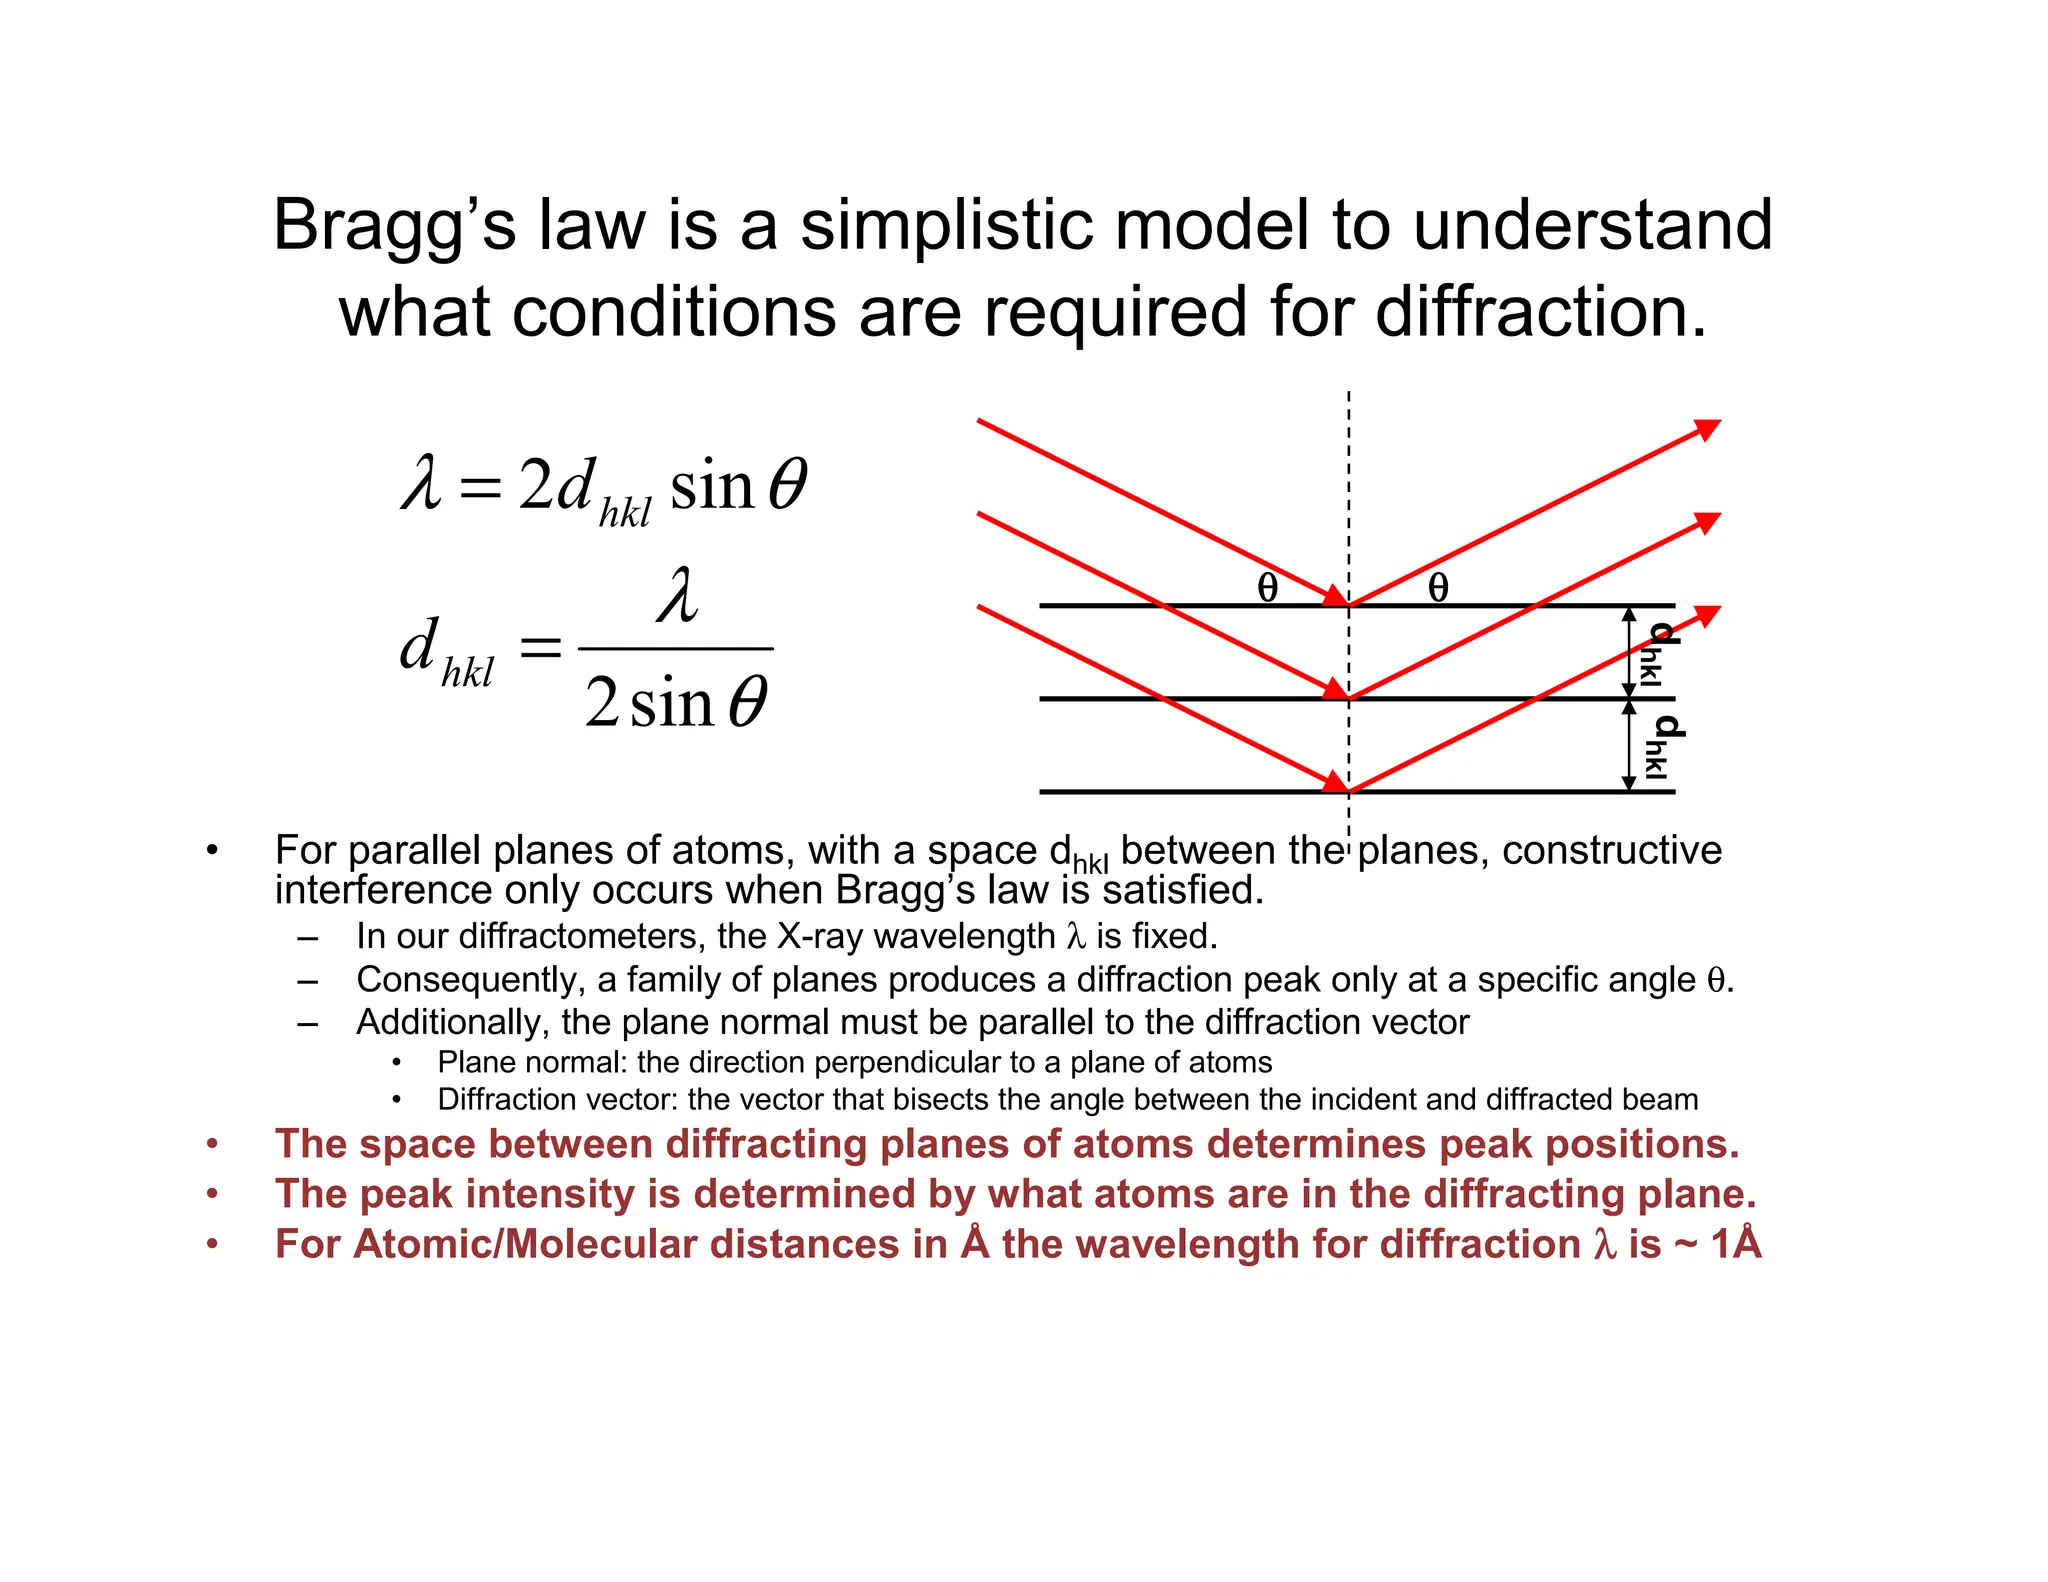
Bragg’s law isa simplistic model to understand
what conditions are required for diffraction.
• For parallel planes of atoms, with a space dhkl between the planes, constructive
interference only occurs when Bragg’s law is satisfied.
– In our diffractometers, the X-ray wavelength λ is fixed.
– Consequently, a family of planes produces a diffraction peak only at a specific angle θ.
– Additionally, the plane normal must be parallel to the diffraction vector
• Plane normal: the direction perpendicular to a plane of atoms
• Diffraction vector: the vector that bisects the angle between the incident and diffracted beam
• The space between diffracting planes of atoms determines peak positions.
• The peak intensity is determined by what atoms are in the diffracting plane.
• For Atomic/Molecular distances in Å the wavelength for diffraction λ
λ
λ
λ is ~ 1Å
θ
λ
θ
λ
sin
2
sin
2
=
=
hkl
hkl
d
d
θ
θ
θ
θ θ
θ
θ
θ
d
hkl
d
hkl
11.
CHARACTERIZATION OF THESTRUCTURE OF SOLIDS
Three main diffraction techniques ~ λ Å:
X-ray diffraction Electron diffraction Neutron diffraction
Principles of X-ray diffraction
Single crystal
Powder
X-rays are passed through a crystalline material and the patterns produced give
information of size and shape of the unit cell
X-rays passing through a crystal will be bent at various angles: this process is called
diffraction
X-rays interact with electrons in matter, i.e. are scattered by the electron clouds of
atoms
12.
The angles atwhich x-rays are diffracted depends on the distance between adjacent
layers of atoms or ions. X-rays that hit adjacent layers can add their energies
constructively when they are “in phase”. This produces dark dots on a detector plate
Diffraction in three dimensions
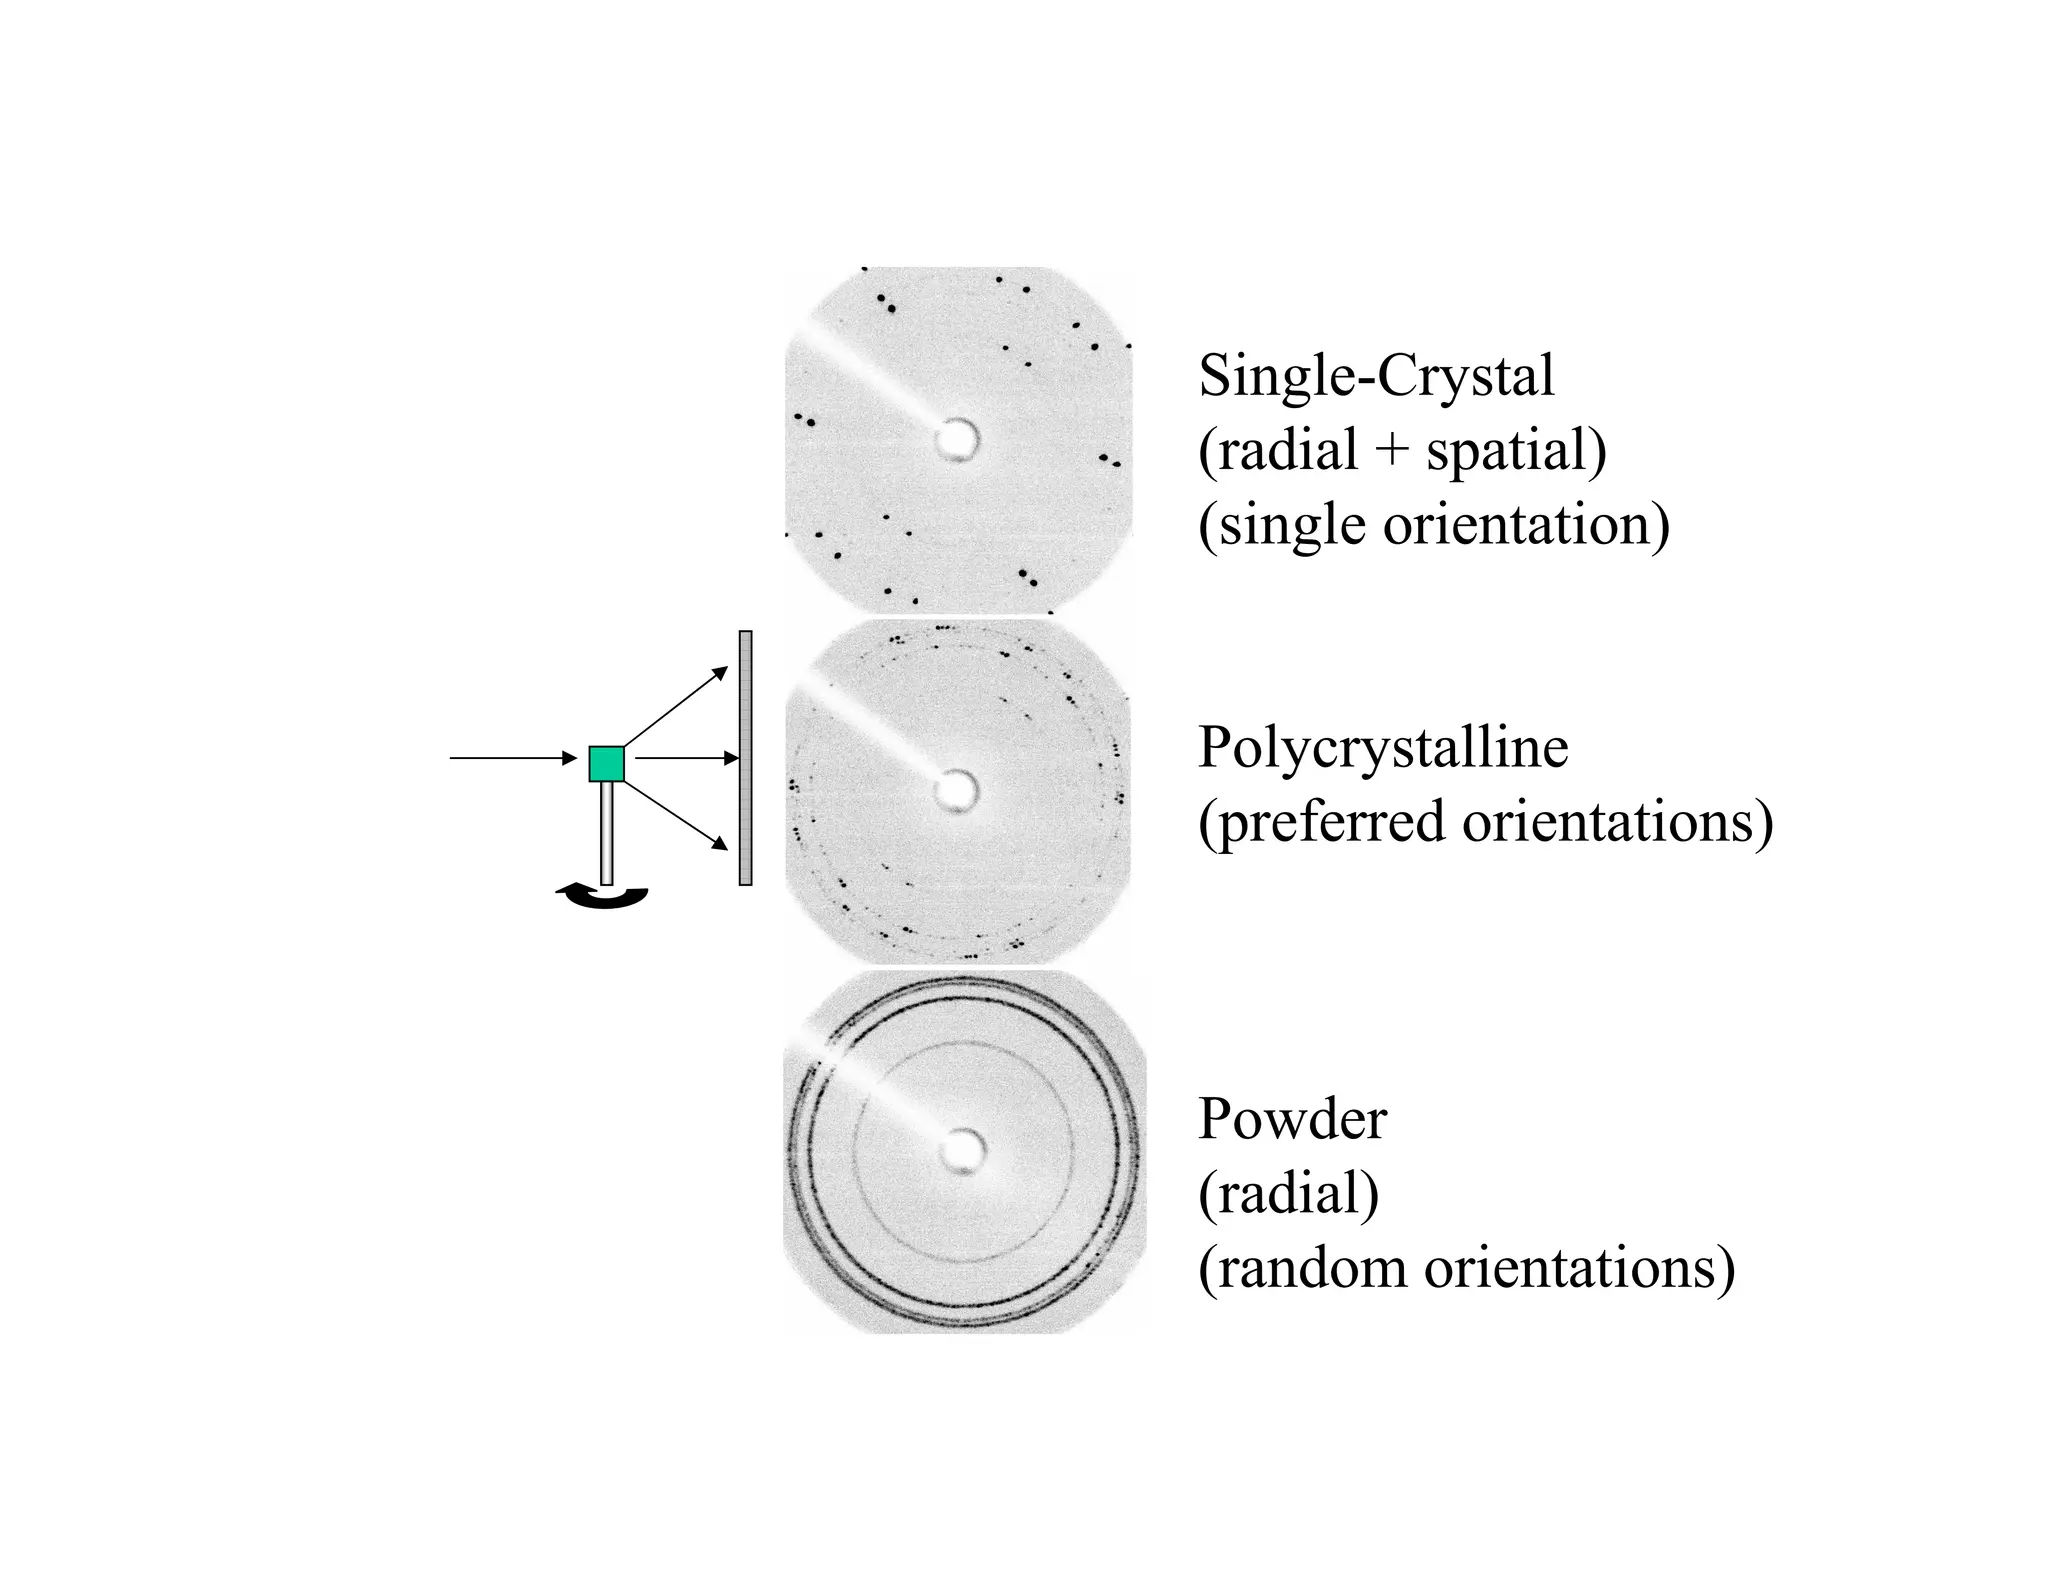
THE POWDER TECHNIQUE
AnX-ray beam diffracted from a lattice plane can be detected when the x-ray
source, the sample and the detector are correctly oriented to give Bragg diffraction
A powder or polycrystalline sample contains an enormous number of small
crystallites, which will adopt all possible orientations randomly
Thus for each possible diffraction angle there are crystals oriented correctly for
Bragg diffraction
Each set of planes in a crystal
will give rise to a cone of diffraction
Each cone consists of a set of closely spaced dots each one of which represents a
diffraction from a single crystallite
15.
Formation of apowder pattern
Powder sample
•Samples can be powder, sintered pellets, coatings on substrates, engine blocks,
…
•If the crystallites are randomly oriented, and there are enough of them, then they will
produce a continuous Debye cone.
•In a linear diffraction pattern, the detector scans through an arc that intersects each
Debye cone at a single point; thus giving the appearance of a discrete diffraction peak.
16.
Experimental Methods
To obtainX-ray diffraction data, the diffraction angles of the various cones, 2θ,
must be determined
The main techniques are: Debye-Scherrer camera (photographic film) or
powder diffractometer
Debye Scherrer Camera
θ
θ
θ
θ θ
θ
θ
θ
θ + θ = 2θ
17.
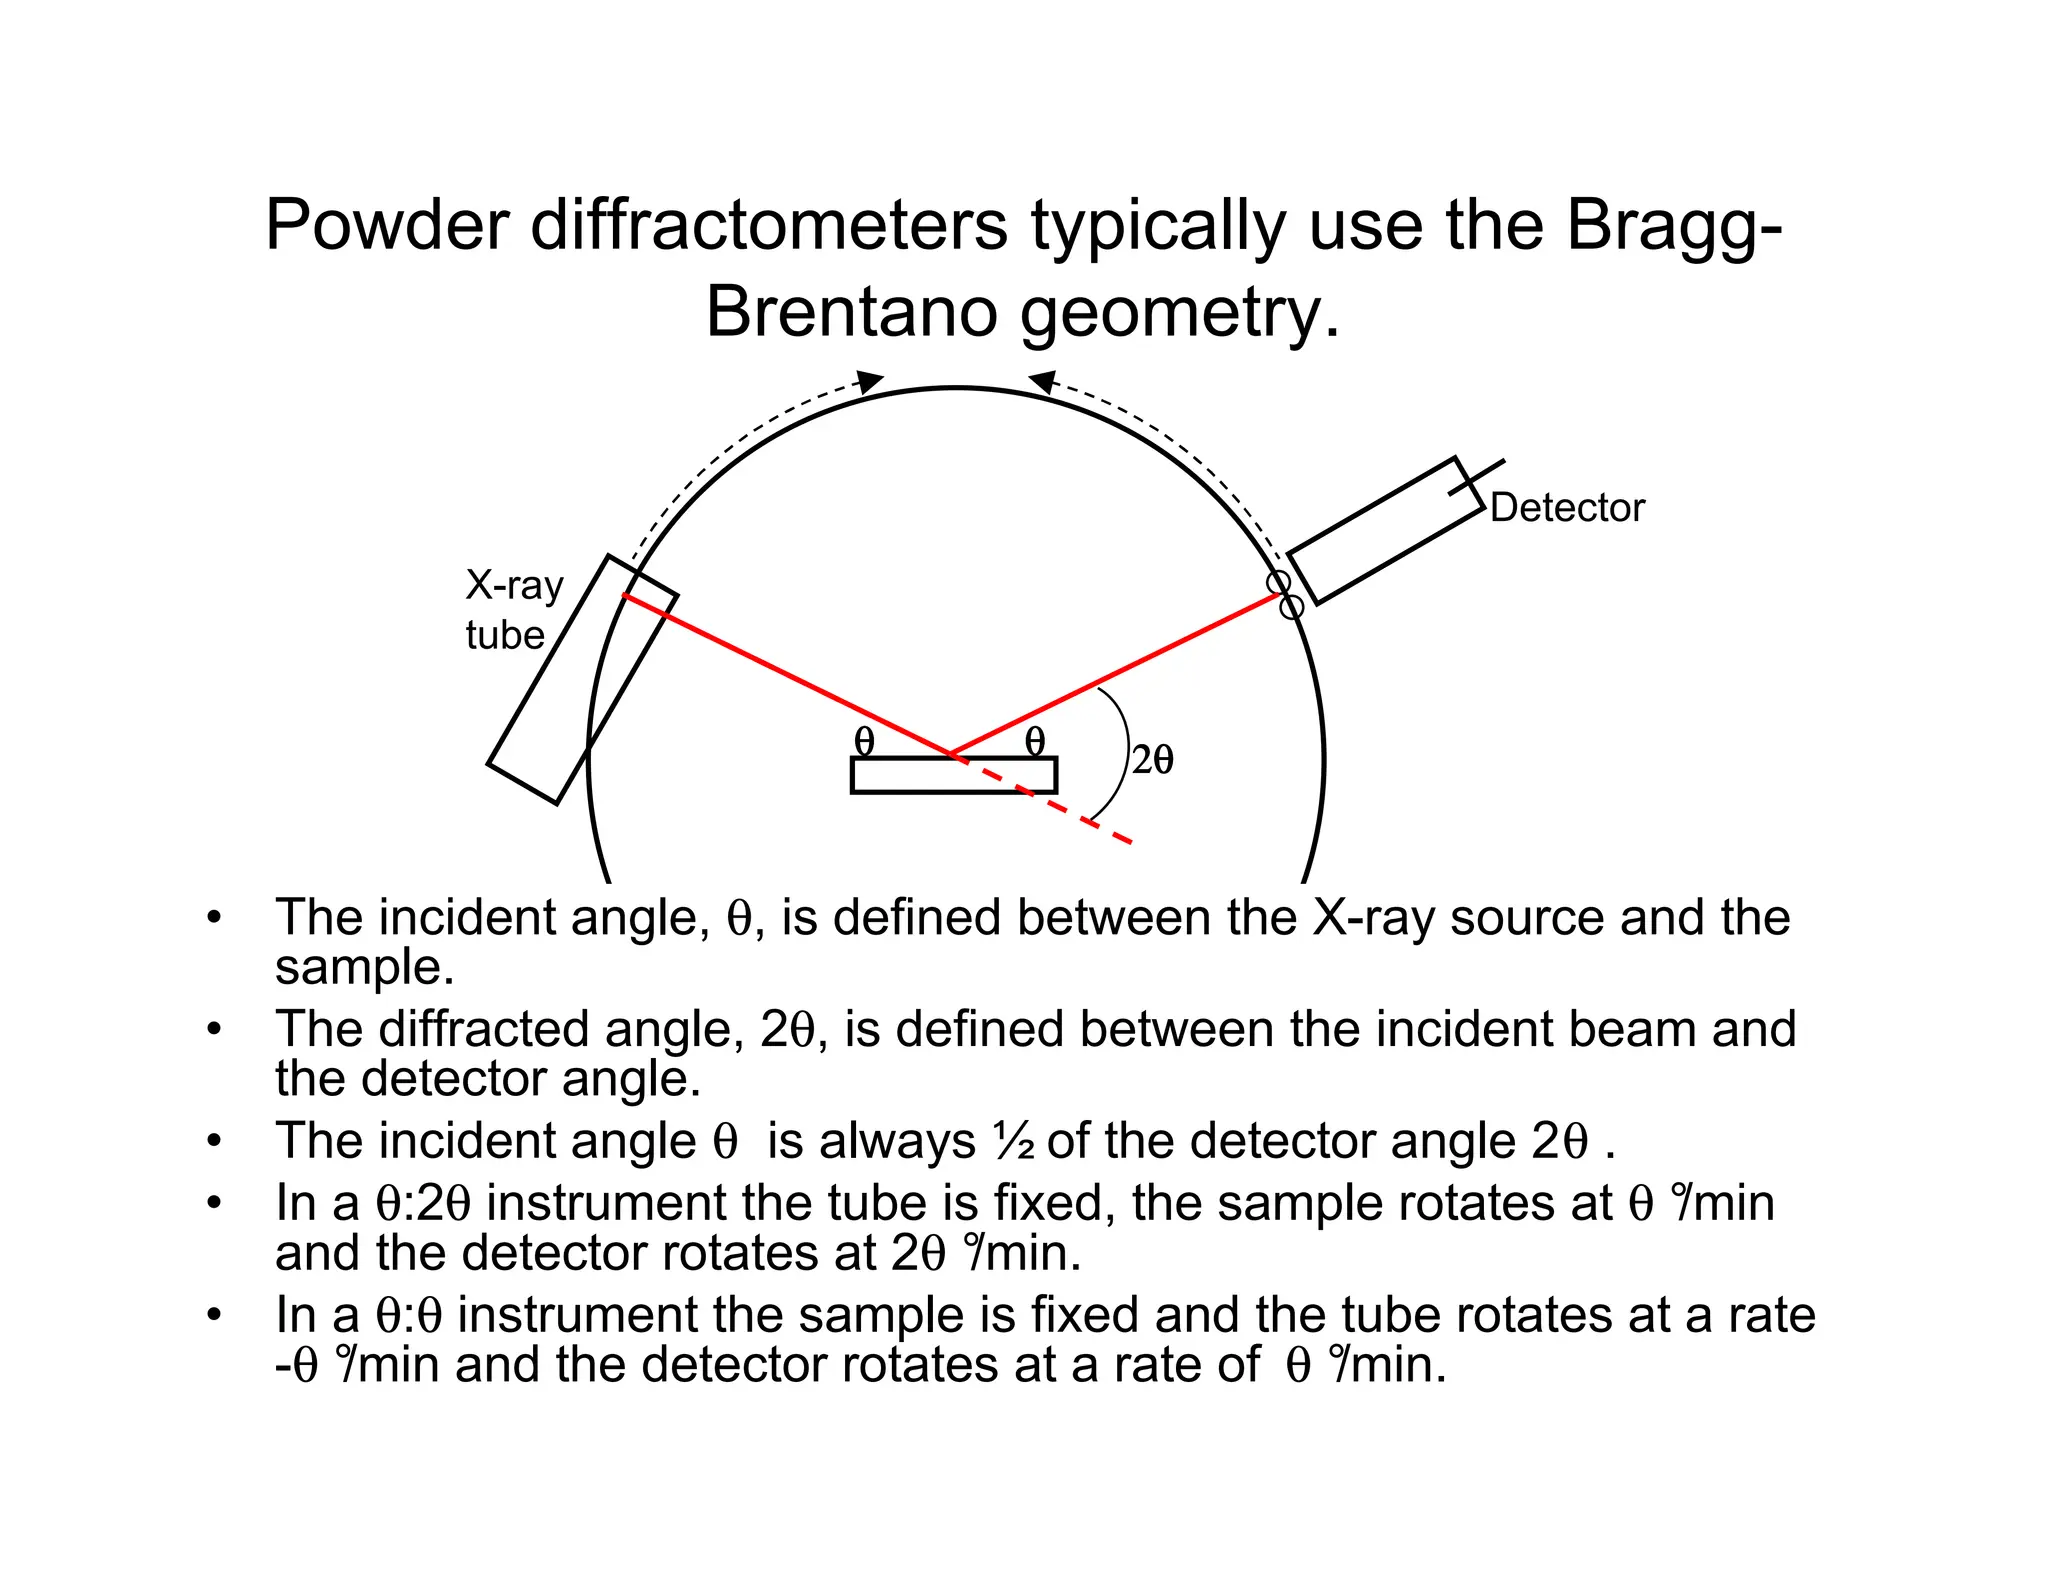
Powder diffractometers typicallyuse the Bragg-
Brentano geometry.
θ
θ
θ
θ
θ
θ
θ
θ 2θ
2θ
2θ
2θ
• The incident angle, θ, is defined between the X-ray source and the
sample.
• The diffracted angle, 2θ, is defined between the incident beam and
the detector angle.
• The incident angle θ is always ½ of the detector angle 2θ .
• In a θ:2θ instrument the tube is fixed, the sample rotates at θ °
/min
and the detector rotates at 2θ °
/min.
• In a θ:θ instrument the sample is fixed and the tube rotates at a rate
-θ °
/min and the detector rotates at a rate of θ °
/min.
X-ray
tube
Detector
18.
Powder, crystals inrandom orientations
Goniometer swings through many angles
Enough crystals, enough angles, get
enough diffraction to determine material
19.
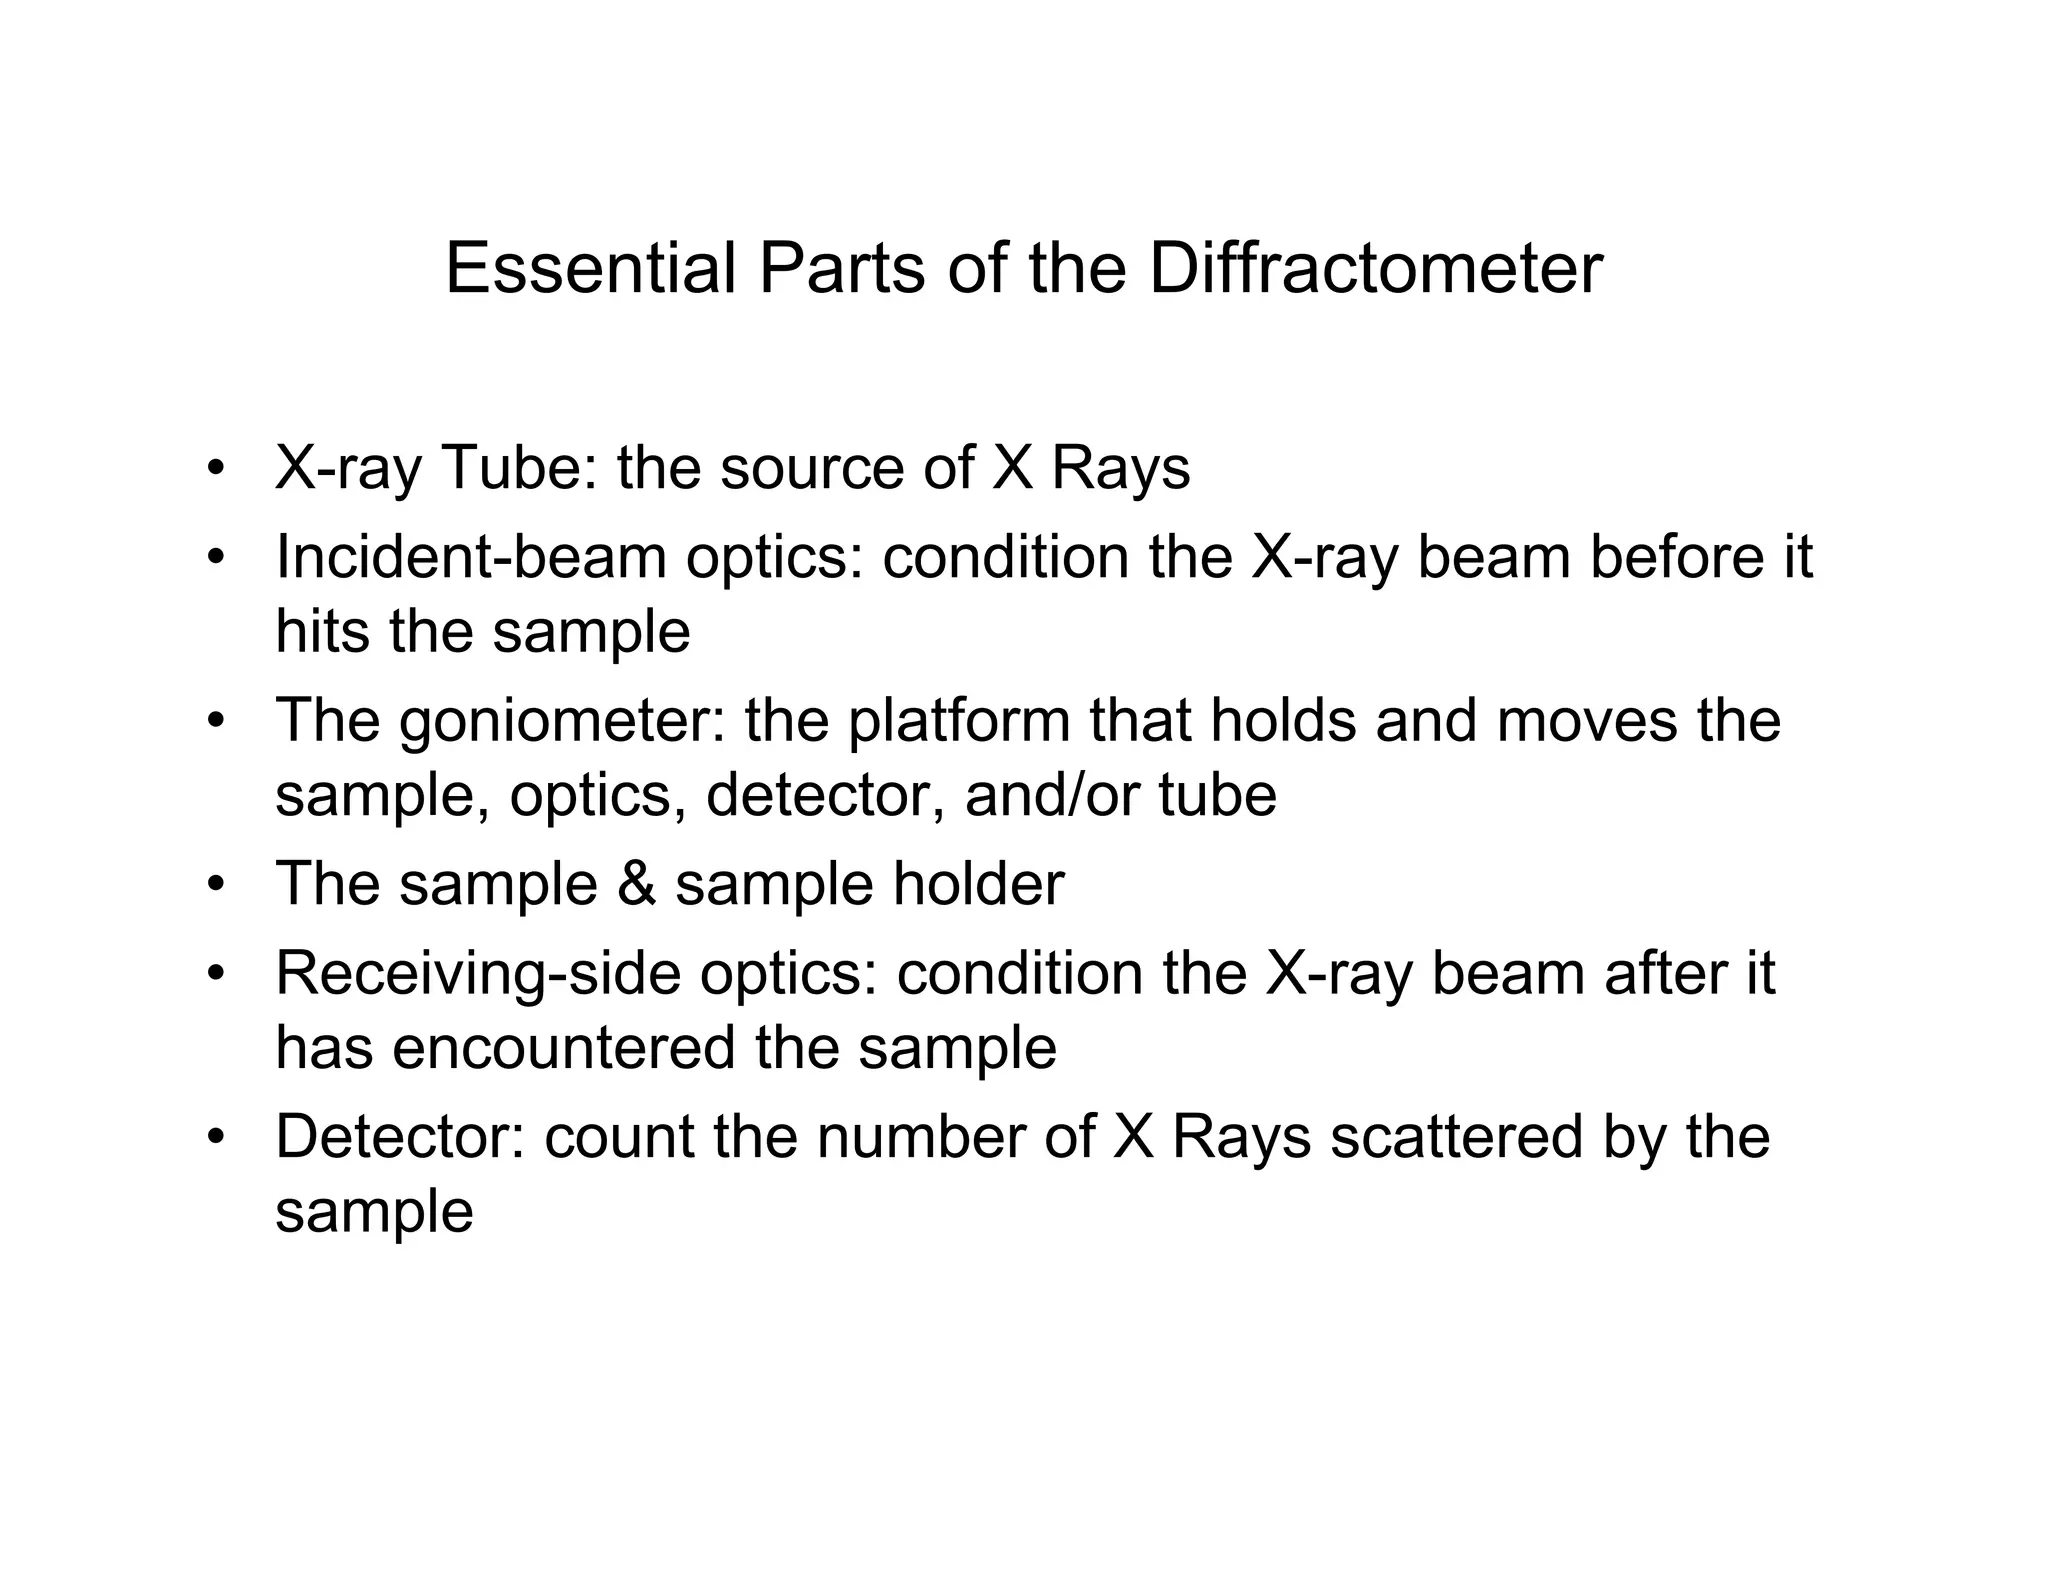
Essential Parts ofthe Diffractometer
• X-ray Tube: the source of X Rays
• Incident-beam optics: condition the X-ray beam before it
hits the sample
• The goniometer: the platform that holds and moves the
sample, optics, detector, and/or tube
• The sample sample holder
• Receiving-side optics: condition the X-ray beam after it
has encountered the sample
• Detector: count the number of X Rays scattered by the
sample
20.
Monochromators remove unwantedwavelengths of
radiation from the incident or diffracted X-ray beam.
• Diffraction from a crystal monochromator can be used to
select one wavelength of radiation and provide energy
discrimination.
• An incident-beam monochromator might be used to
select only Kα1 radiation for the tube source.
• A diffracted-beam monochromator may be used to
remove fluoresced photons, Kβ, or W-contamination
photons from reaching the detector.
21.
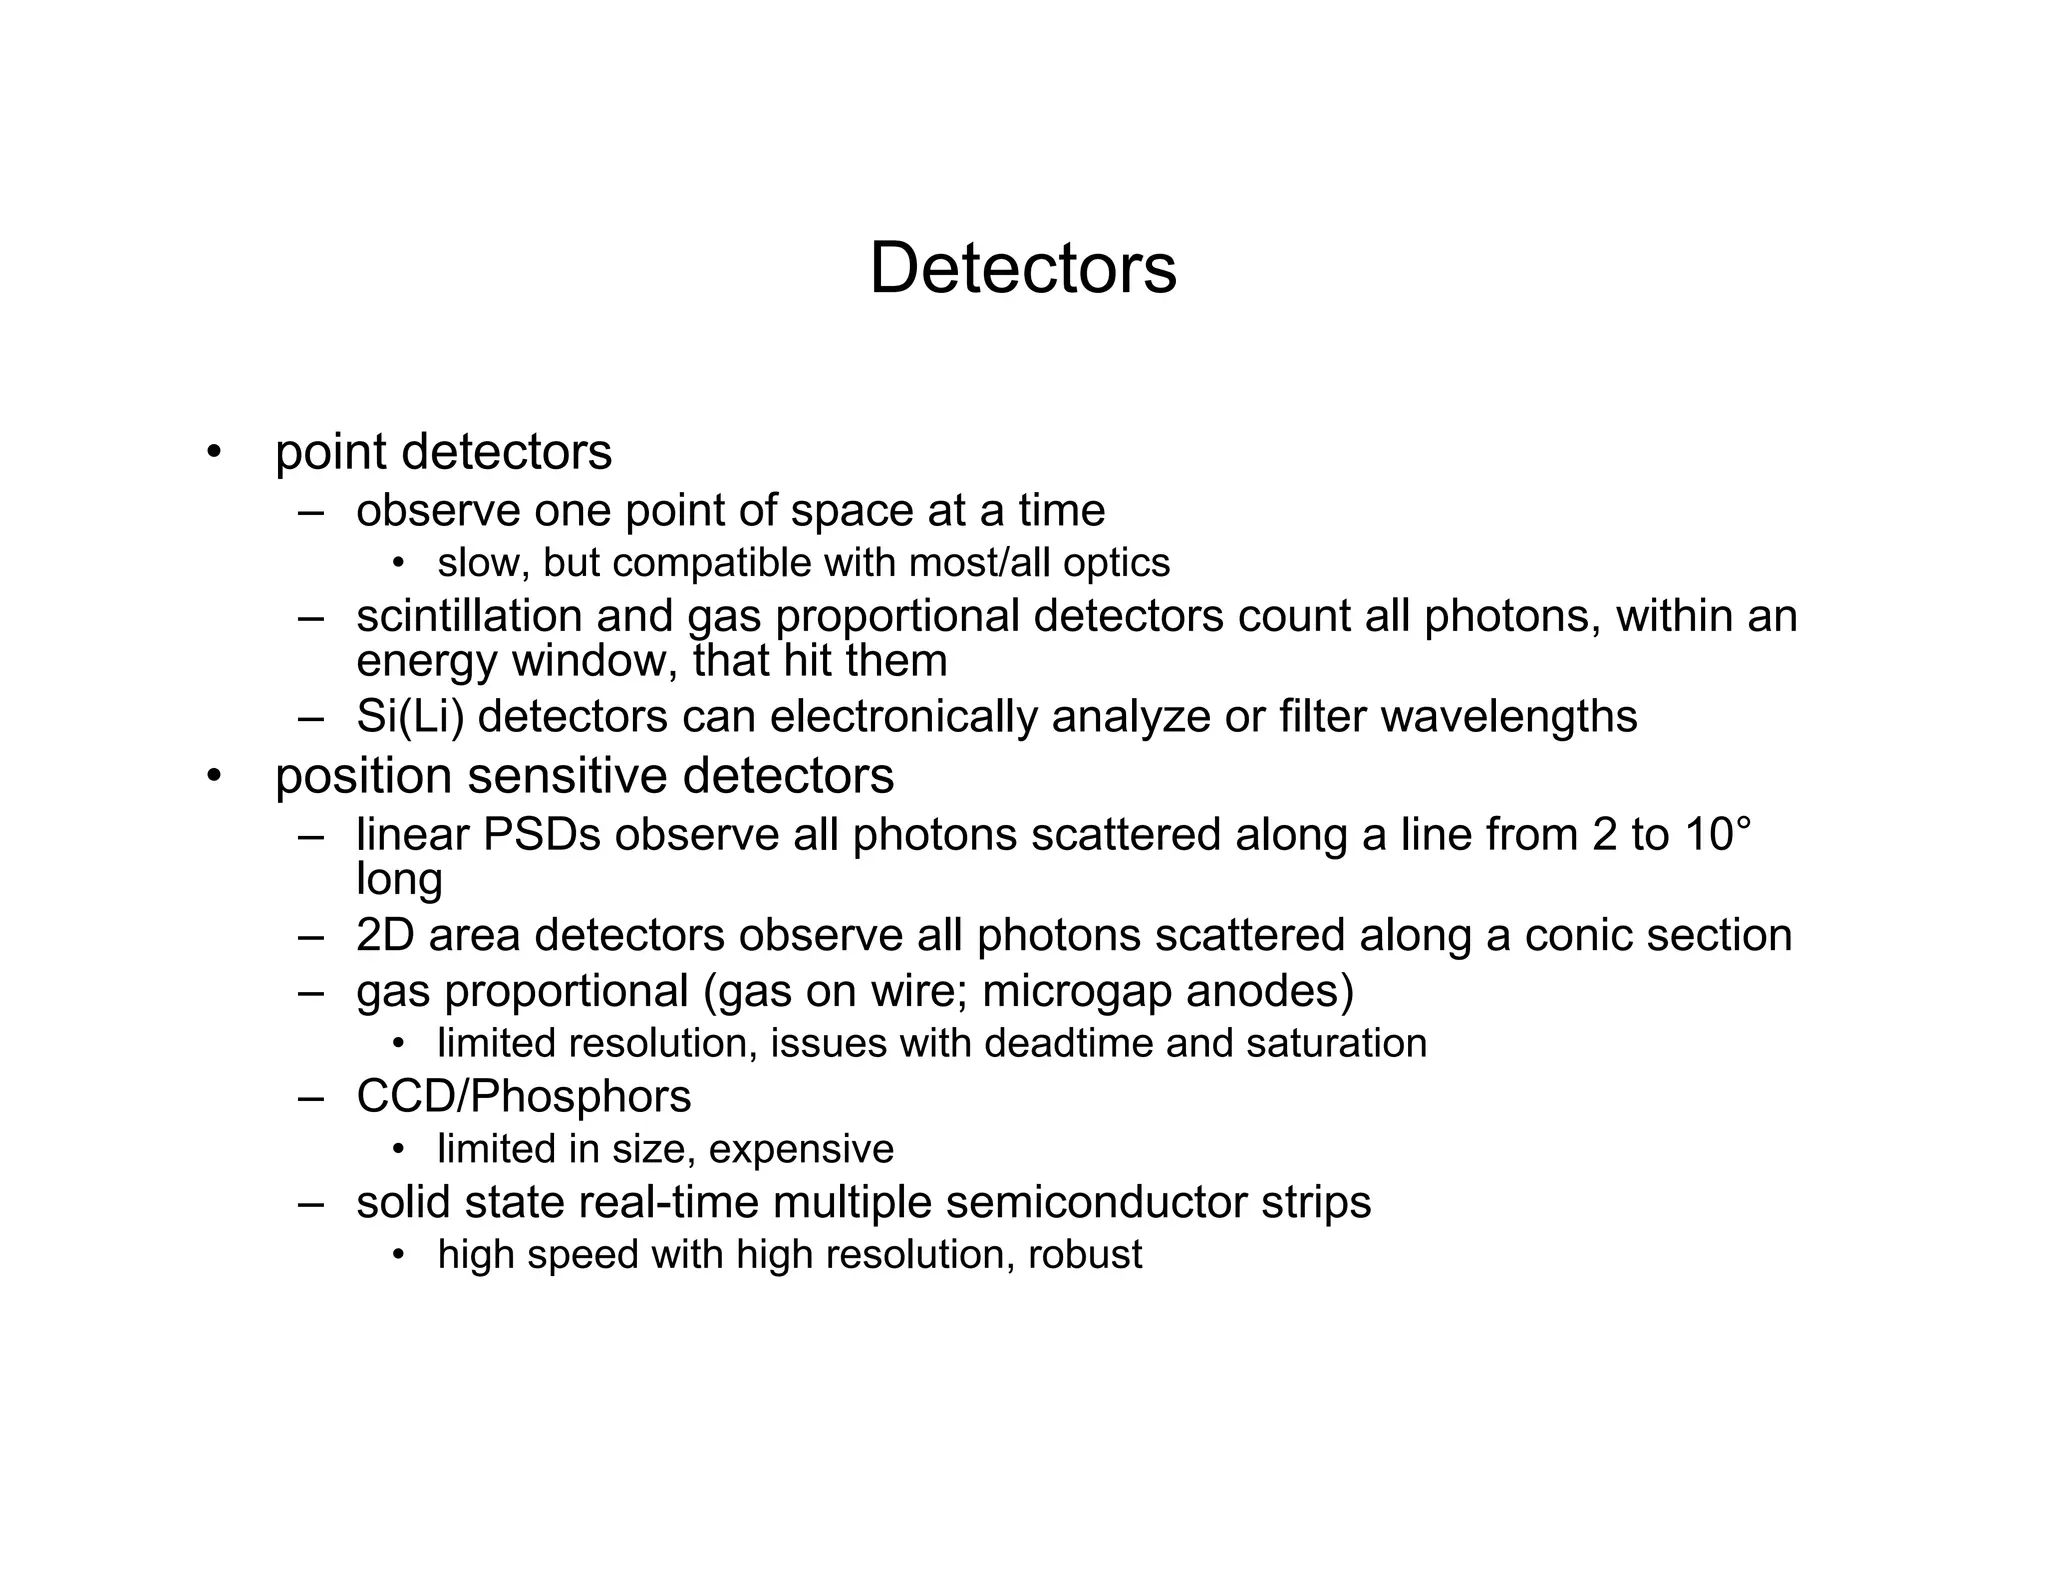
Detectors
• point detectors
–observe one point of space at a time
• slow, but compatible with most/all optics
– scintillation and gas proportional detectors count all photons, within an
energy window, that hit them
– Si(Li) detectors can electronically analyze or filter wavelengths
• position sensitive detectors
– linear PSDs observe all photons scattered along a line from 2 to 10°
long
– 2D area detectors observe all photons scattered along a conic section
– gas proportional (gas on wire; microgap anodes)
• limited resolution, issues with deadtime and saturation
– CCD/Phosphors
• limited in size, expensive
– solid state real-time multiple semiconductor strips
• high speed with high resolution, robust
Preparing a powderspecimen
• An ideal powder sample should have many crystallites in random
orientations
– the distribution of orientations should be smooth and equally distributed
amongst all orientations
• If the crystallites in a sample are very large, there will not be a
smooth distribution of crystal orientations. You will not get a powder
average diffraction pattern.
– crystallites should be 10µm in size to get good powder statistics
• Large crystallite sizes and non-random crystallite orientations both
lead to peak intensity variation
– the measured diffraction pattern will not agree with that expected from
an ideal powder
– the measured diffraction pattern will not agree with reference patterns in
the Powder Diffraction File (PDF) database
24.
Ways to preparea powder sample
• Top-loading a bulk powder into a well
– deposit powder in a shallow well of a sample holder. Use a slightly rough flat
surface to press down on the powder, packing it into the well.
• using a slightly rough surface to pack the powder can help minimize preferred orientation
• mixing the sample with a filler such as flour or glass powder may also help minimize
preferred orientation
• powder may need to be mixed with a binder to prevent it from falling out of the sample
holder
– alternatively, the well of the sample holder can be coated with a thin layer of
Vaseline
25.
• Dispersing athin powder layer on a smooth surface
– a smooth surface such as a glass slide or a zero background holder
(ZBH) may be used to hold a thin layer of powder
• glass will contribute an amorphous hump to the diffraction pattern
• the ZBH avoids this problem by using an off-axis cut single crystal
– dispersing the powder with alcohol onto the sample holder and then
allowing the alcohol to evaporate, often provides a nice, even coating of
powder that will adhere to the sample holder
– powder may be gently sprinkled onto a piece of double-sided tape or a
thin layer of Vaseline to adhere it to the sample holder
• the double-sided tape will contribute to the diffraction pattern
– these methods are necessary for mounting small amounts of powder
– these methods help alleviate problems with preferred orientation
– the constant volume assumption is not valid for this type of sample, and
so quantitative and Rietveld analysis will require extra work and may not
be possible
26.
Important characteristics ofsamples for XRPD
• a flat plate sample for XRPD should have a smooth flat
surface
– if the surface is not smooth and flat, X-ray absorption may
reduce the intensity of low angle peaks
– parallel-beam optics can be used to analyze samples with odd
shapes or rough surfaces
• Densely packed
• Randomly oriented grains/crystallites
• Grain size less than 10 microns
• ‘Infinitely’ thick
27.
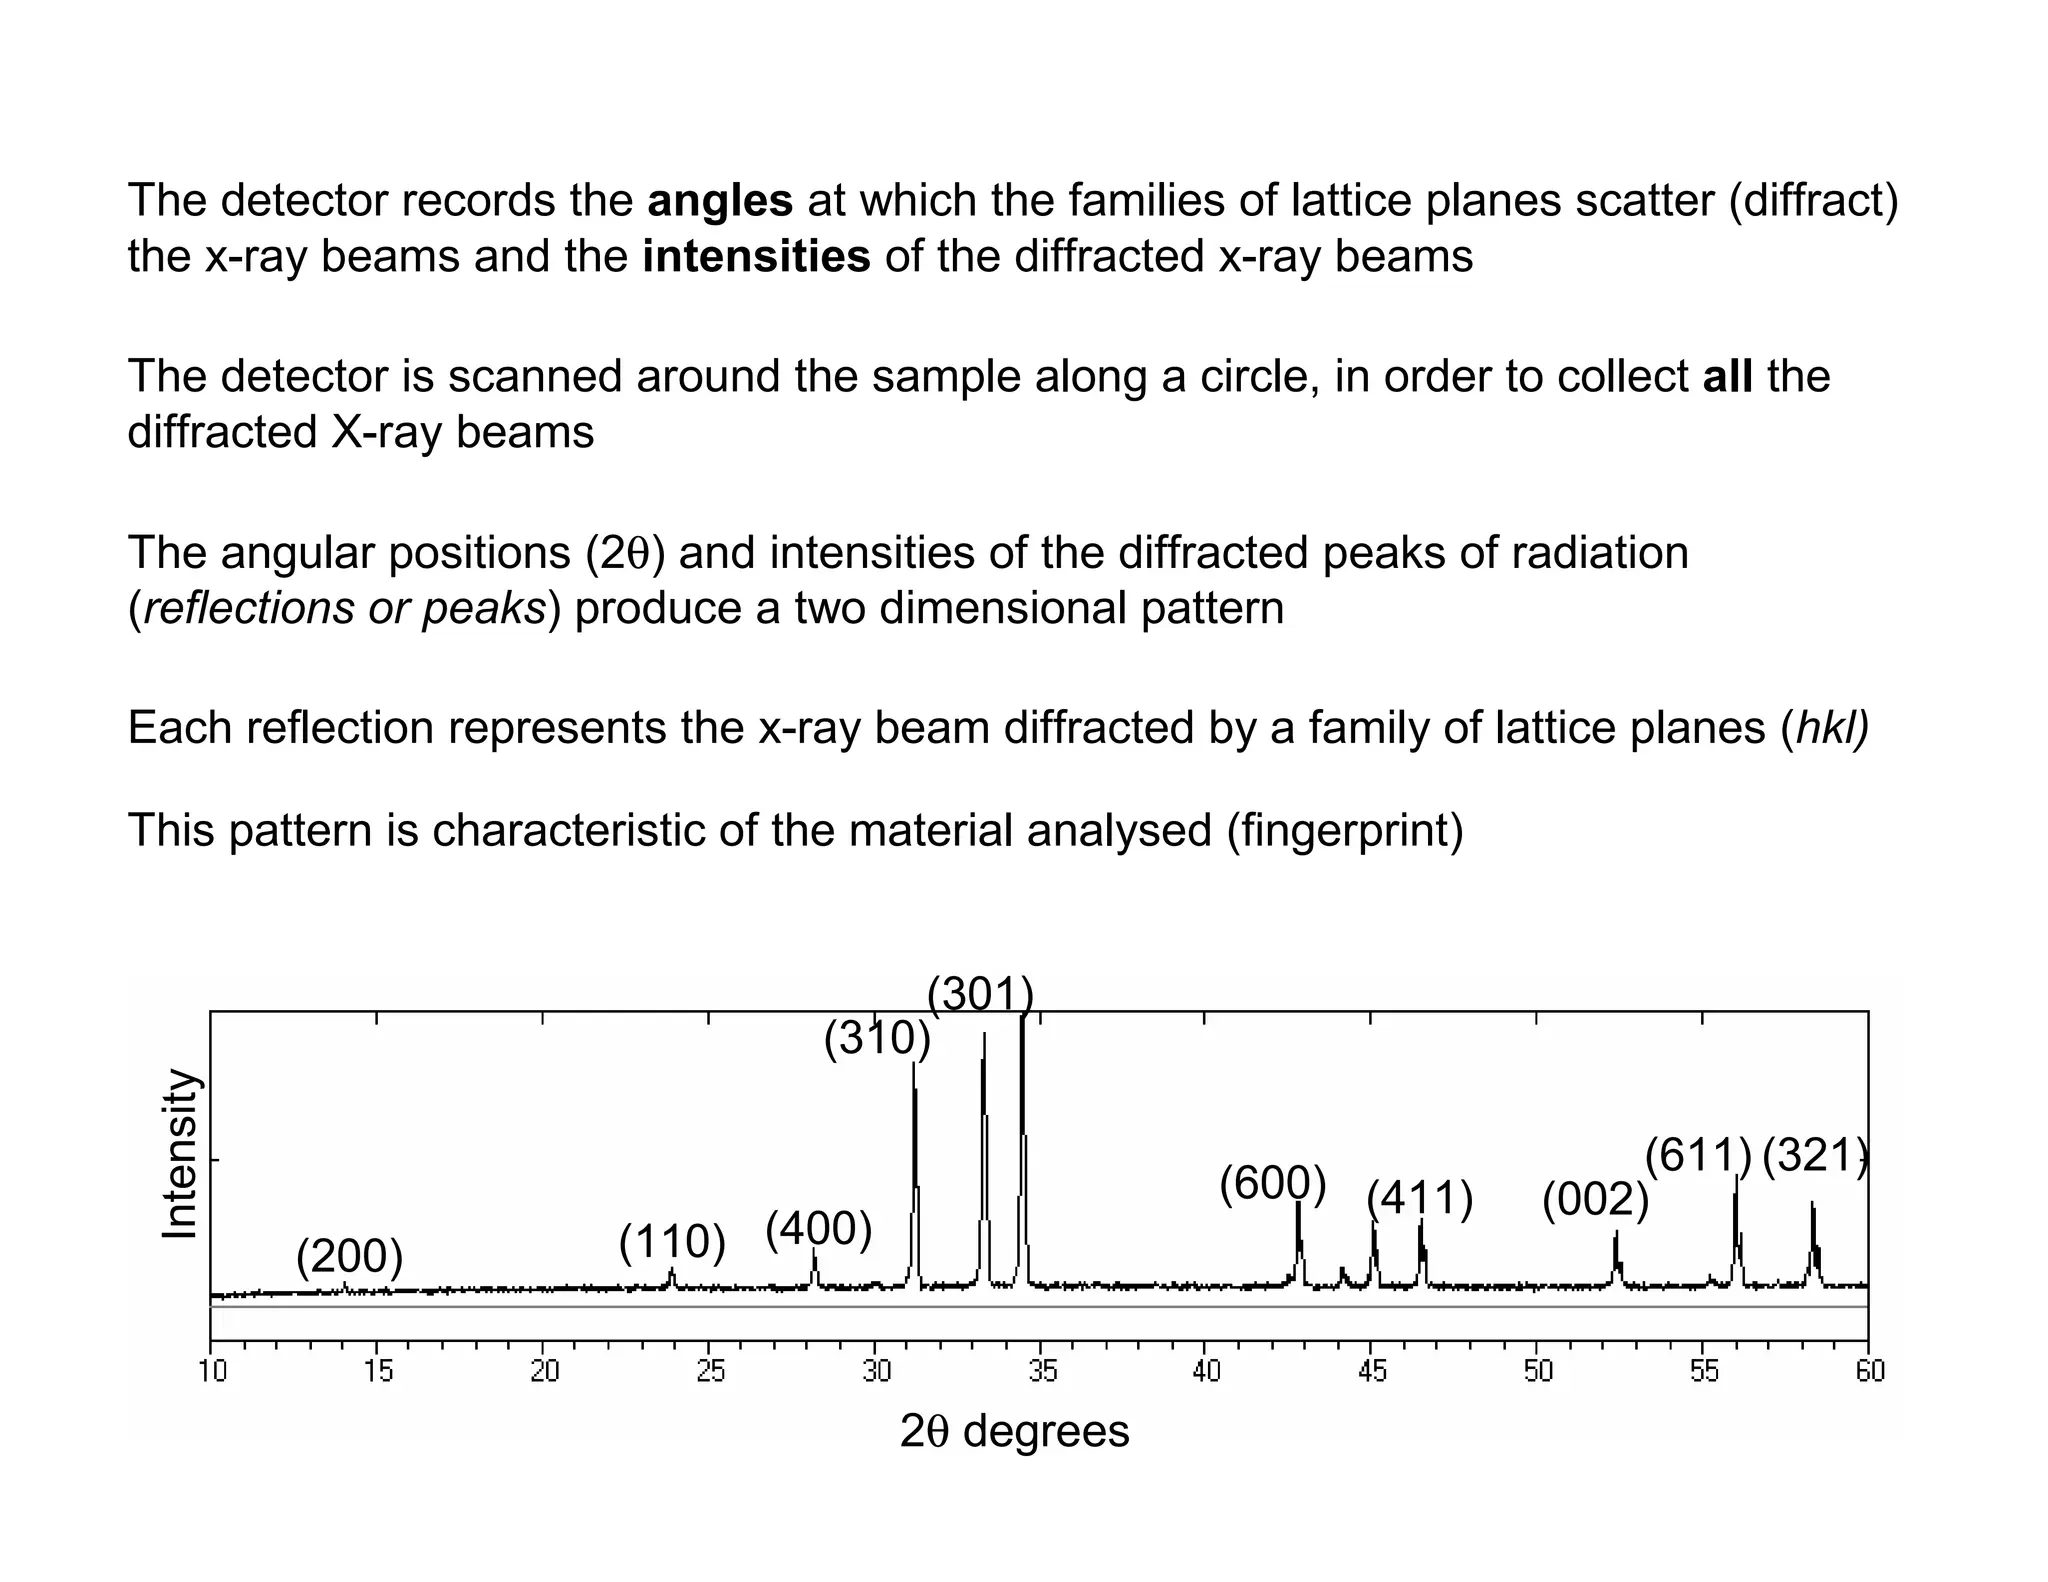
The detector recordsthe angles at which the families of lattice planes scatter (diffract)
the x-ray beams and the intensities of the diffracted x-ray beams
The detector is scanned around the sample along a circle, in order to collect all the
diffracted X-ray beams
The angular positions (2θ) and intensities of the diffracted peaks of radiation
(reflections or peaks) produce a two dimensional pattern
This pattern is characteristic of the material analysed (fingerprint)
Each reflection represents the x-ray beam diffracted by a family of lattice planes (hkl)
Intensity
2θ degrees
(200) (110) (400)
(310)
(301)
(600) (411) (002)
(611) (321)
28.
APPLICATIONS AND INTERPRETATION
OFX-RAY POWDER DIFFRACTION DATA
Number and positions (2θ
θ
θ
θ) of peaks
crystal class
lattice type
cell parameters
Intensity of peaks
types of atoms
position of atoms
Information is gained from:
Identification of unknown phases
Determination of phase purity
Determination and refinement of lattice parameters
Investigation of phase changes
Structure refinement
Determination of crystallite size
29.
Basic ideas ofchemical analysis by X-ray
diffraction
• Qualitative analyses -- the goal is to determine what
phases are present
• Quantitative analyses -- the goal is to determine
how much of each phase is present
• Note that diffraction methods determine phases, not
elements
• Diffraction methods have the advantage that the
sample does not have to be dissociated, dissolved, or
otherwise changed (non-destructive).
30.
The powder diffractionpattern as a “fingerprint”
• Experience has shown that the ensemble of d-
spacings (d=λ/2sinθ) and intensities (“I”’s) are
sufficiently distinctive in order to identify phases
• “Uniqueness” is not a problem, particularly when
combined with common sense
• Phase determination can be performed by a
comparison of a set of experimental d’s and I’s
with a database of d-I files
• d-spacings are independent of wavelength
• Intensities are relative (most intense = 100)
31.
Powder diffraction datafrom known compounds have been compiled into a
database (PDF) by the Joint Committee on Powder Diffraction Standard,
(JCPDS)
This technique can be used in a variety of ways
The powder diffractogram of a compound is its ‘fingerprint’ and can
be used to identify the compound
‘Search-match’ programs are used to compare experimental diffractograms
with patterns of known compounds included in the database
Identification of compounds
32.
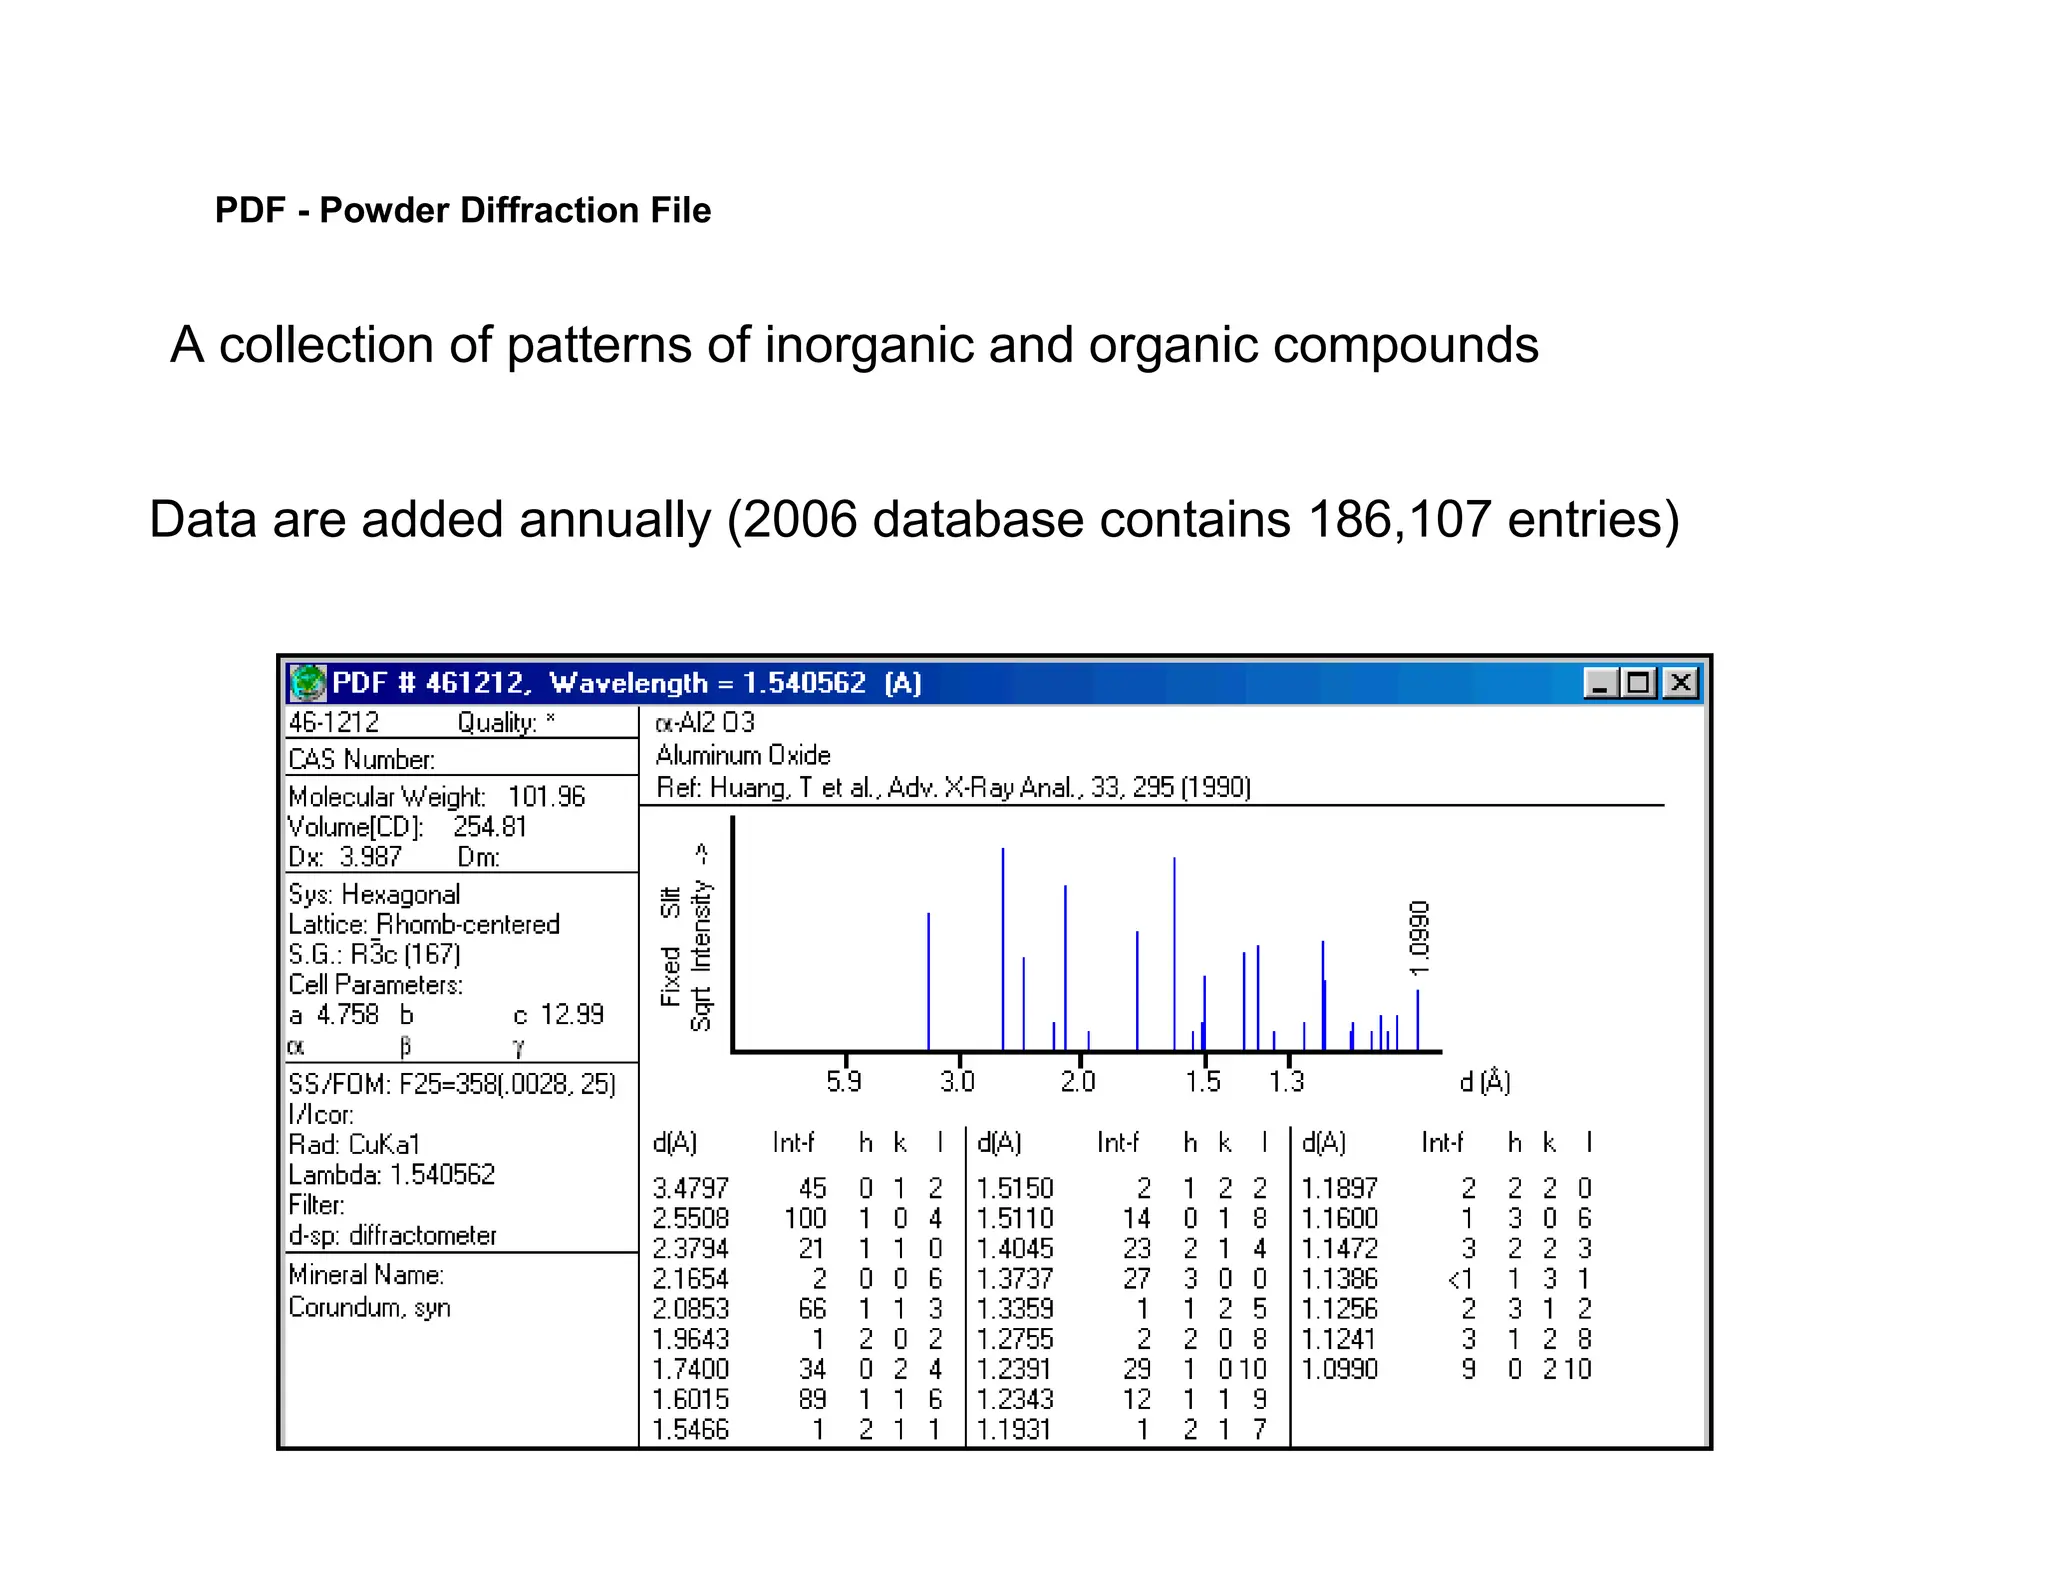
PDF - PowderDiffraction File
A collection of patterns of inorganic and organic compounds
Data are added annually (2006 database contains 186,107 entries)
Outcomes of solidstate reactions
Product: SrCuO2?
Pattern for SrCuO2from database
Product: Sr2CuO3?
Pattern for Sr2CuO3from database
CuO
2SrCO3 +
2
SrCuO
3
CuO
Sr2
?
35.
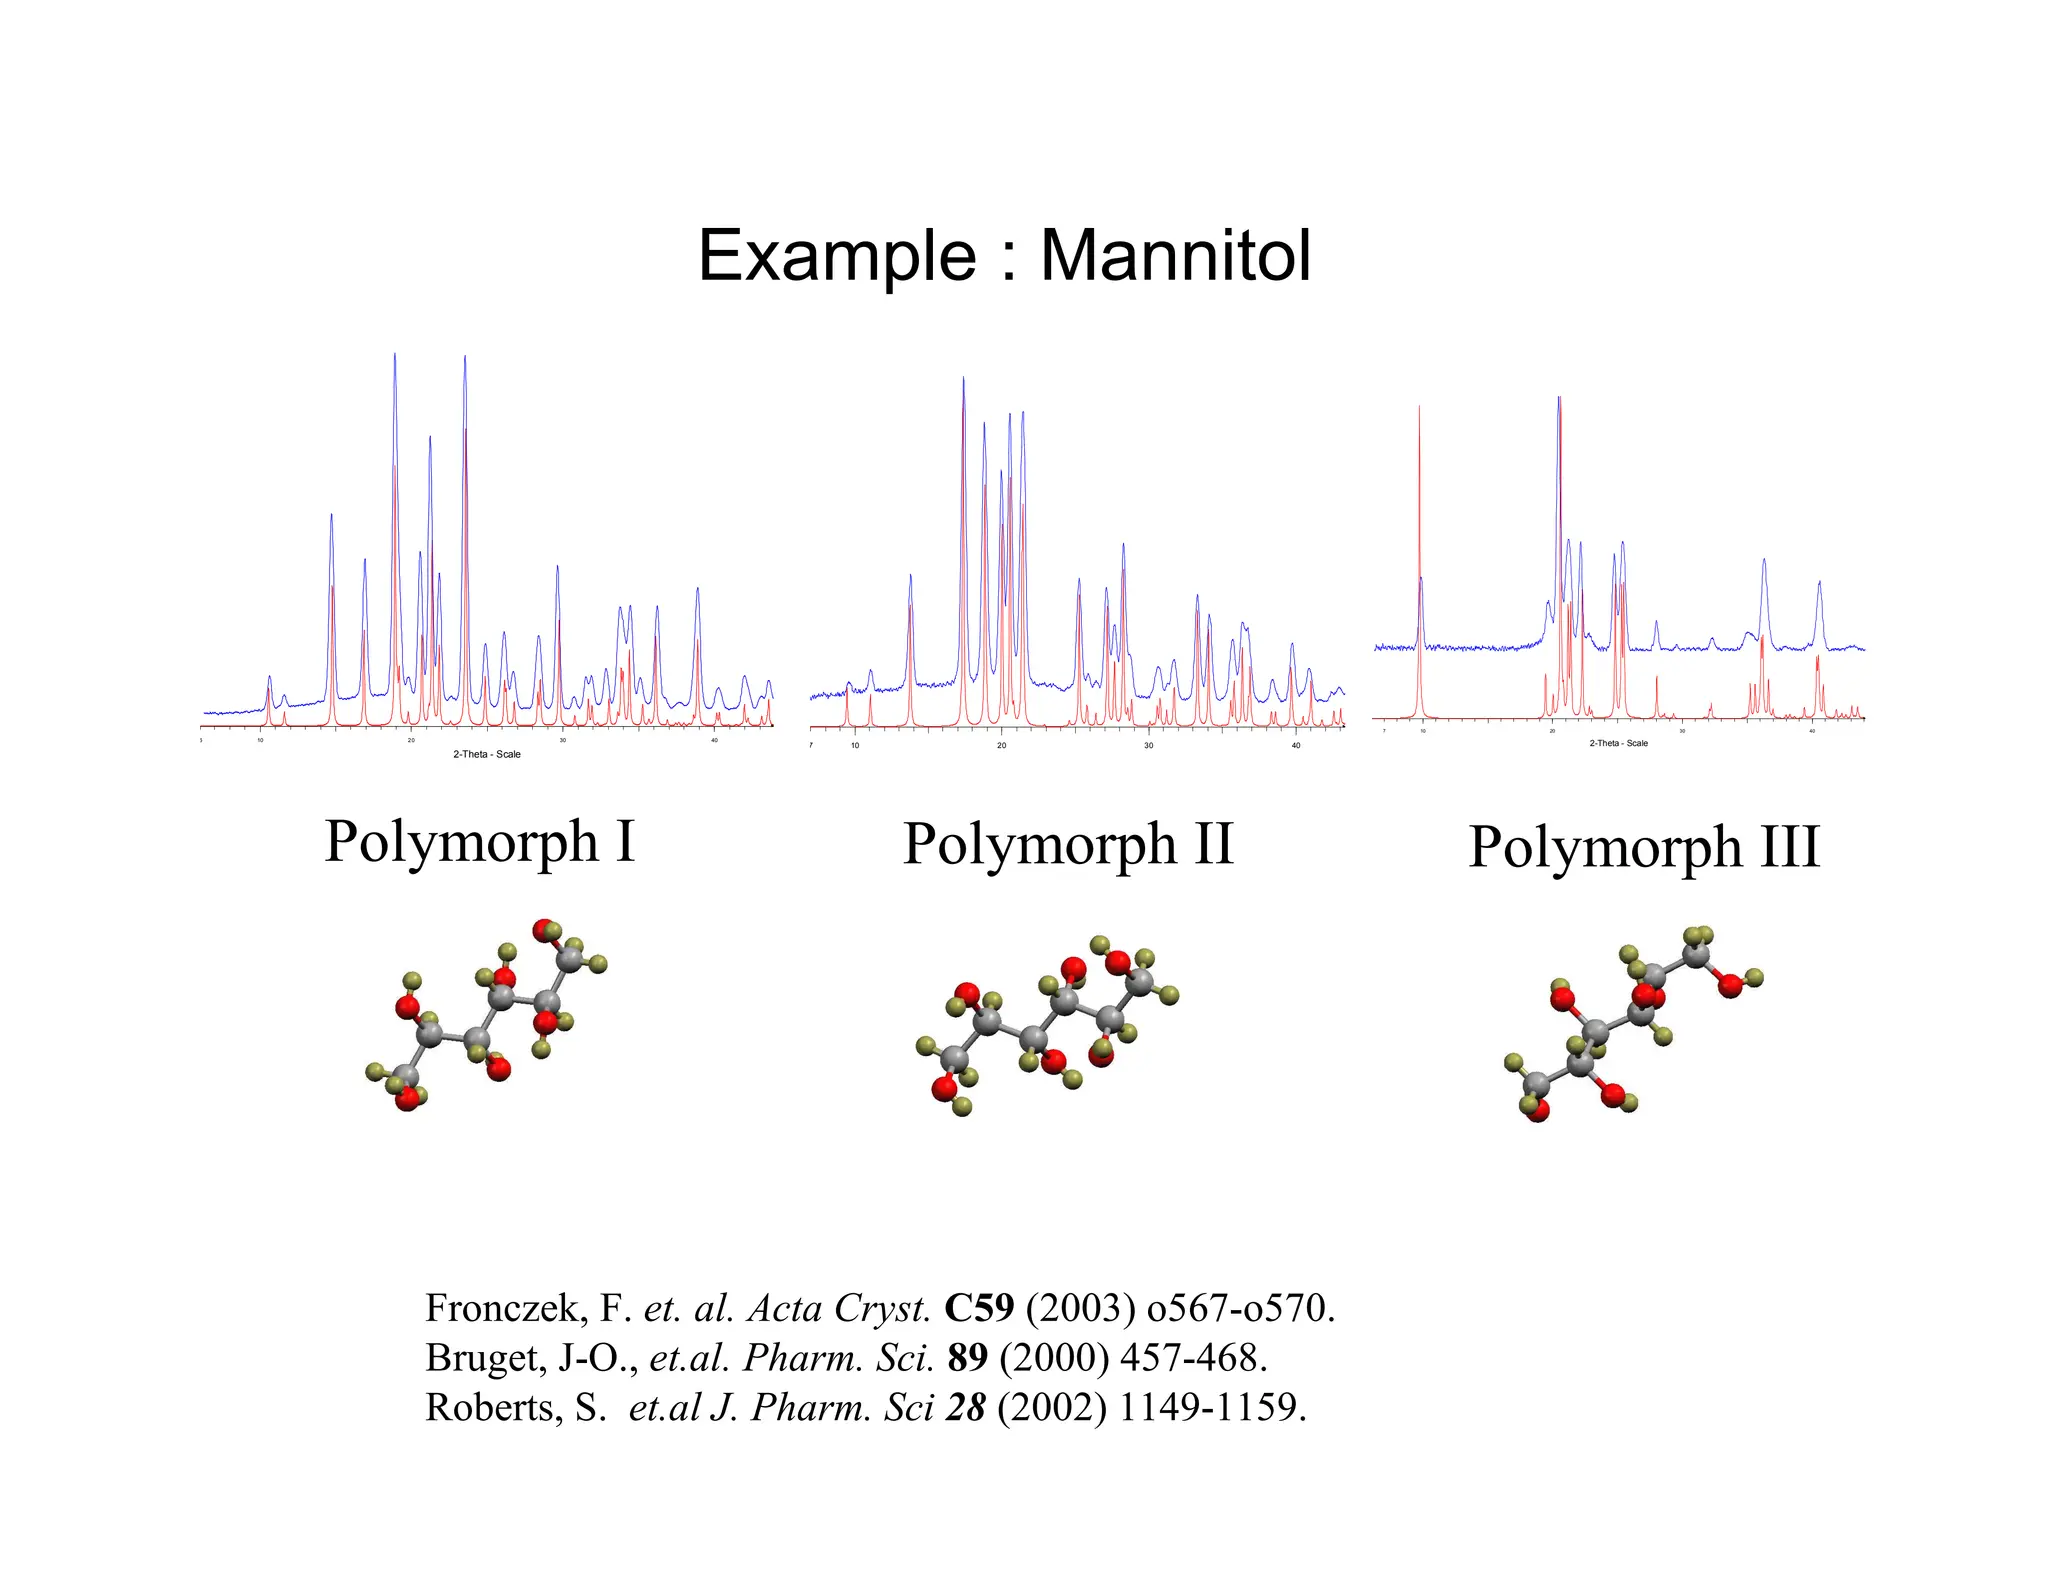
Example : Mannitol
710 20 30 40
Polymorph I
2-Theta - Scale
6 10 20 30 40
Polymorph II
2-Theta - Scale
7 10 20 30 40
Polymorph III
Fronczek, F. et. al. Acta Cryst. C59 (2003) o567-o570.
Bruget, J-O., et.al. Pharm. Sci. 89 (2000) 457-468.
Roberts, S. et.al J. Pharm. Sci 28 (2002) 1149-1159.
36.
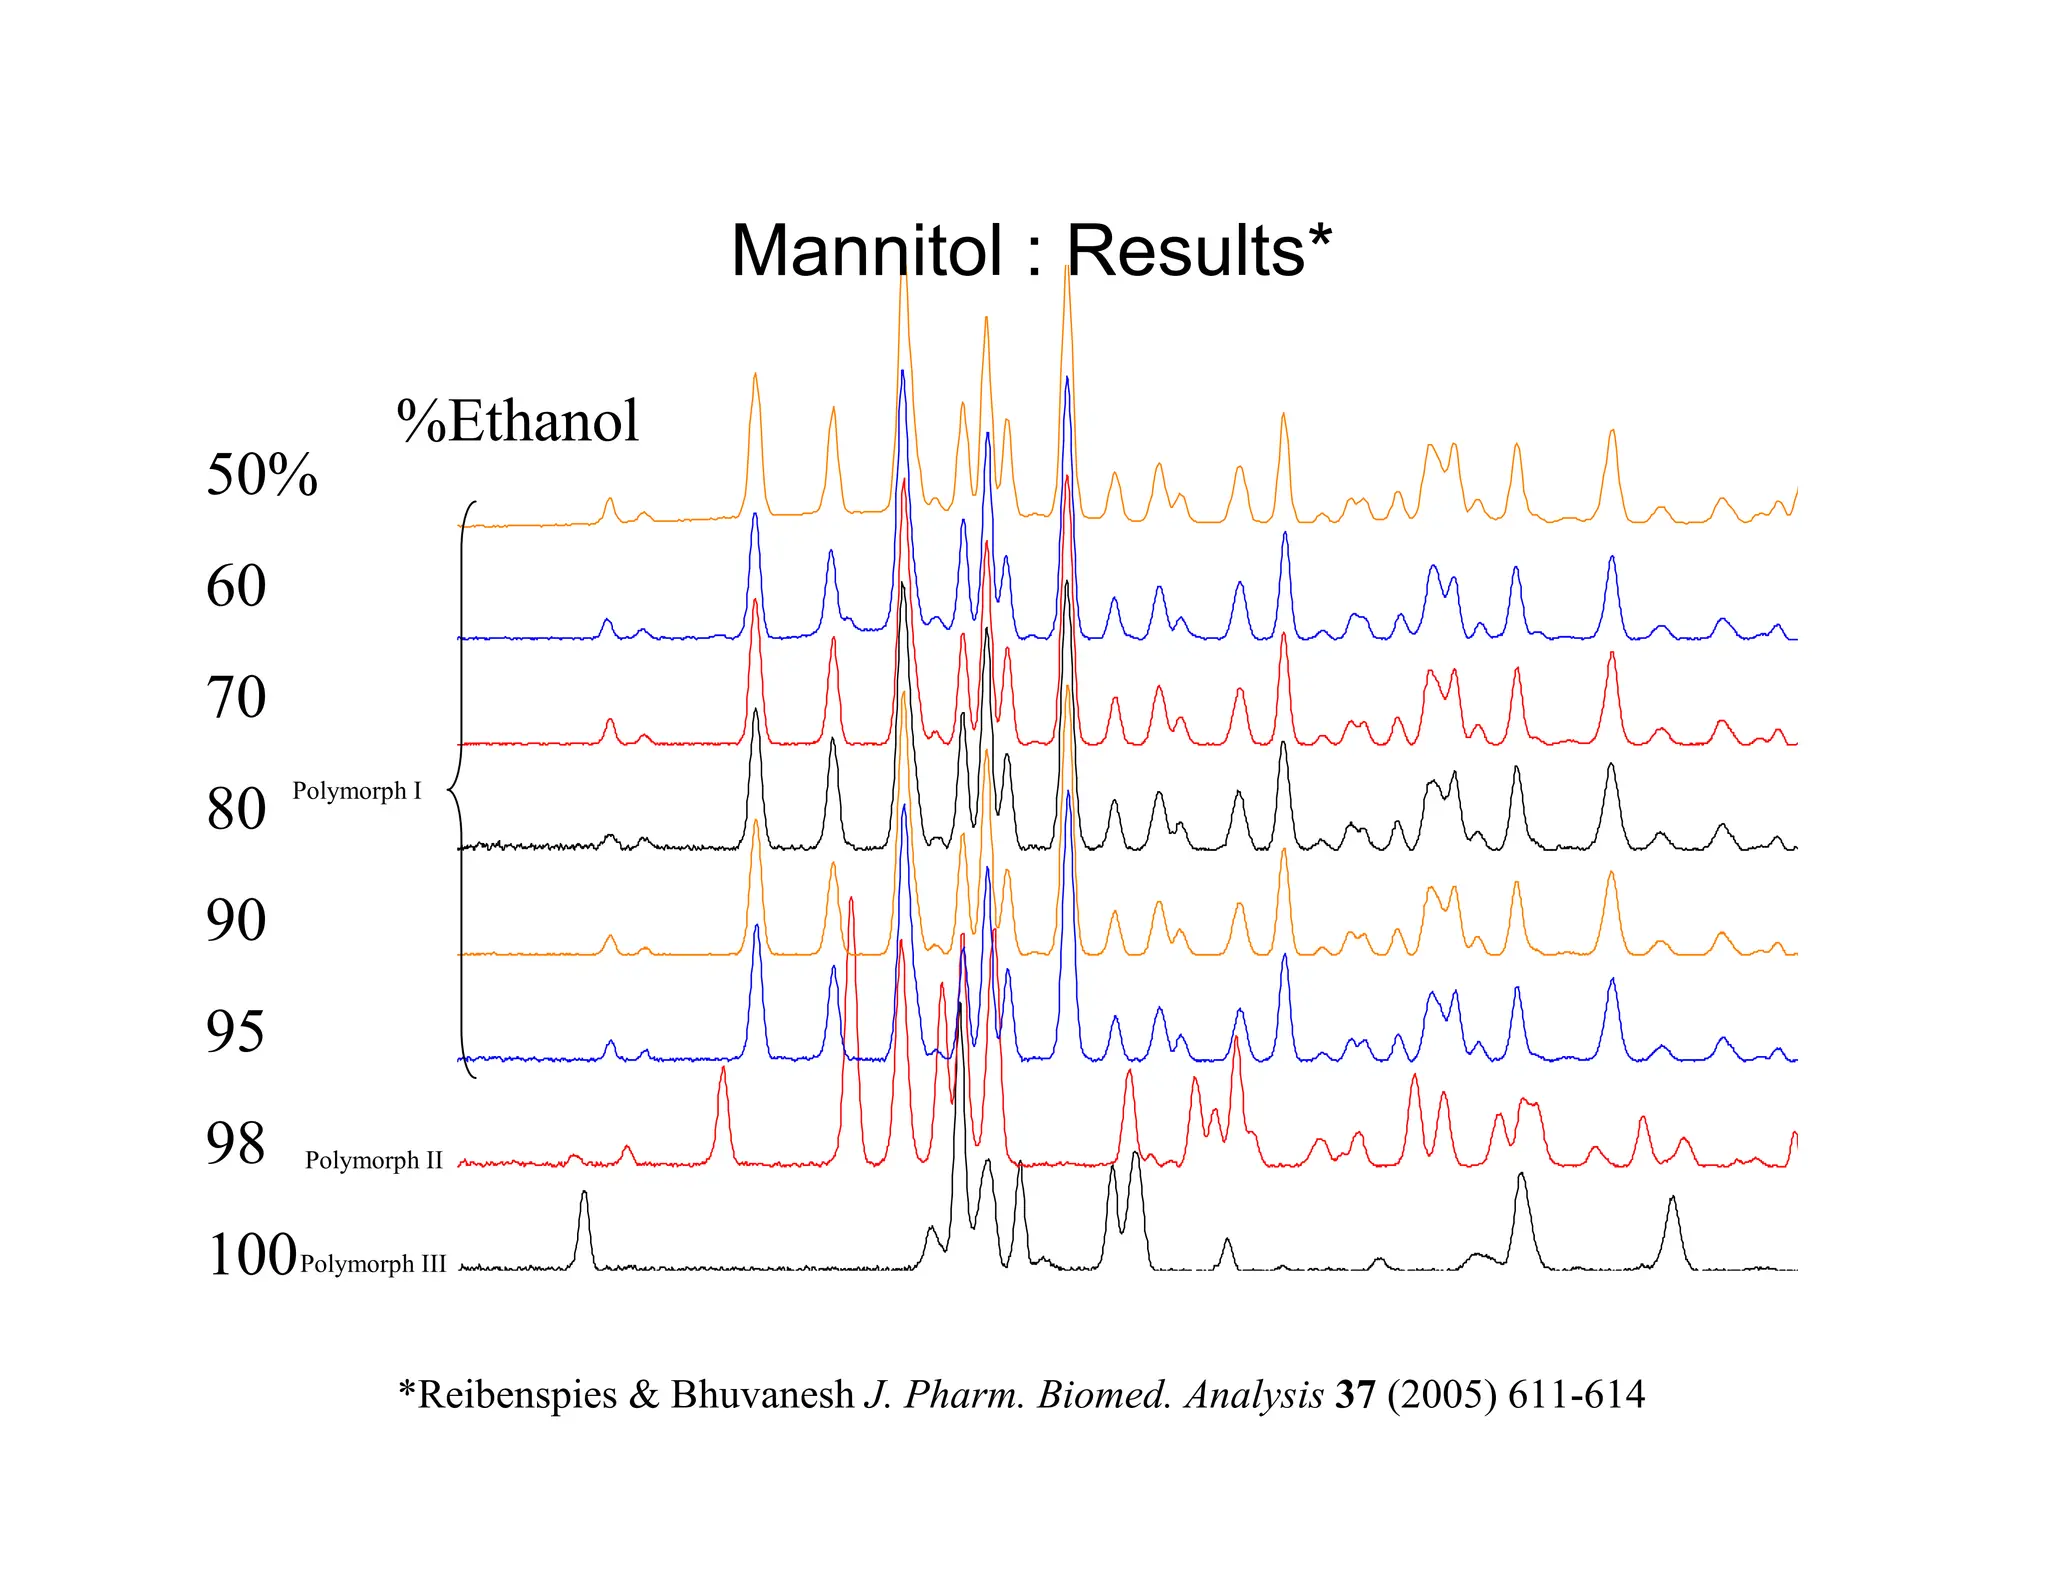
100 98 9590%
80 70 60 50%
Evaporation
Spot plate evaporation method
A saturated solution of D-Mannitol in ethanol and water is prepared
well EtOH/H2O well EtOH/H2O
1 100/0 5 8/2
2 50/1 6 7/3
3 20/1 7 6/4
4 9/1 8 5/5
mount
Evaporation from a binary mixture of solvents*
Reibenspies Bhuvanesh J. Pharm. Biomed. Analysis 37 (2005) 611-614
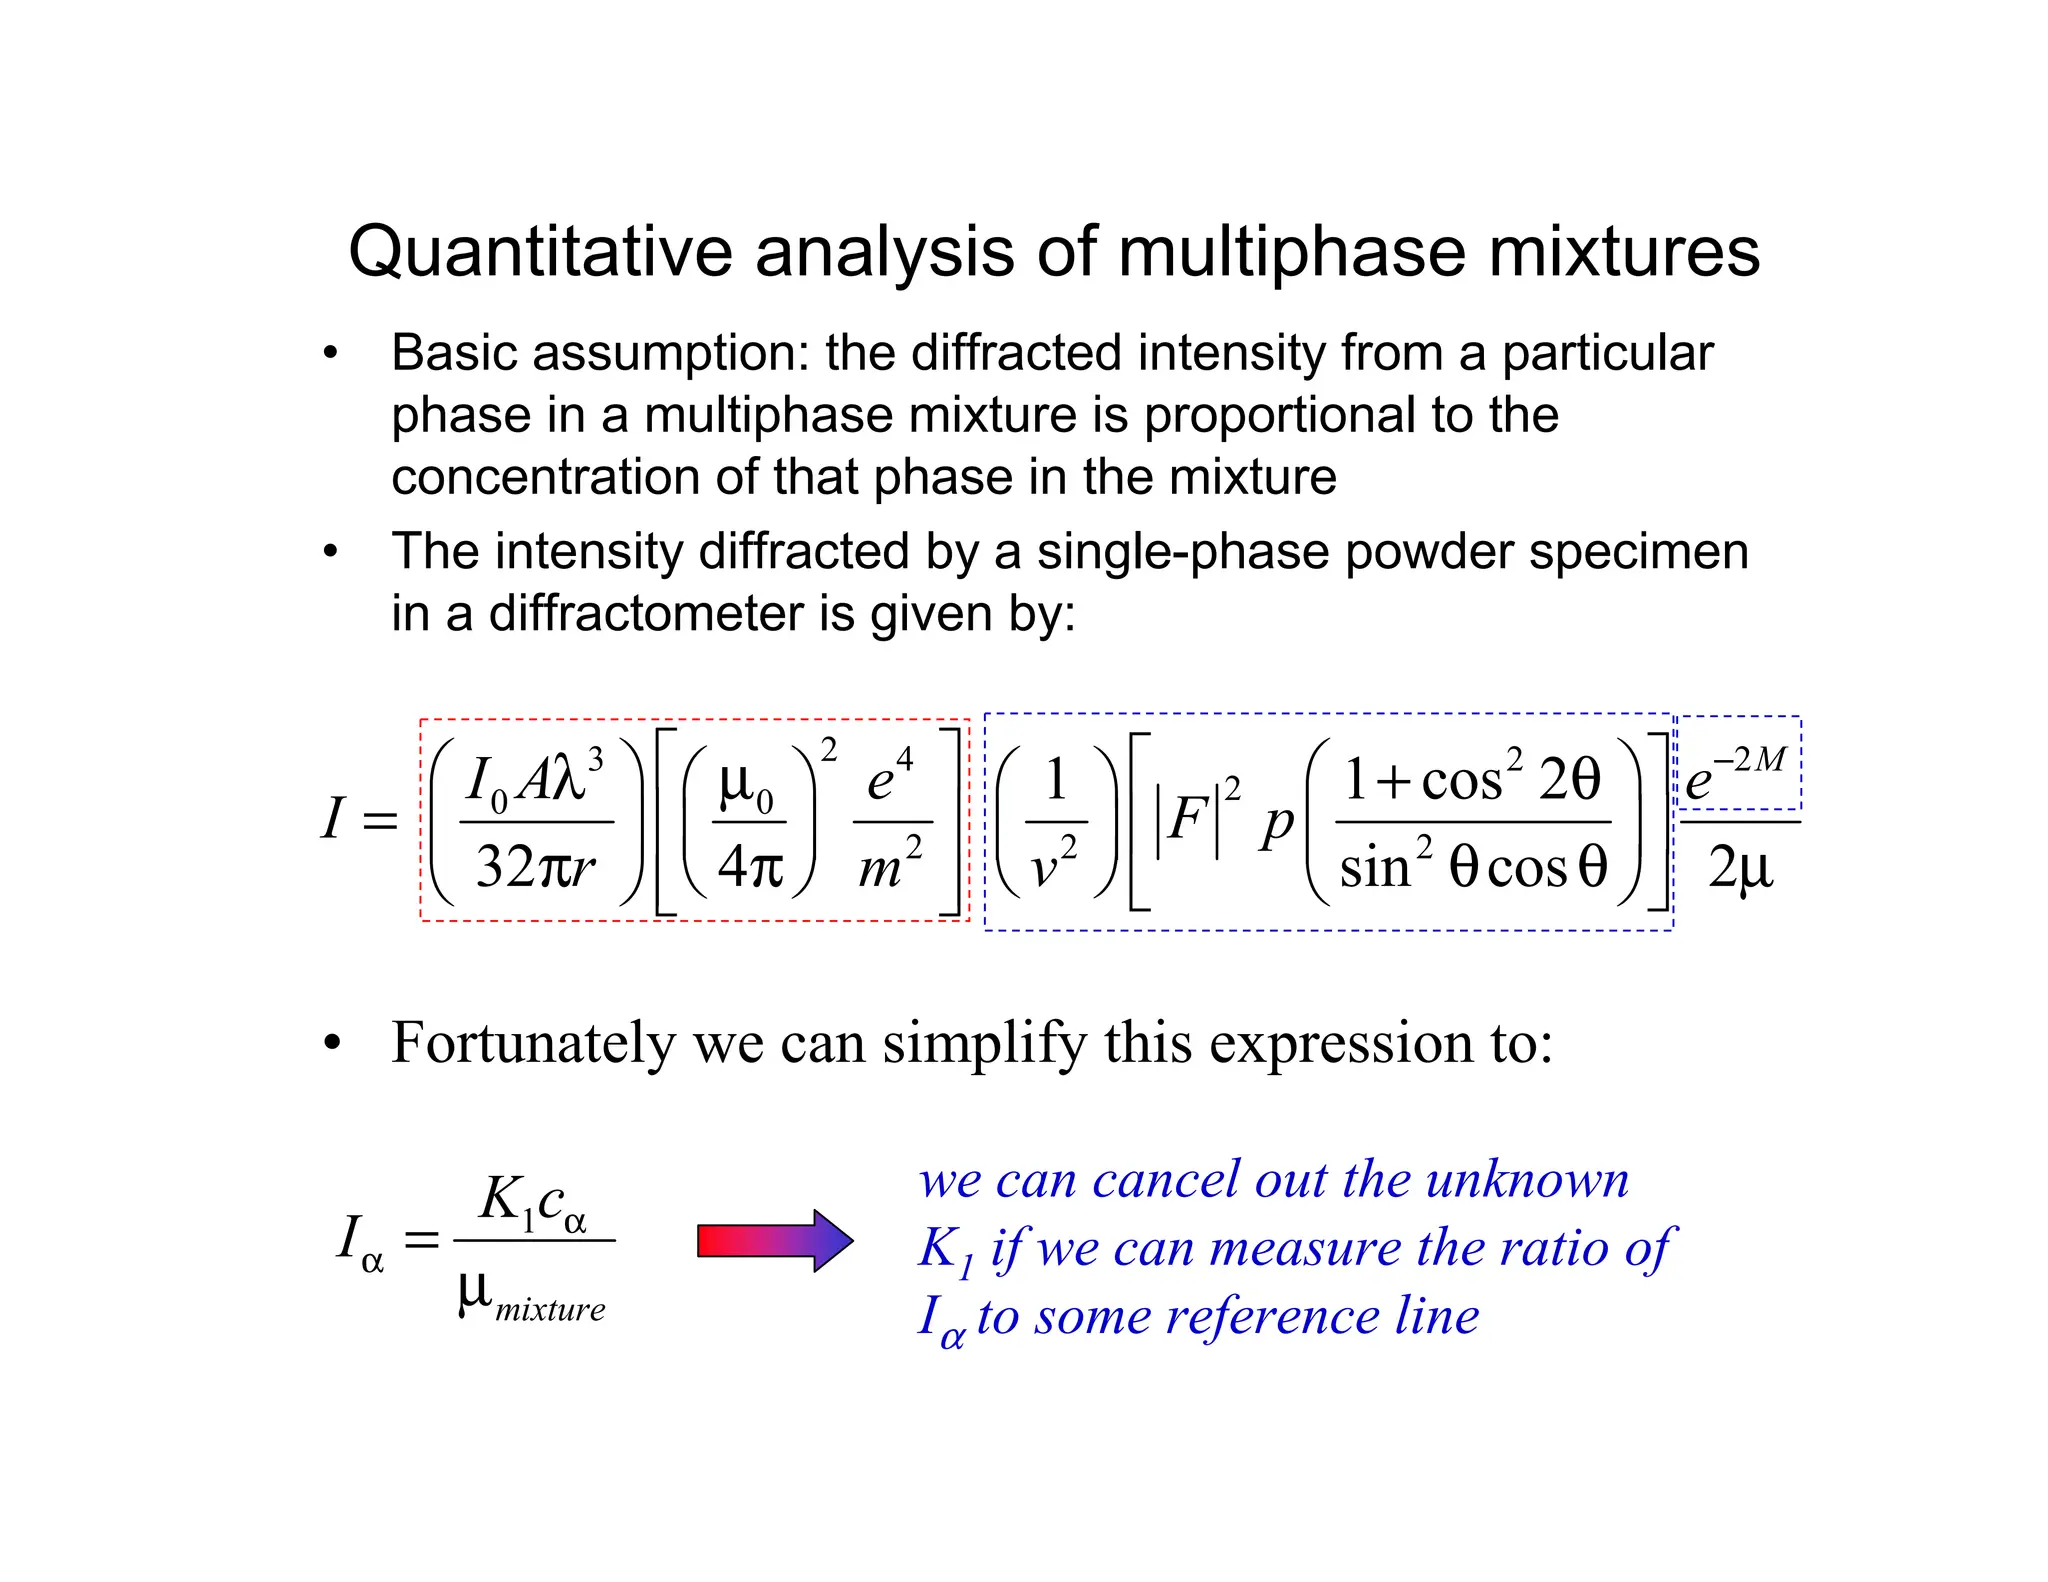
Quantitative analysis ofmultiphase mixtures
• Basic assumption: the diffracted intensity from a particular
phase in a multiphase mixture is proportional to the
concentration of that phase in the mixture
• The intensity diffracted by a single-phase powder specimen
in a diffractometer is given by:
2
3 4 2 2
2
0 0
2 2 2
1 1 cos 2
32 4 sin cos 2
M
I A e e
I F p
r m v
−
λ µ + θ
=
π π θ θ µ
• Fortunately we can simplify this expression to:
1
mixture
K c
I α
α =
µ
we can cancel out the unknown
K1 if we can measure the ratio of
Iα to some reference line
40.
Methods for quantitativephase analyses
• External standard method – compare the
experimental line intensity from the mixture to a line
from a pure phase
• Direct comparison method – compare the
experimental line intensity from the mixture to a line
from another phase in the mixture
• Internal standard method – compare the
experimental line intensity from the mixture to a
foreign material mixed with the sample
41.
Internal standard method
•A diffraction peak from the phase
(whose volume fraction is being
determined) is compared with a
peak from a standard substance
(thus restricted to powders)
3
m
K c
I α
α
′
= =
µ
4 S
S
m
K c
I = =
µ
intensity from phase a
(cα = conc. before the
addition of standard
intensity from one
line of the standard
Dividing we get:
3
4
S S
I K c
I K c
α α
′
=
• This method can be extended to multi-component mixtures
• By mixing known concentrations of phase α and a constant
concentration of a suitable standard and measuring the
ratio Iα/IS we can establish a calibration curve for
measuring α in an unknown specimen
α
α
I
I
K
c
c s
s
'
=
42.
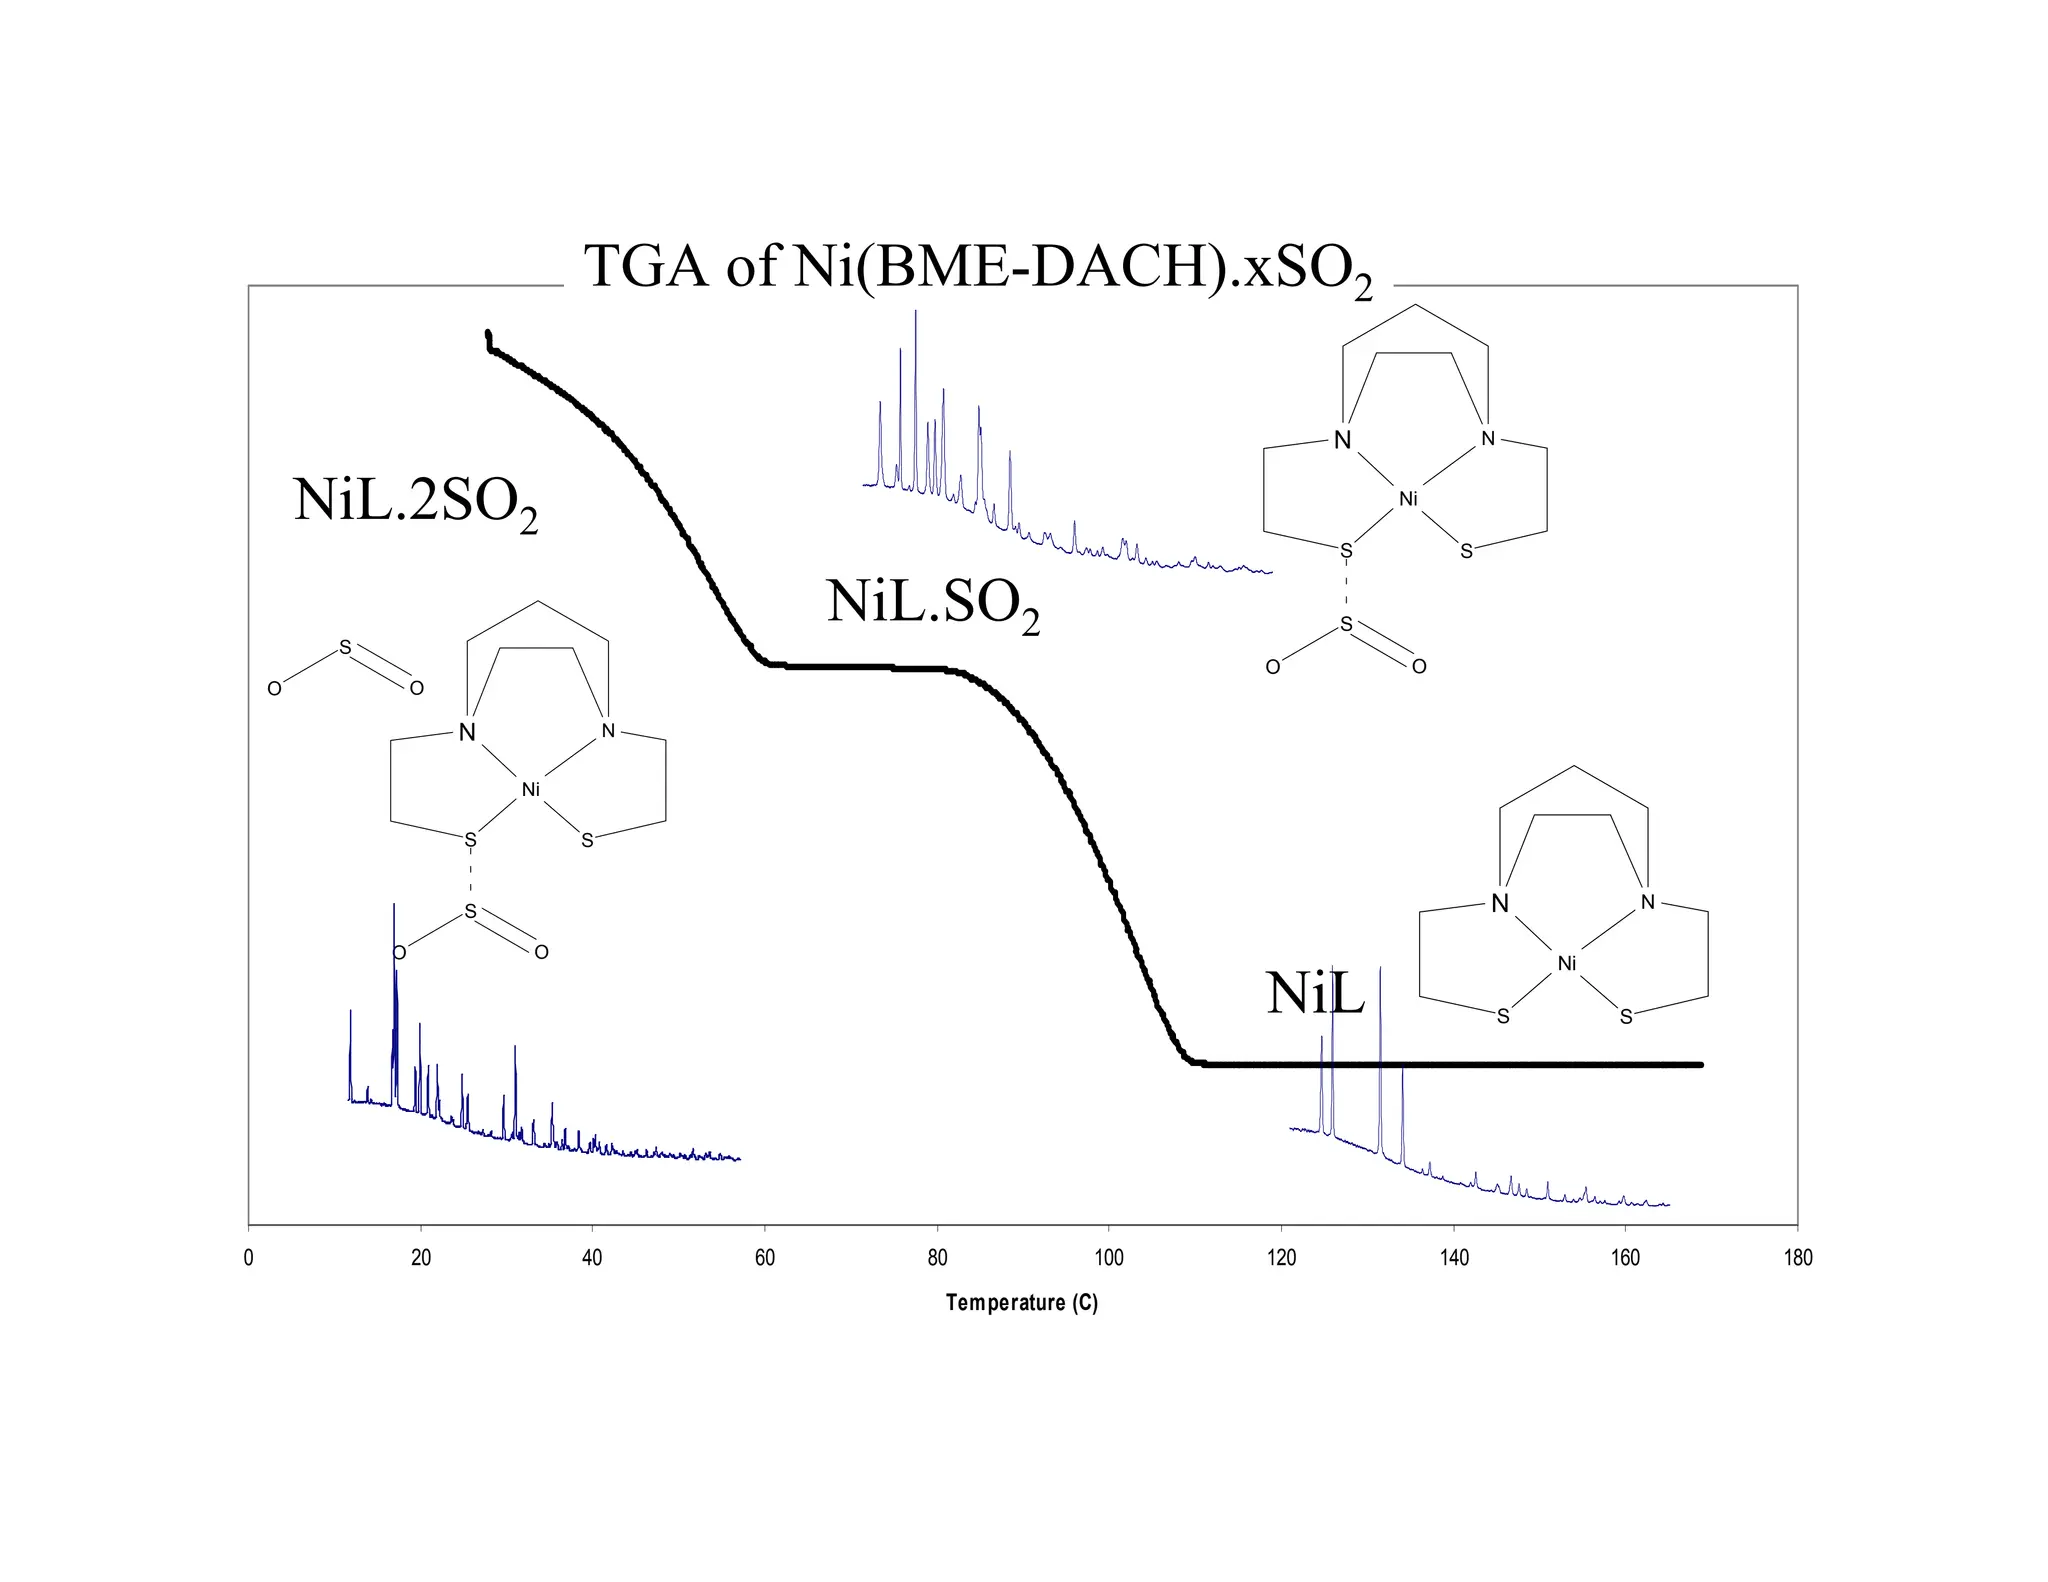
In-Situ Example
Reaction ofSO2 with Ni(BME-DACH)*
N
N
Ni
S
S
Ni(BME-DACH)
N
N
Ni
S
S
O
S
O
O
S
O
+SO2
*M. Darensbourg et.al. (2004) Inorg. Chem. Accepted for publication
BROWN
SOLID
ORANGE
SOLID
XXkBAR
43.
0 20 4060 80 100 120 140 160 180
Temperature (C)
NiL.2SO2
N
N
Ni
S
S
O
S
O
O
S
O
NiL.SO2
N
N
Ni
S
S
O
S
O
NiL
N
N
Ni
S
S
TGA of Ni(BME-DACH).xSO2
44.
Effusion of SO2: Ni(BME-DACH).2SO2
16 hr
NiL.1SO2 NiL
APS : Room Temperature in air
First 30mins
NiL.2SO2 NiL.1SO2
-0.0010
-0.0008
-0.0006
-0.0004
-0.0002
0.0000
Weight
Loss
0 500 1000 1500 2000 2500 3000 3500
Time (secs)
45.
Dynamic X-ray PowderDiffraction
6 hour experiment. Ni(BME-DACH) 2SO2
• Conditions
• Starting material :
• Ni(BME-DACH) 2SO2
• Temp. 300K (Oxford)
• Dry Nitrogen Flow (20 l/min)
• Fine particles ( 5 microns)
• ~ 100 µgrams
• nylon loop
• no grease or oil
• data collected every 4 mins
• experiment : 6 hours
2SO2
1SO2
100 -111
010 001