1. To: PepsiCo Manager
From: Group 1
Date: 17 March 2016
Subject: Marketing Metrics
Skill Builder 5
1. Strategy, Metrics & Performance
PepsiCo’s core marketing strategy is focused on pairing togetherbeverages and snacks.This is due to the
complementary relationship between the two products,as research suggests customers have a tendency to purchase
salty snacks and beverages during the same transaction.PepsiCo views this strategy as viable because beverages are
responsible for their current prosperity while snack items are capable for future growth.
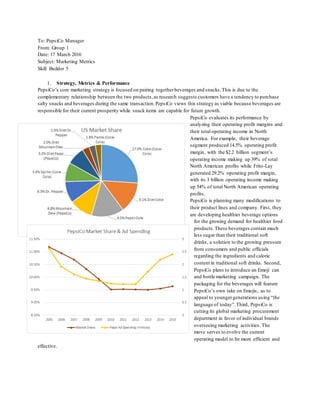
PepsiCo evaluates its performance by
analyzing their operating profit margins and
their total operating income in North
America. For example, their beverage
segment produced 14.5% operating profit
margin, with the $2.2 billion segment’s
operating income making up 39% of total
North American profits while Frito-Lay
generated 29.2% operating profit margin,
with its 3 billion operating income making
up 54% of total North American operating
profits.
PepsiCo is planning many modifications to
their product lines and company. First, they
are developing healthier beverage options
for the growing demand for healthier food
products.These beverages contain much
less sugar than their traditional soft
drinks, a solution to the growing pressure
from consumers and public officials
regarding the ingredients and calorie
content in traditional soft drinks. Second,
PepsiCo plans to introduce an Emoji can
and bottle marketing campaign. The
packaging for the beverages will feature
PepsiCo’s own take on Emojis, as to
appeal to youngergenerations using “the
language of today”.Third, PepsiCo is
cutting its global marketing procurement
department in favor of individual brands
overseeing marketing activities. The
move serves to evolve the current
operating model to be more efficient and
effective.
2. 2. Industry Forecasting
If the U.S. per capita
consumption of CSD falls
to 700 eight-ounce servings
in 2016, the CSD market
potential would be 9.4
billion cases.An increase of
6.7% from 2015. This
potential increase could be
from an increase in
marketing. After careful
analysis of the forecasted
trendline, the future of
carbonated soft drinks is a
little confusing. The trend
has decreased steadily year
by year and but has
potential for market
volume. The predicted
forecast is to keep steadily declining into 2017. The reason for the continued decline is perhaps directly correlated
with the rise of health conscious consumers who want a healthier option than a carbonated soft drink.
3. Understanding Proposed Marketing Strategies
PepsiCo Income Statement
Sales 63.05B % of Sales
100%
Industry
Average
Ratio %
Cost of Good Sold 28.38B 45.2% 64.9%
Gross Margin 34.67B 54.8% 35.1%
Selling & Administrative
Expenses
24.88B 39% 20.4%
Non-Operating Expenses 1.43B 0.2% -
Operating Income 8.35B 15.8% 1.9%
3. Contribution Income Statement:
Contribution Income Statement for 2015
Sales………………………………………………………………………………………………………..$63,056,000
Less: Variable Cost of Revenue…………………………………………………….…….$28,384,000
Variable SG&A …………………………………………………………………….$8,709,750
Contribution
Margin..…………………………...……………………………………………………….....$25,962,250
Less: Fixed Costs…………………………………………………………..……………..$1,434,000
Fixed SG&A………………………………………………………………………..$16,175,250
Net Income……..…………..………………………………………………………..…………...........…….$8,353,000
Contribution Margin = $25,962,250 = 41.1%
Sales $63,056,000
Since the Contribution Margin Ratio is 41.1% this means that for every $1.00 PepsiCo Earns they are paying $0.41
in expenses.
If Pepsi’s 2016 profit (operating income) object is set at $10 billion, what would be the new target sales?
New target sales, considering ratios stay the same, would be 63.33 billion dollars for 2016. This would yield the 10
billion dollar profit objective.
If Pepsi increased advertising an additional $300 million to improve its image, what would target sales have to be in
order to meet its $10 billion profit objective?
Increasing advertising should generate an increase in sales due to added exposure.
An additional 300 million in advertising would create a profit of 123 million profit and total sales would need to
reach 63.507 billion to cover the additional cost of advertising.
If Pepsi Introduced Pepsi True, which increases Research and Development by $20 Million and Marketing’s fixed
costs for free samples by $10 Million, then in order to reach a new Target Sales of $10 Billion Pepsi would need 67
million target profit.