Call Girls Siliguri Just Call 9907093804 Top Class Call Girl Service Available
Simudyne rwjf aligning forces to generate data challenge
1. RWJF Aligning Forces to Generate Data Challenge
Simudyne USA, Inc.
A Beautiful Day (in The Neighborhood)
This document contains the submission of Simudyne USA, Inc. for the Robert Wood Johnson Aligning
Forces Games to Generate Data Challenge, Phase I.
A. Summary and Overview
A Beautiful Day is an interactive, community-focused program that provides a new and exciting way for
people to engage with and discover their local community while building awareness about health issues.
The program consists of an application for mobile devices where users can access information about
their community, provide updates about their personal health and well-being, and record observations
and perceptions. This information is geo-coded and time-stamped and can be visualized at a
neighborhood and city level either by website or mobile. Users will also receive active alerts and
messages regarding health, weather or safety as well as suggestions for actions/activities based on
analysis of the data they report and data on their environment.
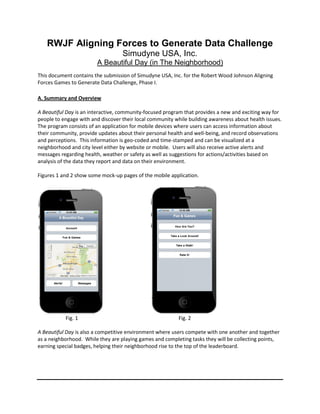
Figures 1 and 2 show some mock-up pages of the mobile application.
Fig. 1 Fig. 2
A Beautiful Day is also a competitive environment where users compete with one another and together
as a neighborhood. While they are playing games and completing tasks they will be collecting points,
earning special badges, helping their neighborhood rise to the top of the leaderboard.
2. This initial rollout would be for a given city such as Albuquerque, N.M., which is divided into ~30
neighborhoods (or communities). Each user would identify his or her community for the purposes of
aggregating observations/activities, as well as information provided to the user (see figures 3 & 4).
Area Neighborhood
10 Sandia Heights
20 North Albuquerque
Acre
21 Albuquerque Acres
West
30 Far Northeast Heights
31 Foothills North
32 Academy West
40 UNM
41 Uptown
42 UNM South
50 Northeast Heights
51 Foothills South
60 Four Hills Village
70 Fairgrounds
71 Southeast Heights
80 Downtown
90 Near South Valley
91 Valley Farms
92 Southwest Heights
93 Pajarito
Fig. 3 Fig. 4
Output Data
The most exciting feature of the program is the data that is produced by participants. We’ll get brand
new data streams that have not been aggregated in the same way before. As they participate the
community of users will help generate data across the following categories:
Personal (including mental and physical sentiment, with provisions for user privacy)
Observations of healthy (or unhealthy) activities
User activities (such as walking, going to the park, etc.)
Ratings info for health-related locations (parks, clinics, etc.)
One of the unique advantages of this data is that all personal and observational data will be geo-coded
and time stamped. Not only can we (and users) track and visualize changes over time but we will also be
able to mine and analyze the data in conjunction with other data sources to increase the value upstream
to AF4Q.
For example, imagine Fred reports feeling tired and depressed on a certain day while also reporting in
the previous week that the park across the street from his house is unkempt and not a good place for
exercise or families. He also has not been walking and we find from outside data that the weather was
cold and rainy that week and the park has a history of arrests for petty crimes. We can begin to draw
inferences about specific aspects of an environment and how that changes over time. We can also
begin to tease out which aspects of his environment, behavior and attitude are the most influential
Page 2 of 8
3. drivers of individual and community health. This type of information can be made available to
community leaders (aggregated data, not individual data).
Part of this interactivity is more specialized. Using rules-based algorithms that draw on existing health
and wellness standards, users will receive suggestions for activities. Imagine Fred has not left home for
three days; he might receive a suggestion to take a walk and find a park nearby, or to participate in a
community event (that is linked to for more information). Likewise if it has been raining for three days
and the forecast is for two days of sunny weather then all users in the area might receive a suggestion to
get outside and enjoy one of several community events going on during those two days.
The following sections detail the specifics of the software, data inputs and outputs (including data
warehousing) and our community rollout strategy.
B. Software Description
The program consists of two applications: one is server-hosted that can be accessed via web browser
(on desktop, laptop, or tablet) and the other is a mobile device application (iPhone, Android or Windows
phone). Each is linked to a common data warehouse where user and external data is stored and
accessed. The intention is for the mobile application to be the primary interface for users while the web
application is primarily used for data visualization and access.
Mobile application
The primary means of engaging with A Beautiful Day is through an application on the user’s handheld
mobile device. The mobile app consists of a simple interface and four feature areas that can be
accessed from the start page.
Account
The account feature provides access to basic account information (name, email, address, etc.) that can
be reviewed and updated. The user’s current points and badge collection is also accessible.
Fun & Games
This feature section includes the core activities of the program which are organized into four specific
areas:
“How are you?” – A simple “pulse” taking to record health and mental state
Mental health – optimistic , happy, neutral, sad, anxious, depressed
Physical health – strong, average , sick, feeling tired/weak
“Look around…” – Scrolling list of observable events, grouped into:
“Good” – people walking dogs, jogging, family biking, skaters wearing helmets, motorcyclists w/
helmets. The “good” events can be generated on a BINGO card, with a “BINGO” leading to a
BINGO Badge.
Bad – people smoking, skaters w/o helmet, motorcyclists w/o helmet, etc. “Bad” observations
are not on BINGO card, they are just counted.
“Exercise/Take a Walk!” – players log activity and access useful data
Page 3 of 8
4. Log walk/run path
Log distance, time
Provide access to other uploaded running/walking routes
“Rate it!” – players subjectively evaluate locations within their local community for cleanliness, ease
of finding/parking, kid-friendly, etc.
Parks – rate for children, adult-exercise, adult-non exercise, picnics, etc.
Bike/walk paths
Schools with playgrounds accessible outside of school time
Health-related businesses (gyms, clinics, dr’s offices), with special offers
Alerts
The Alerts feature provides updates from external data sources regarding locally relevant alerts or
notices. Weather, health, traffic, and criminal alerts would all be sourced directly from the relevant data
providers and relayed to users as soon as they appear in the database. Some of these items would be
‘real-time’ but some would be delayed based on the rate of information update at the source.
Messages
The message section differs slightly from Alerts in that these communications are not as critical in
nature. Users receive messages that are personalized for them individually or are targeted at their
neighborhood based on a combination of personal and external data. For example, Jan may receive a
recommendation to visit a certain park that is 4 miles away if she records talking several 2-3 mile walks.
Data Visualization
Users can access both user-generated data and outside data in numerous ways. The central data
visualization interface is a map of Albuquerque and its neighborhoods. Aggregate data will be shown
using color-coded choropleths maps as discussed earlier. More specific data will be tied to specific
locations. There are three types of data that are accessible:
Basic health, safety, crime, weather and community event data from input sources including:
AF4Q Hospital and Medical Data, County Health Rankings (raw % data), CrimeMapping.com
criminal activity plots, Weather.com data, CDC data, Traffic data (Sigalert.com)
User-generated data: Patterns of mental and physical health quality, good/bad behaviors, scores
for “Rate It” locations, Location of good/bad behaviors
Leaderboards: Individual leaderboard, points leaders by Neighborhood and City, badges leaders
by Neighborhood and City, neighborhood leaderboard
Players
Individuals living in any of the identified neighborhoods in Albuquerque, NM and 18 years or older are
eligible to participate.
Points
Points are awarded for participating in the core activities on an ongoing basis. More involved activities
(such as logging and uploading a walking/jogging path) receive more points.
Page 4 of 8
5. Badges
There are several badges that are awarded to players when they cross a threshold of activity or do
something for the first time. Each activity area will have custom badges tied to activity and
achievement. For example, separate badges for “First Jog” and “10th Jog” are available for earning.
Neighborhood Badges
Badges awarded to every member of a Neighborhood when the cumulative activity of that
Neighborhood crosses a threshold (such as 100 community members have visited a certain park).
C. Data Inputs, Generation, Storage, Visualization and Outputs
Through both the Web Browser Application and the Mobile Application, the users will be able to access
and view data from AF4Q relevant to their community. For example, hospital and medical data can be
tied to the items identified on the map. In addition, an overlay display (or “heads-up display”) can be
used to display County Health Rankings and/or community-level data from the CDC.
Map overlays (or layers) can include other health-related data available from other sources such as from
crimemapping.com or pollen.com. Other layers can also be made available, such as traffic, weather, and
community events.
Data Generation by Feature
Through both the Web Browser Application and the Mobile Application, we will collect the following
user-generated information.
Account and User Information
Beautiful Day is not interested in an individual’s data, and this will be made clear in the privacy-oriented
communications. No identifying information for an individual will be directly recorded. However, basic
demographics, level of use, activities, etc. will be collected for aggregated use.
Aggregated data will be used to generate data for the community, including normalized data. For
example, we know a population of a community, number of users on A Beautiful Day, and the level of
activity for the users. We can generate normalized statistics for the level of activity for the population
(after generating a certain amount of data, accounting for margin of error, etc.).
Sentiment Data
From the entries made in the “How Are You?” section, Beautiful Day will record user-generated
sentiment data. This will cover mental and physical aspects. As with account information, A Beautiful
Day will not retain long-term data from individuals; instead the data will be captured with anonymous
information, but still geocoded (if enabled) and also have other meta data (such as date, time, perhaps
tied to other activities of individuals). This level of data will be used to generate community-level data
and cross-correlated data (for example, is there a link between weather, pollen count, availability of
green space, etc. with mental health?).
Page 5 of 8
6. User Observation Data and Activity Data
Data about what users have observed (for example: joggers, bicyclers without helmets) and user
activities (such as exercise, walking) will be tracked along with geocoding (if enabled) along with other
meta data (date, time, etc.). The accumulation of these observations (for individuals and communities)
will be the basis for some of the individual or community badges.
Rate It Data
User-generated data to rate locations (such as parks, doctor’s offices, health services) will be tracked
along with geocoding (if enabled) along with other meta data (date, time, etc.). In addition to simple
rating data (out of a 5-point scale), user-generated descriptions will also be captured (similar to
yelp.com, amazon.com).
Data Storage
There are several options for storing and managing the data collected. First, A Beautiful Day will adhere
to a strict and clear set of policies regarding the capture and use of personal information. While details
should be developed with all the relevant stakeholders (including privacy experts, user advocacy group,
technical experts, program sponsors, etc.), no personally identifiable information will be tracked in the
Beautiful Day databases (with exceptions for geocoding the user-generated information).
There are several components of the data warehouse and slightly different requirements data
management. When available, the external data provided through Beautiful Day can be made directly
available through xml/rss feeds and other similar calls. For technical latency, legal, or other reasons, we
may instead collect and prepare the external data into the Beautiful Day database for ease of
consumption to the users.
Data collected from users (account information and user-generated data) will be retained in the
Beautiful Day Database with the appropriate level of security to accommodate the privacy policies.
Visualization
Most of the external data will be made available either on the maps (as layers) or as an overlay (or pop-
up) using rich and visually captivating interactive formats. For example, simple time series data to show
level of activity can be accessed via Streamgraph (Figure 5) while geographically arranged data is
visualized well with a Choropleth (maps that use color and shading to show comparative values of data;
see NYC example on Figure 6).
Fig. 5 Fig. 6
Page 6 of 8
7. There are also map interfaces that allow for pinpointing of information, such as is seen in this map of
Albuquerque that identifies every reported crime in the city between Feb 14, 2013 and Feb 20, 20131.
Fig. 7
The same technology principle will be used to map specific locations of observed behaviors, self-
reported wellness and moods, and recorded ratings. External data sources (such as the data from the
CrimeMapping program, AF4Q data, County Health Rankings, Weather.com, CDC) can also be displayed
using this map overlay interface (where appropriate).
Outputs
Part of the Beautiful Day planning and rollout will include working with the program sponsors to define
the output data model.
D. Community Deployment Approach
For the submission and beta rollout of A Beautiful Day in the Neighborhood, we will focus on
Albuquerque, NM. The programs and approach we’ve outlined is scalable to the other AF4Q
Communities and need not be restricted to communities that are incorporated U.S. cities or
metropolitan areas.
1 Screenshot taken from www.crimemapping.com
Page 7 of 8
8. Deployment Goal
The objective of the deployment is to attract as many members in the target community as possible to
join and participate. We also want to do so in a way that doesn’t create unrealistic expectations and
result in high rates of drop-off and low levels of participation. The use of badges, neighborhood leader
boards, and cross-neighborhood rankings are meant to encourage activity and engagement.
Pre-launch PR
Before we officially launch the program we recommend engaging in a PR campaign in Albuquerque in
conjunction with RWJF, AF4Q, and engaged local partners in government, education and industry.
Employers that currently have robust employee health programs are excellent candidates for
partnership, as is the University of New Mexico.
Launch and Ongoing Recruitment
We suggest launching initially through a combination of methods. Email invitations will be devised and
mailed following list procurement. Social media channels will be utilized as well (tied to the PR
campaign). Users will be incentivized to recruit other members of their community (via specific Badge
and Points awards) and additional PR support is encouraged. Also, a series of badges can be related to
recruitment.
About Simudyne:
Simudyne builds software-based solutions for clients in energy, healthcare, finance, government, and hi-
tech industries. Our solutions cover Risk Management, Operational Effectiveness, and Market
Modeling. For more information, please visit simudyne.com.
Page 8 of 8