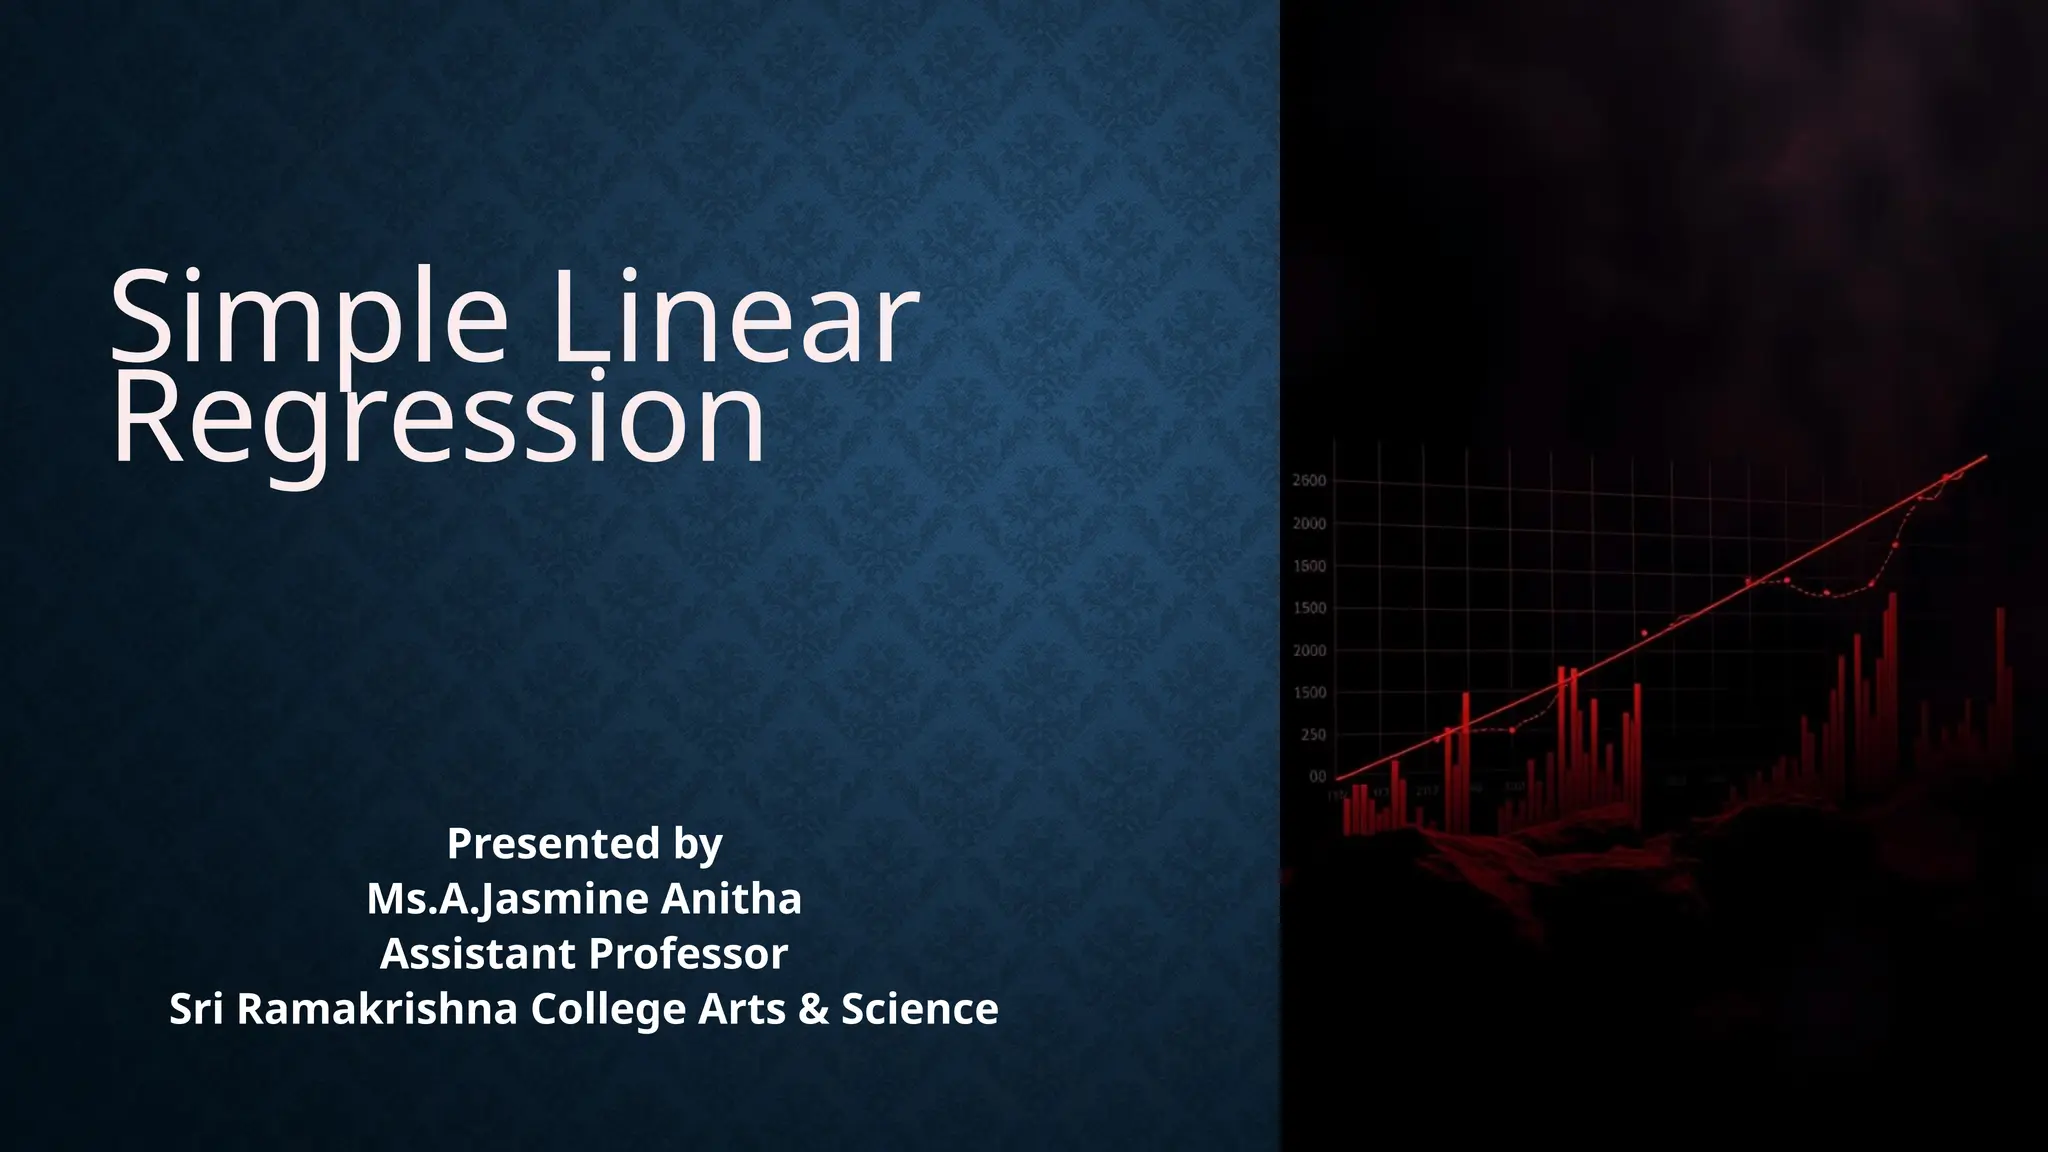
Recommended
PPTX
Simple Linear Regression explanation.pptx
PDF
Simple Linear Regression detail explanation.pdf
PDF
P G STAT 531 Lecture 10 Regression
PPTX
Introduction-to-Linear-Regression.pptx
PPTX
Regression-SIMPLE LINEAR (1).psssssssssptx
PPTX
PPTX
Regression of research methodlogyyy.pptx
PDF
Linear regression model in econometrics undergraduate
PPTX
Assumptions of Linear Regression in Linear Regression
PDF
Business statistics-ii-aarhus-bss
PPTX
simple and multiple linear Regression. (1).pptx
PDF
PPTX
Regression analysis in Research Methodology.pptx
PDF
PDF
PDF
Linear regression Word of the Week
PPTX
An Introduction to Regression Models: Linear and Logistic approaches
PPTX
Correlation and regression with Formulas and examples
PPTX
PPTX
Difference Between Regression and Correlation.pptx
PPTX
PPTX
Detail Study of the concept of Regression model.pptx
PPTX
STATISTICAL REGRESSION MODELS
PPTX
PPT
Regression.ppt basic introduction of regression with example
PPTX
6 the six uContinuous data analysis.pptx
PDF
Linear regression (1). spss analiisa statistik
PPT
PPTX
Liquidity Ratio in Financial Management.pptx
PPTX
Present and Future Value of an Annuity.pptx
More Related Content
PPTX
Simple Linear Regression explanation.pptx
PDF
Simple Linear Regression detail explanation.pdf
PDF
P G STAT 531 Lecture 10 Regression
PPTX
Introduction-to-Linear-Regression.pptx
PPTX
Regression-SIMPLE LINEAR (1).psssssssssptx
PPTX
PPTX
Regression of research methodlogyyy.pptx
PDF
Linear regression model in econometrics undergraduate
Similar to Simple Linear Regression.pptx inSPSS (Theory)
PPTX
Assumptions of Linear Regression in Linear Regression
PDF
Business statistics-ii-aarhus-bss
PPTX
simple and multiple linear Regression. (1).pptx
PDF
PPTX
Regression analysis in Research Methodology.pptx
PDF
PDF
PDF
Linear regression Word of the Week
PPTX
An Introduction to Regression Models: Linear and Logistic approaches
PPTX
Correlation and regression with Formulas and examples
PPTX
PPTX
Difference Between Regression and Correlation.pptx
PPTX
PPTX
Detail Study of the concept of Regression model.pptx
PPTX
STATISTICAL REGRESSION MODELS
PPTX
PPT
Regression.ppt basic introduction of regression with example
PPTX
6 the six uContinuous data analysis.pptx
PDF
Linear regression (1). spss analiisa statistik
PPT
More from JasmineAnithaA
PPTX
Liquidity Ratio in Financial Management.pptx
PPTX
Present and Future Value of an Annuity.pptx
PPTX
Difference Between Capital Markets and Money Markets.pptx
PPTX
Maximum Loss Method in Dissolution & Insolvency.pptx
PPTX
Accounting Treatment During Death of a Partner.pptx
PPTX
Stock-Reserve-A-Vital-Safety-Net.pptx .
PPTX
Royalties-Accounting-Maximizing-Accuracy-and-Efficiency.pptx
PPTX
Debtors system in financial accounting.pptx
PPTX
Compute-Variables-in-SPSS.pptx CAP - III
PPTX
Joint-Venture-Vs-Partnership.pptx - WCM.
PPTX
Management of Cash.pptx - Working apital Management
PPTX
Importance of Working Capital.pptx - WCM
PPTX
Determinant of Working Capital.pptx - WCM
PPTX
Single Entry System of Bookkeeping.pptx - Principles of Accountancy
PPTX
Bill of Exchange & Promissory Note - Principles of Accountancy
Recently uploaded
PPTX
Overview of how to Create a Model in Odoo 18
PDF
Analyzing the data of your initial survey
PPTX
Partial Correlation of Coefficient - Values of r₁₂.₃, r₂₃.₁ & r₁₃.₂
PPTX
UNIT 1: COMMUNICATION SKILLS, BARRIERS TO COMMUNICATION, PERSPECTIVES IN COMM...
PPTX
10-12-2025 Francois Staring How can Researchers and Initial Teacher Educators...
PPTX
Accounting Skills Paper-II (Registers of PACs and Credit Co-operative Societies)
PPTX
Expected Revenue Report In Odoo 18 CRM
PPTX
3 G8_Q3_L3_ (Cartoon as Representation in Opinion Editorial Article).pptx
PPTX
Partial Correlation - Values of r₁₂.₃, r₂₃.₁ & r₁₃.₂ r₁₂, r₁₃ and r₂₃
PPTX
How to Configure Push & Pull Rule in Odoo 18 Inventory
PDF
Biology Practical Class 12th 2025 PDF(2)-2-52.pdf
PPTX
TAMIS & TEMS - HOW, WHY and THE STEPS IN PROCTOLOGY
PPTX
How to Track a Link Using Odoo 18 SMS Marketing
PDF
M.Sc. Nonchordates Complete Syllabus PPT | All Important Topics Covered
PDF
Most Imp Chapters & Weightage for Boards 2025.pdf
PPTX
AN EXTREMELY BORING GENERAL QUIZ FOR UG.pptx
PPTX
The Cell & Cell Cycle-detailed structure and function of organelles.pptx
PDF
Multiple Myeloma , definition, etiology, PP, CM , DE and management
PPTX
Growth & Development MILESTONES (ADOLESCENTS ).pptx
PPTX
PURPOSIVE SAMPLING IN EDUCATIONAL RESEARCH RACHITHRA RK.pptx
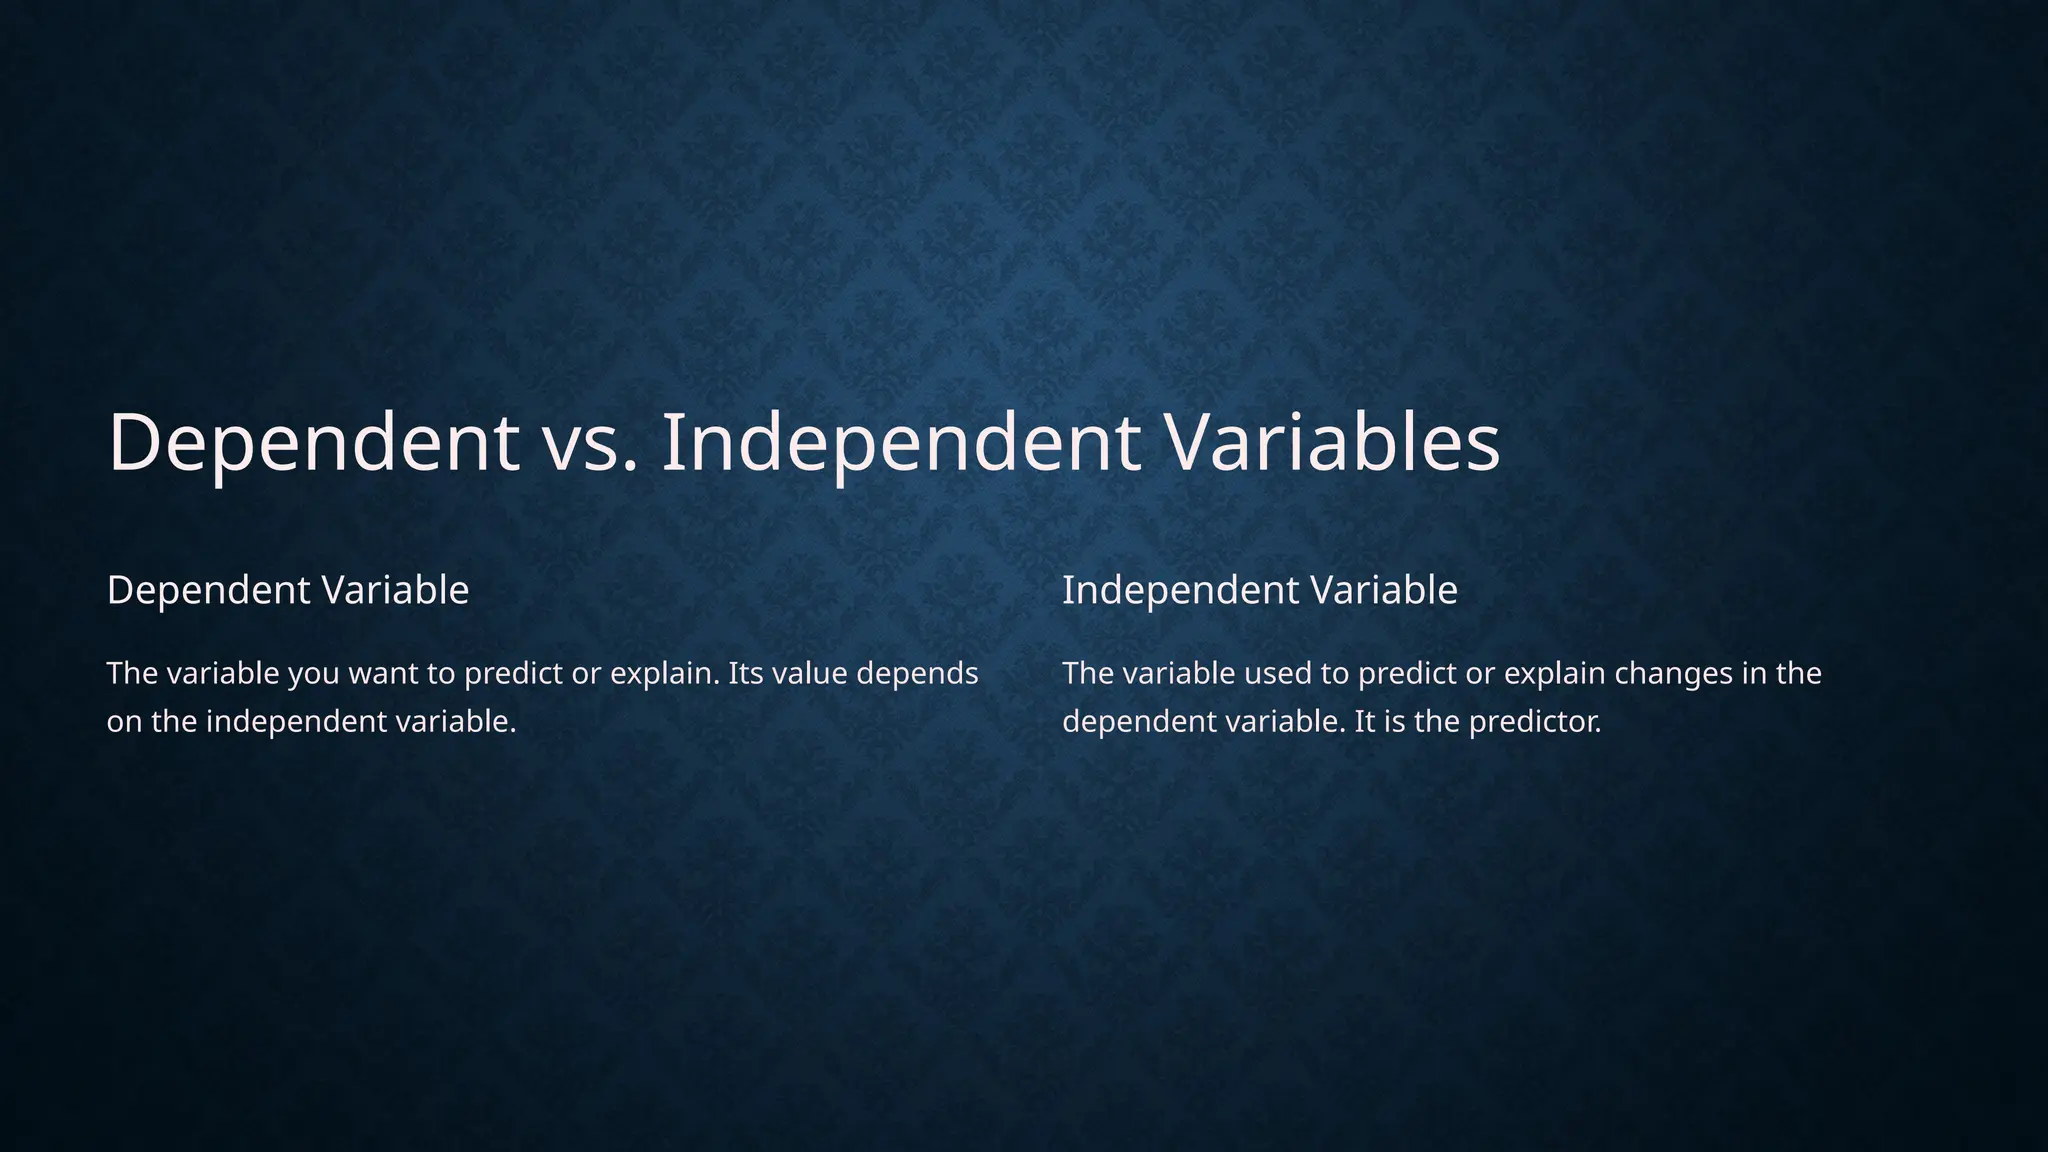
Simple Linear Regression.pptx inSPSS (Theory) 1. 2. Dependent vs. Independent Variables
Dependent Variable
The variable you want to predict or explain. Its value depends
on the independent variable.
Independent Variable
The variable used to predict or explain changes in the
dependent variable. It is the predictor.
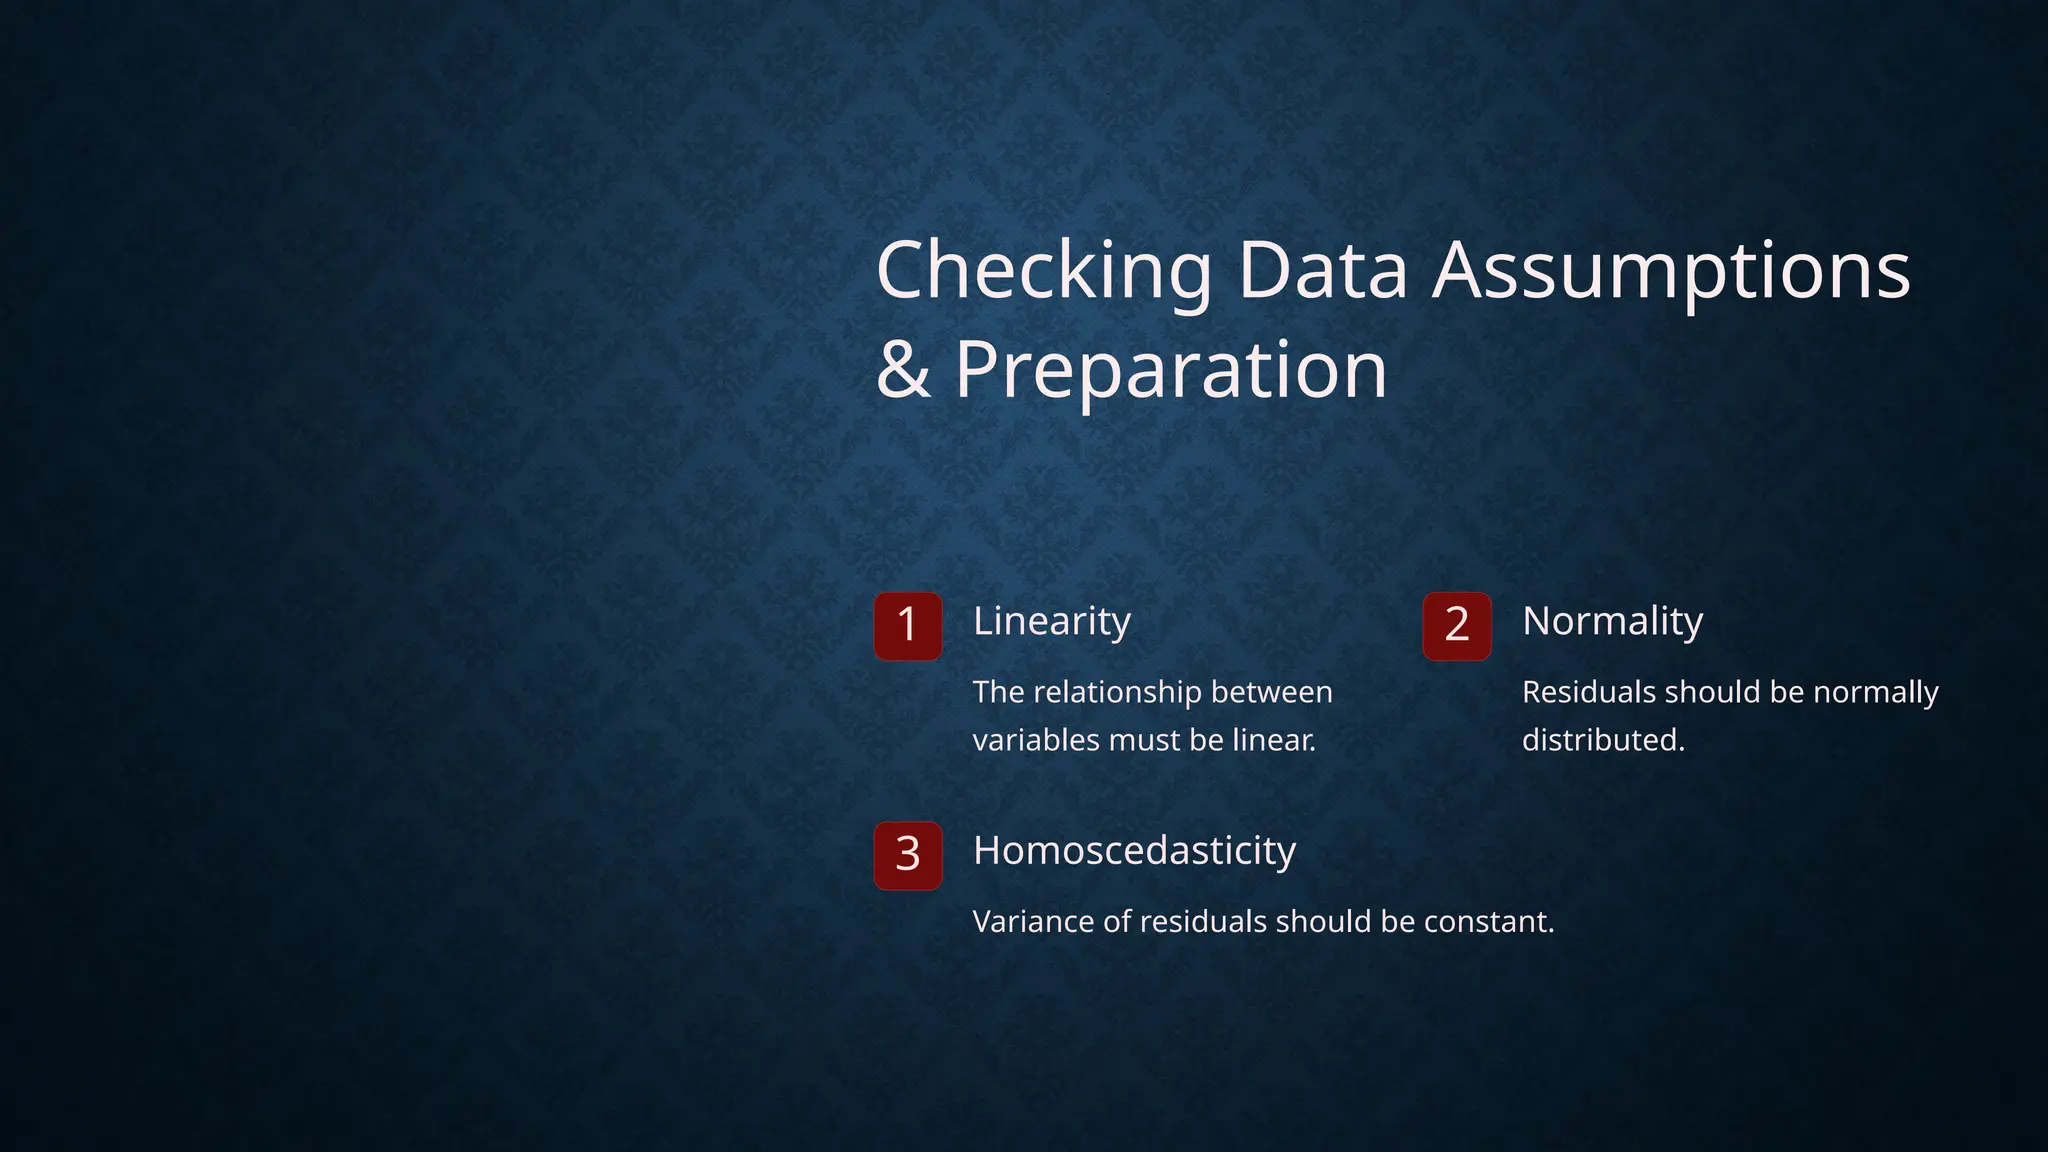
3. Checking Data Assumptions
& Preparation
1 Linearity
The relationship between
variables must be linear.
2 Normality
Residuals should be normally
distributed.
3 Homoscedasticity
Variance of residuals should be constant.
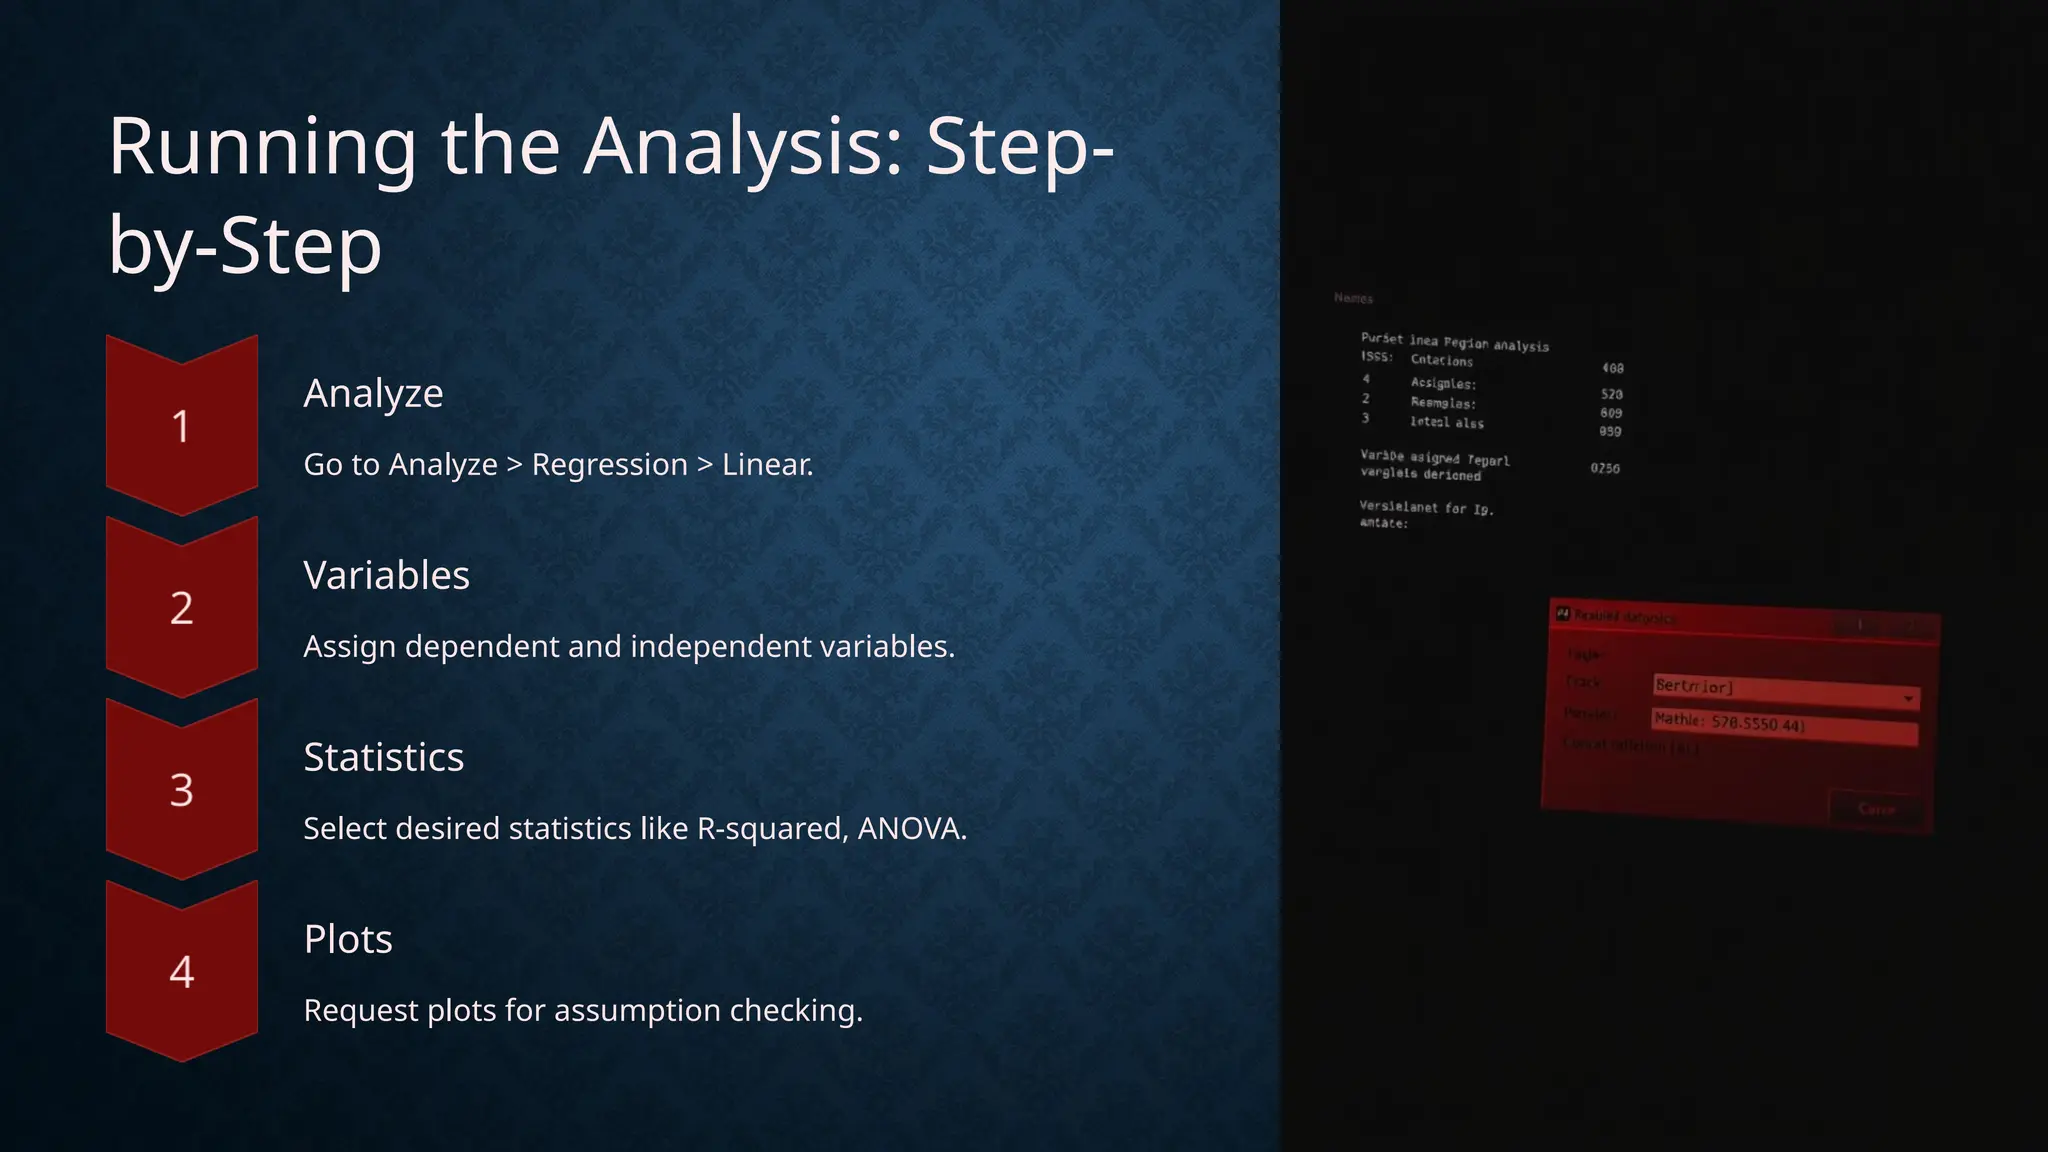
4. Running the Analysis: Step-
by-Step
Analyze
Go to Analyze > Regression > Linear.
Variables
Assign dependent and independent variables.
Statistics
Select desired statistics like R-squared, ANOVA.
Plots
Request plots for assumption checking.
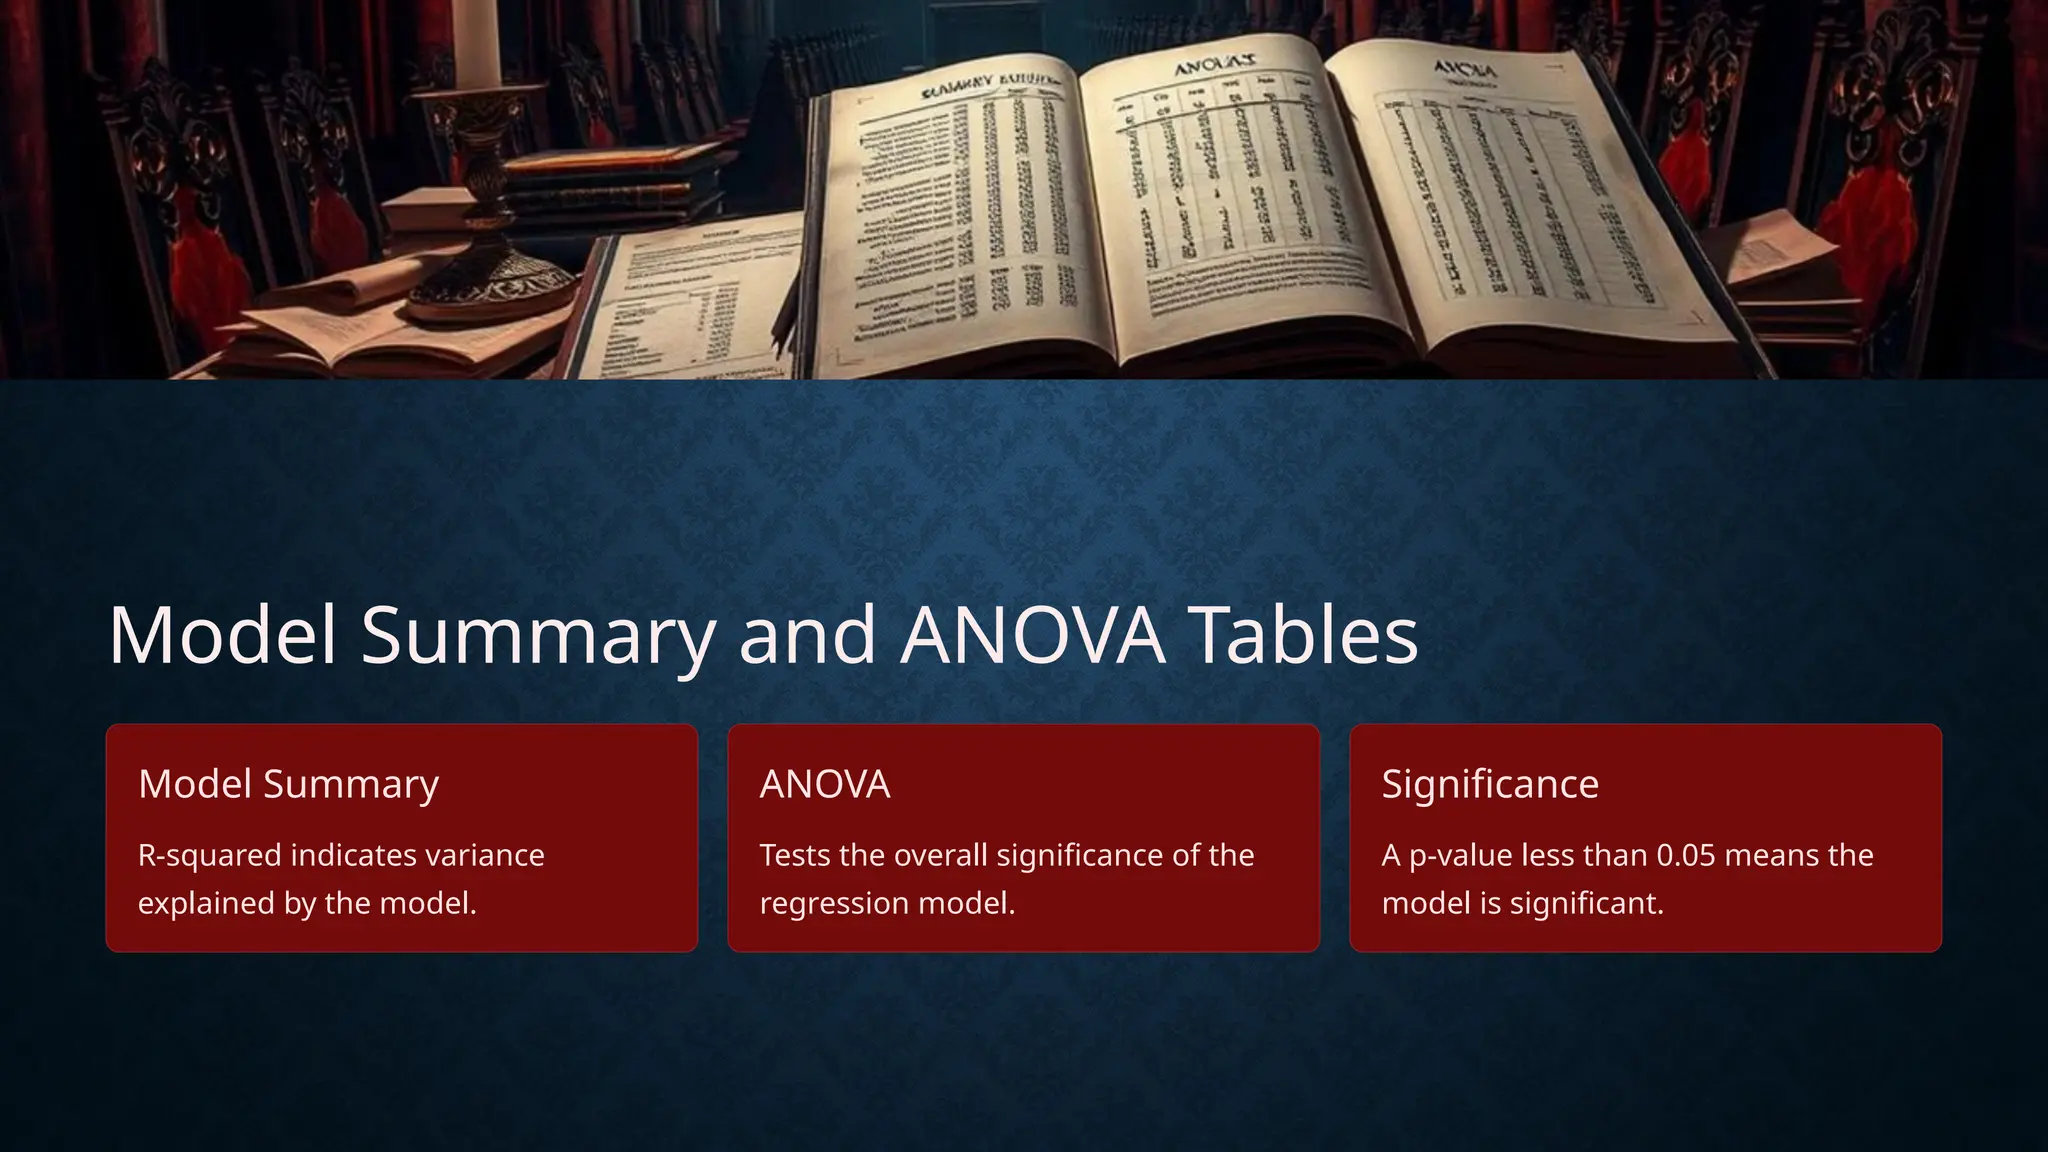
5. Model Summary and ANOVA Tables
Model Summary
R-squared indicates variance
explained by the model.
ANOVA
Tests the overall significance of the
regression model.
Significance
A p-value less than 0.05 means the
model is significant.
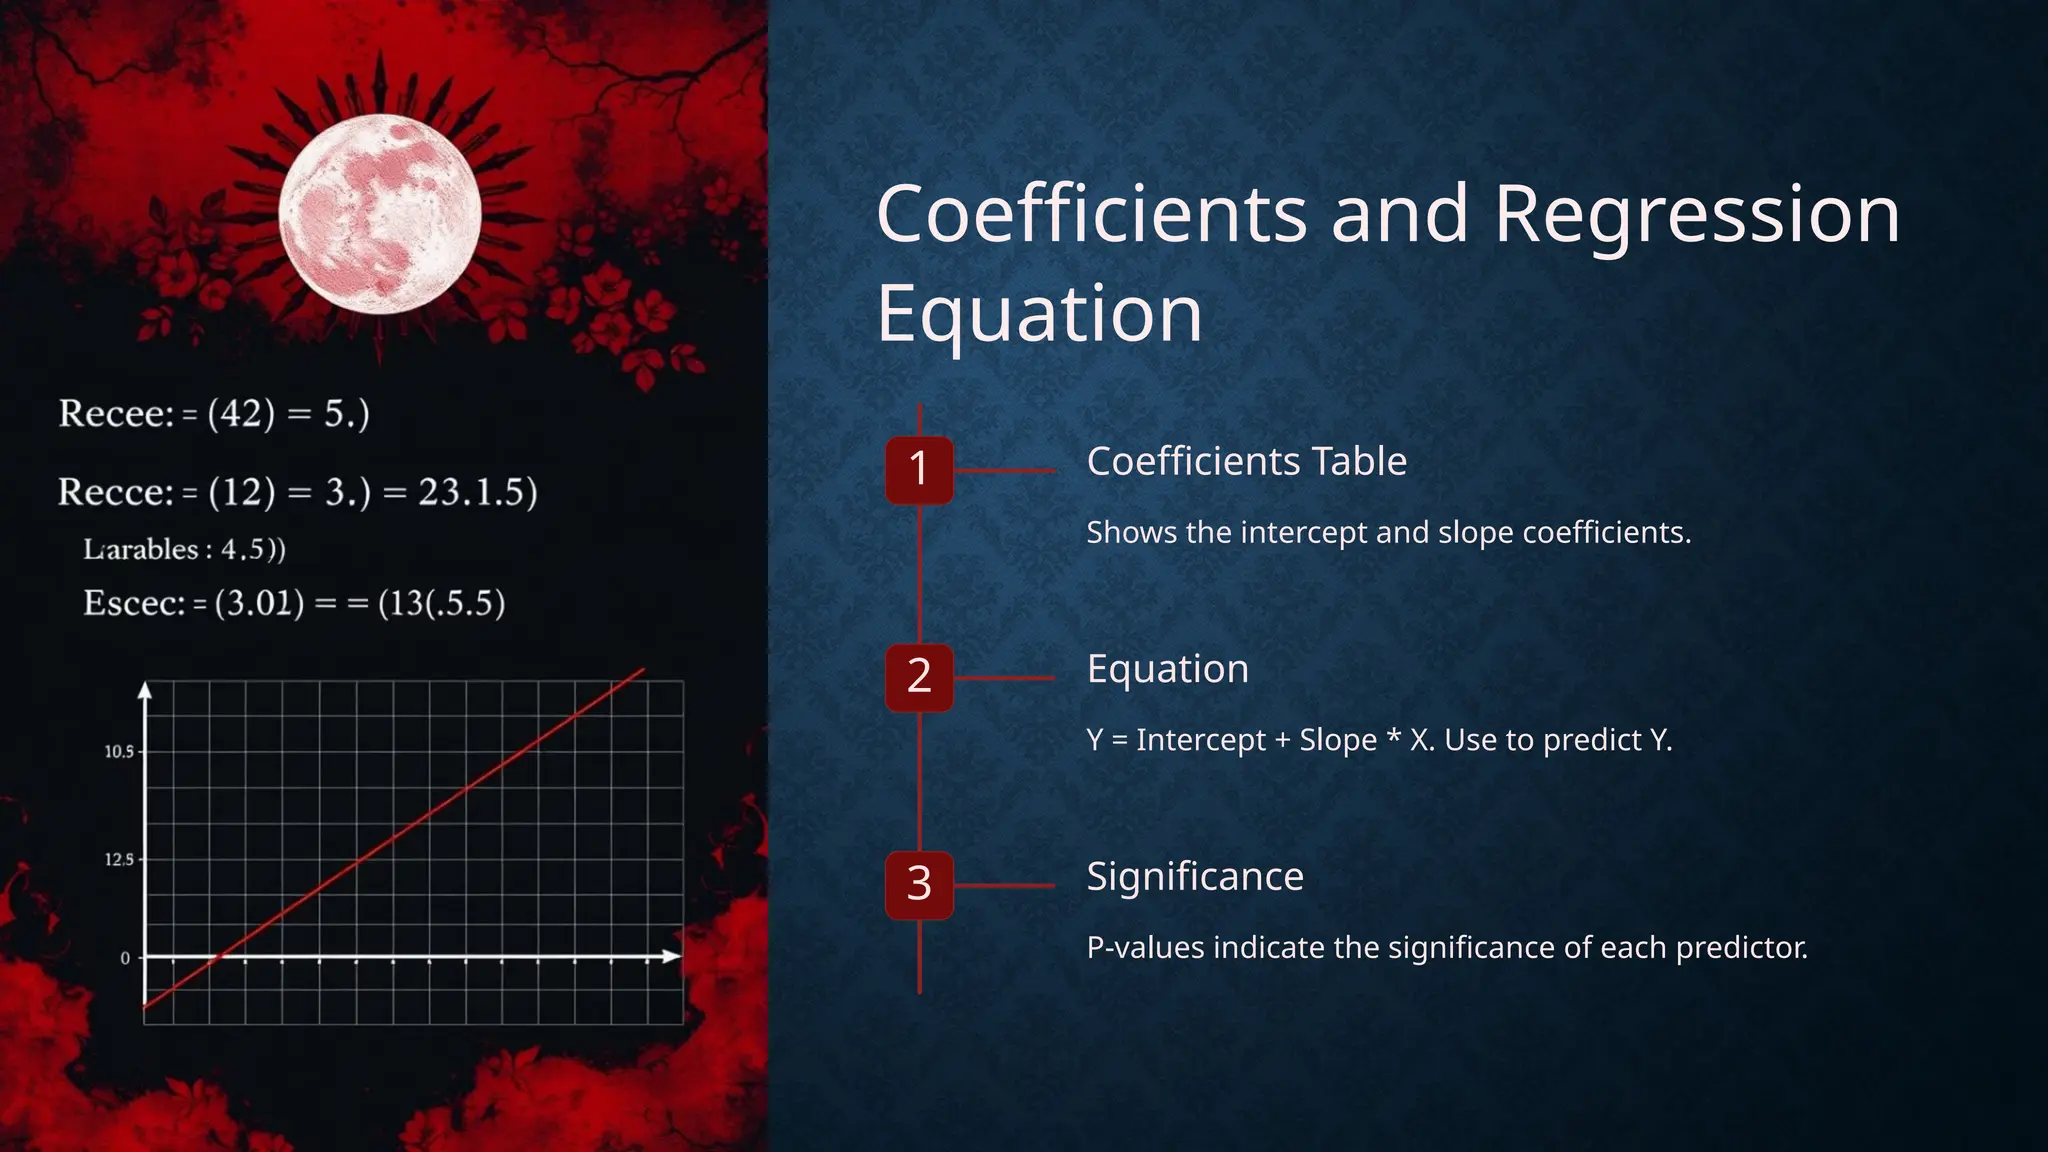
6. Coefficients and Regression
Equation
1 Coefficients Table
Shows the intercept and slope coefficients.
2 Equation
Y = Intercept + Slope * X. Use to predict Y.
3 Significance
P-values indicate the significance of each predictor.
7.