Download as PDF, PPTX


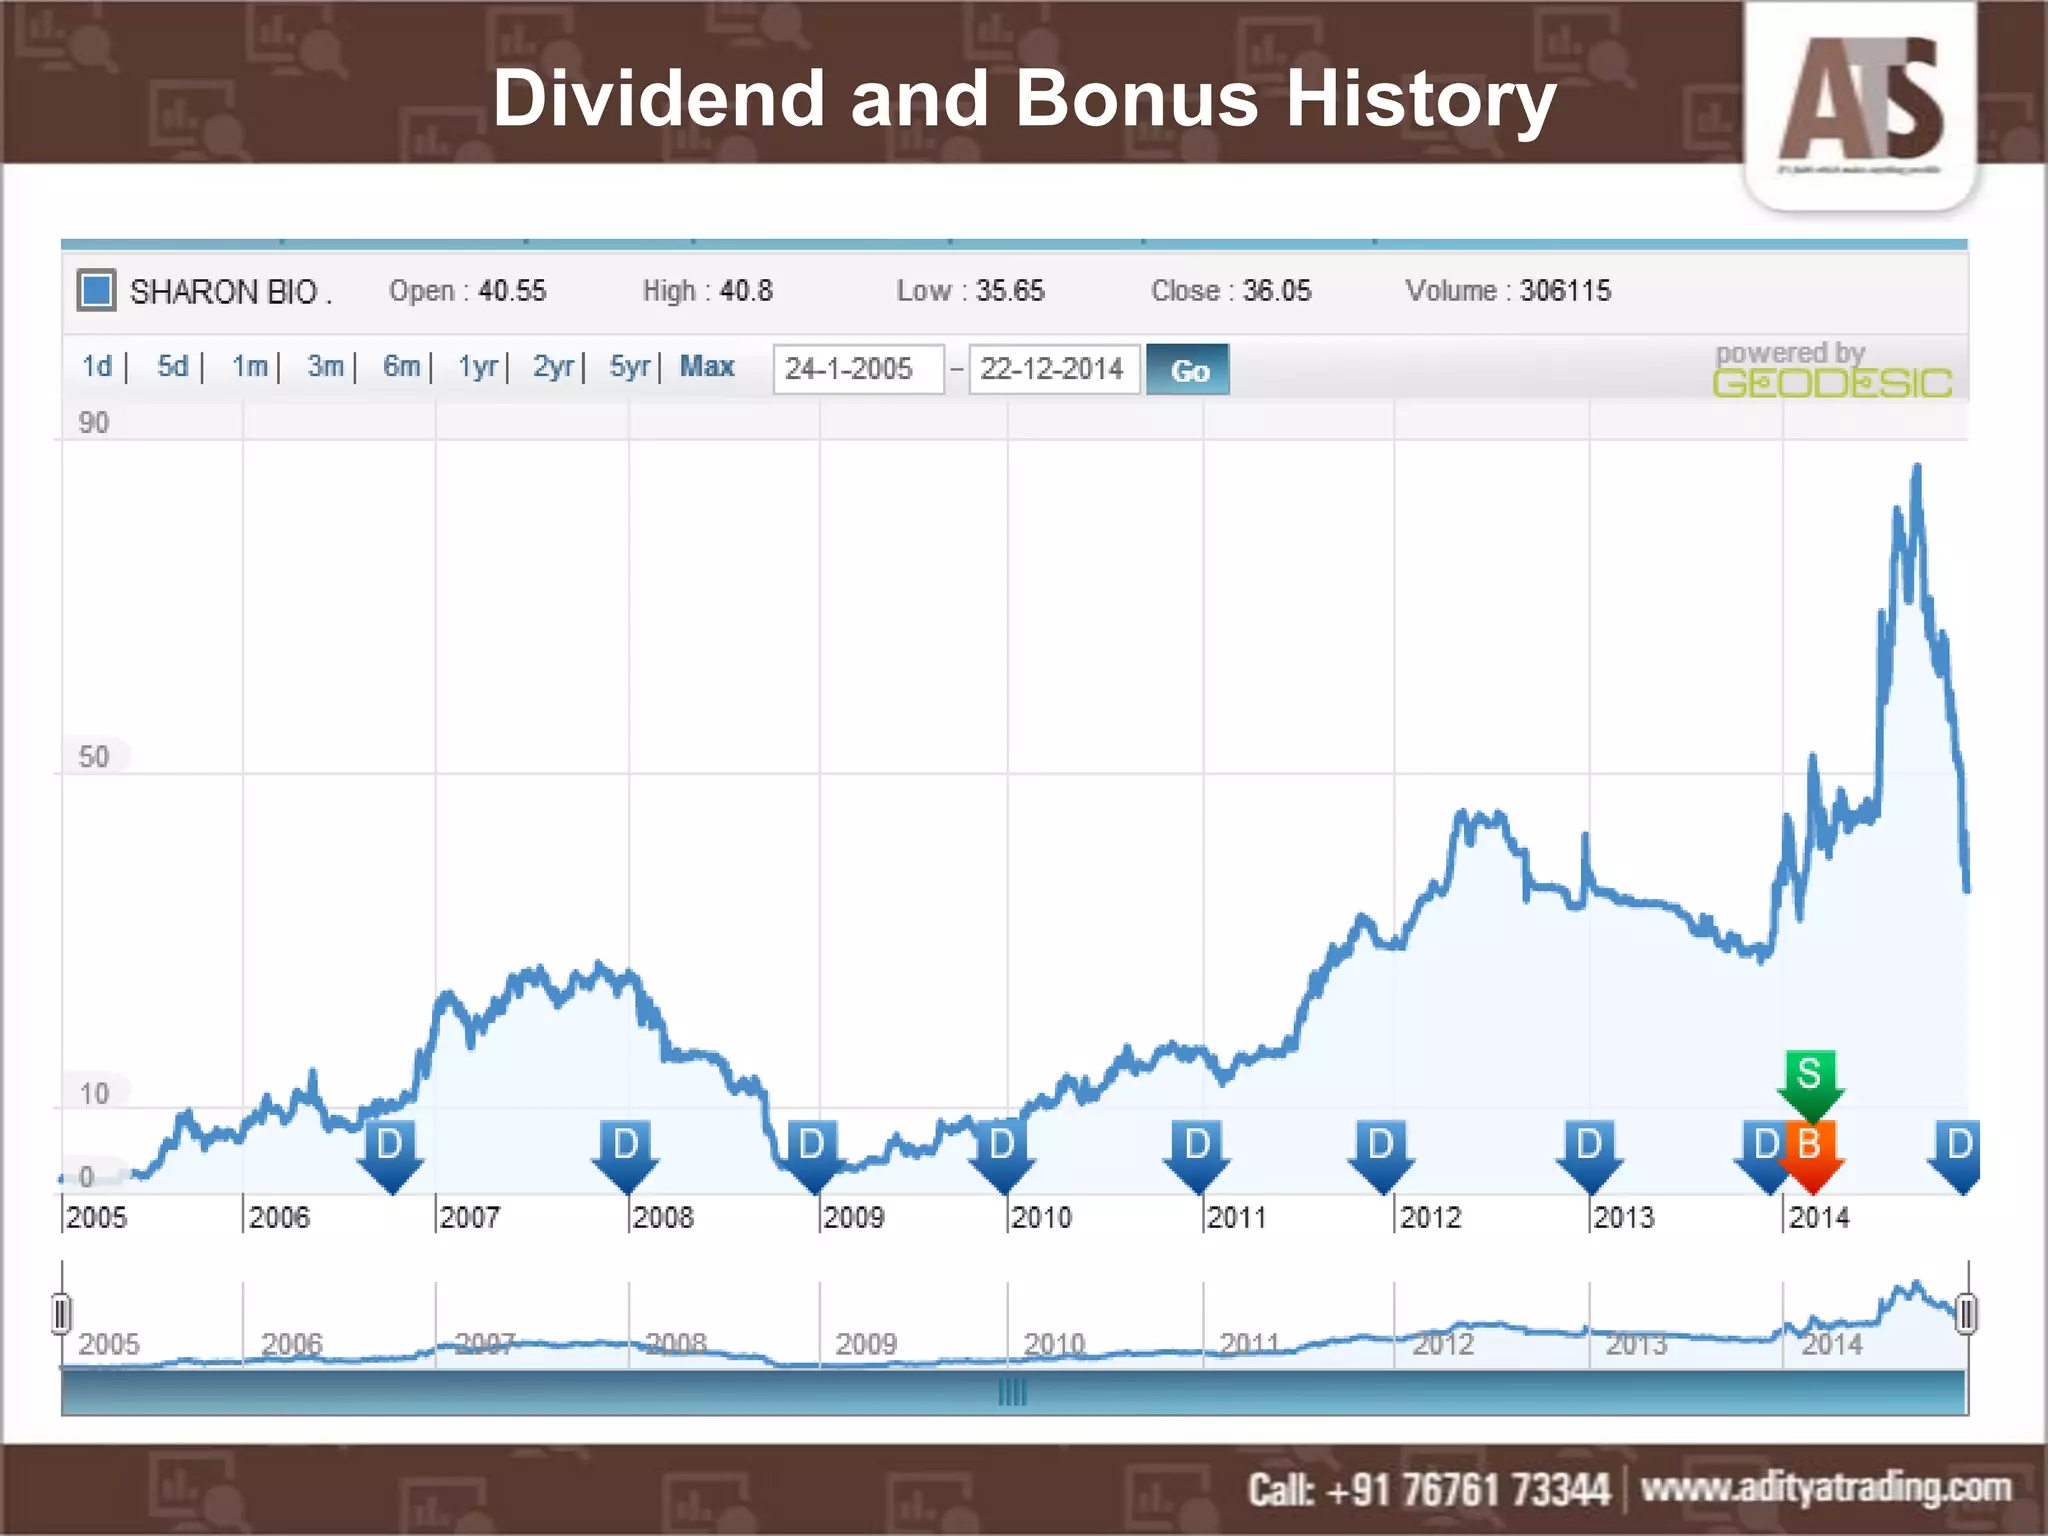


Sharon Bio-Medicine Limited is a Mumbai-based company that develops and sells pharmaceutical intermediates and active ingredients across various therapeutic areas, reporting a market capitalization of ₹386.38 crore and consolidated sales of ₹349.52 crore for Q2 2014. The Indian biotechnology sector is expanding rapidly, expected to grow to approximately USD 73.73 billion by 2020, with Sharon Bio positioned to benefit from USFDA and UKMHRA approvals, and strong demand in the agriculture sector. Current recommendations suggest buying shares due to potential revenue growth and normal sales, despite recent stock price corrections.