Downloaded 34 times


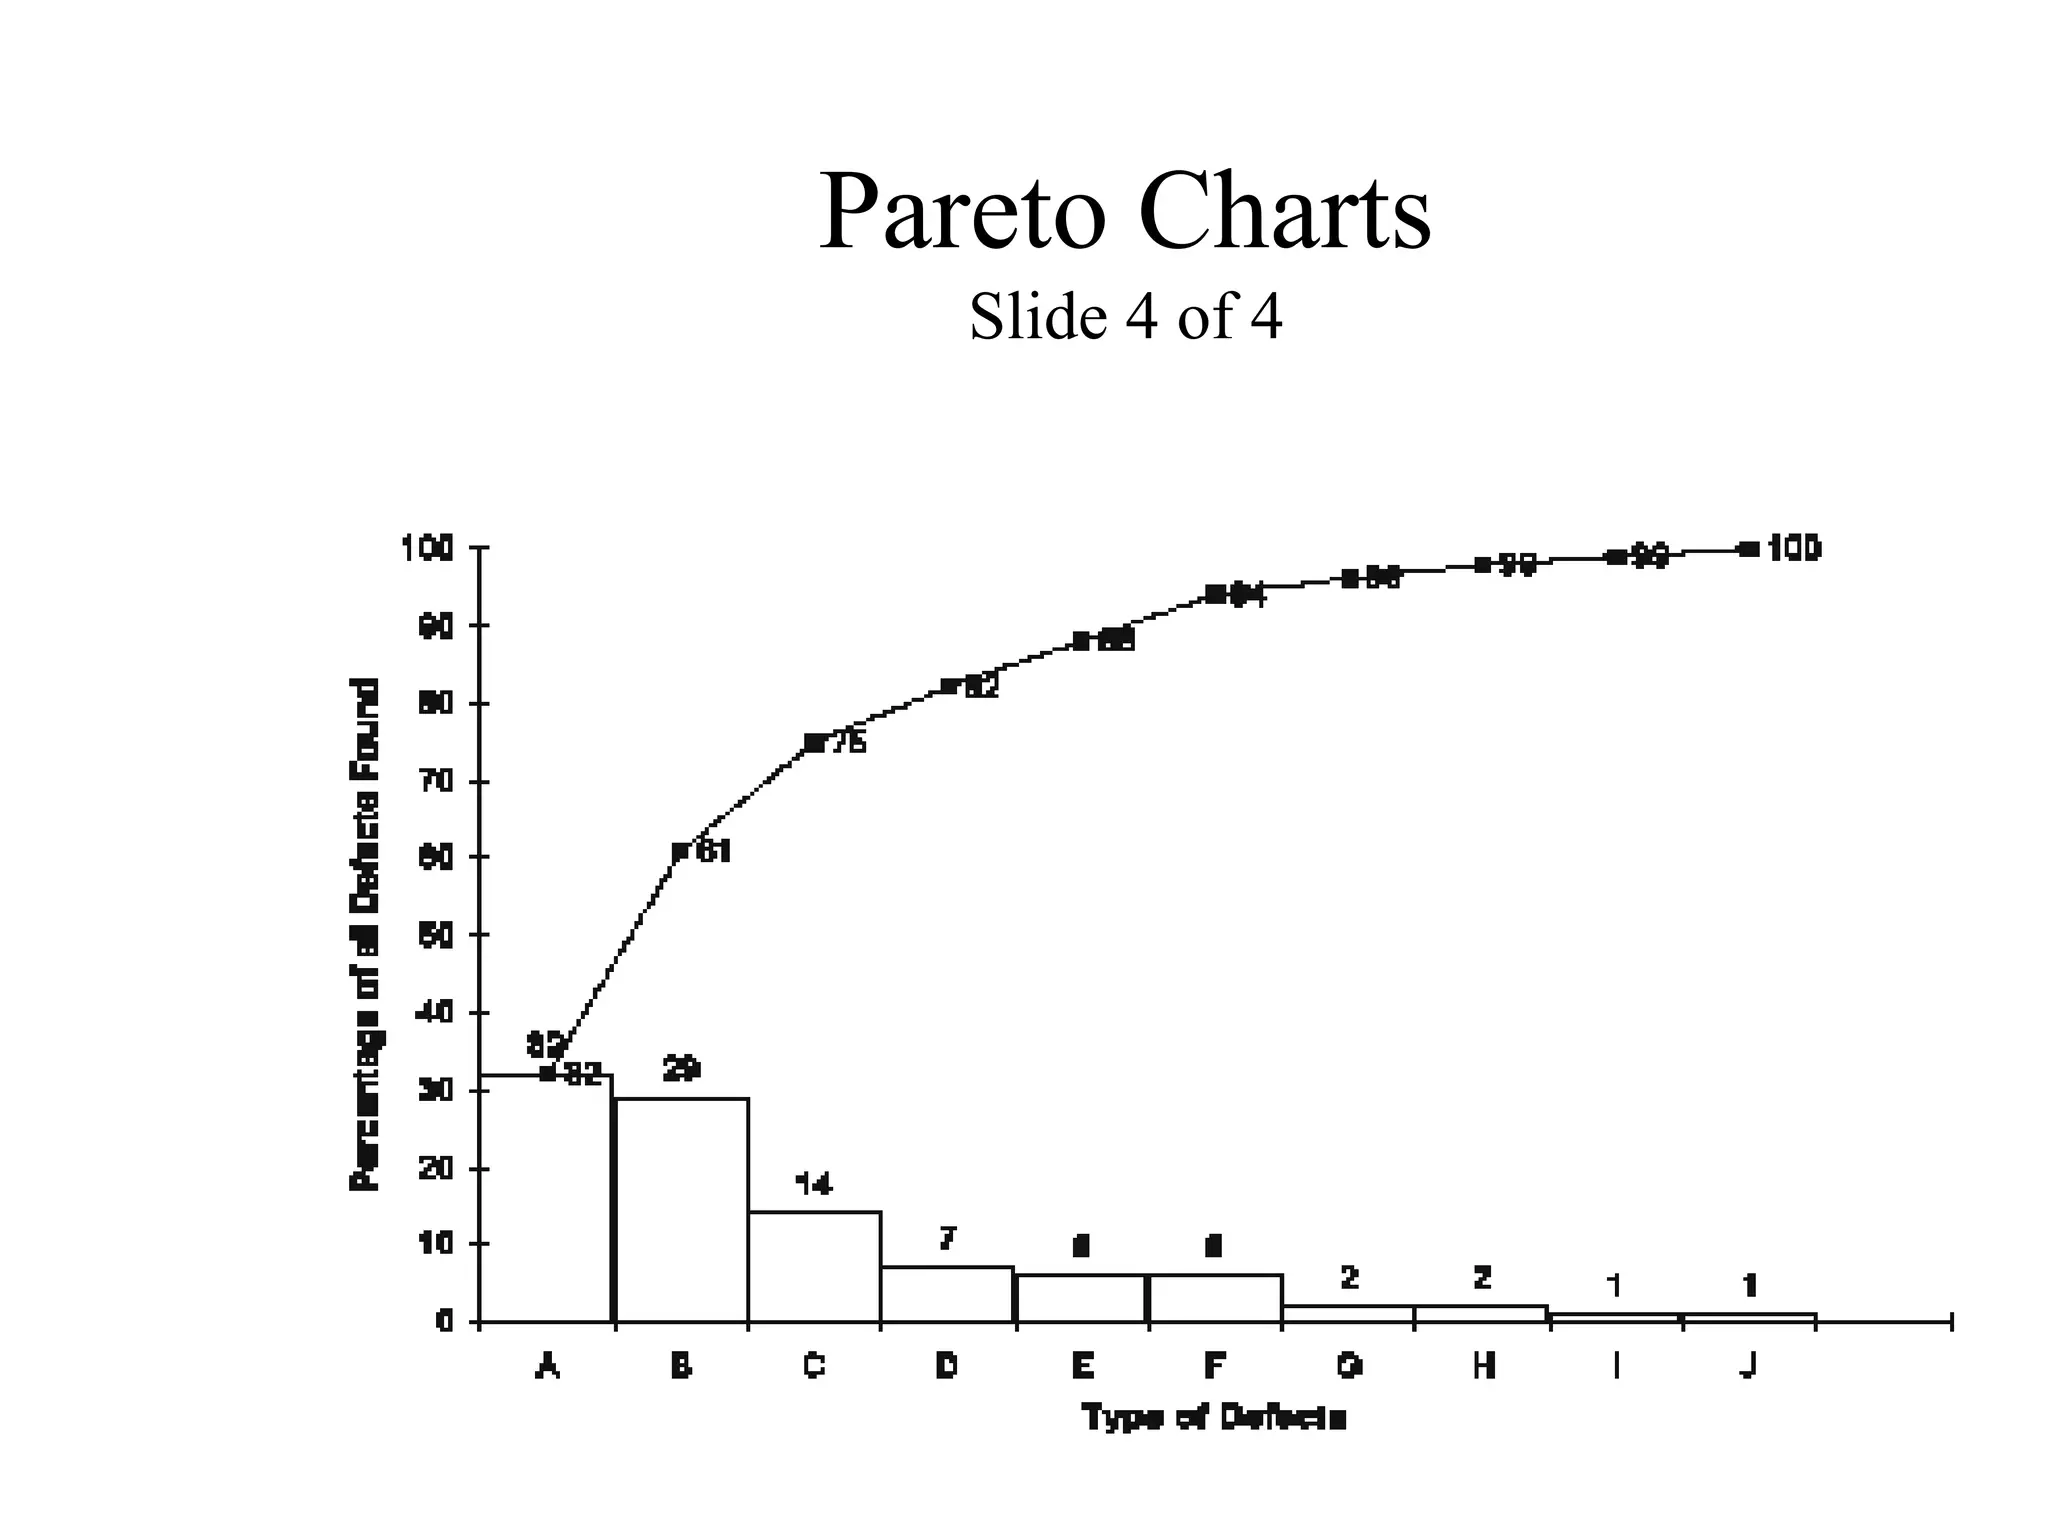
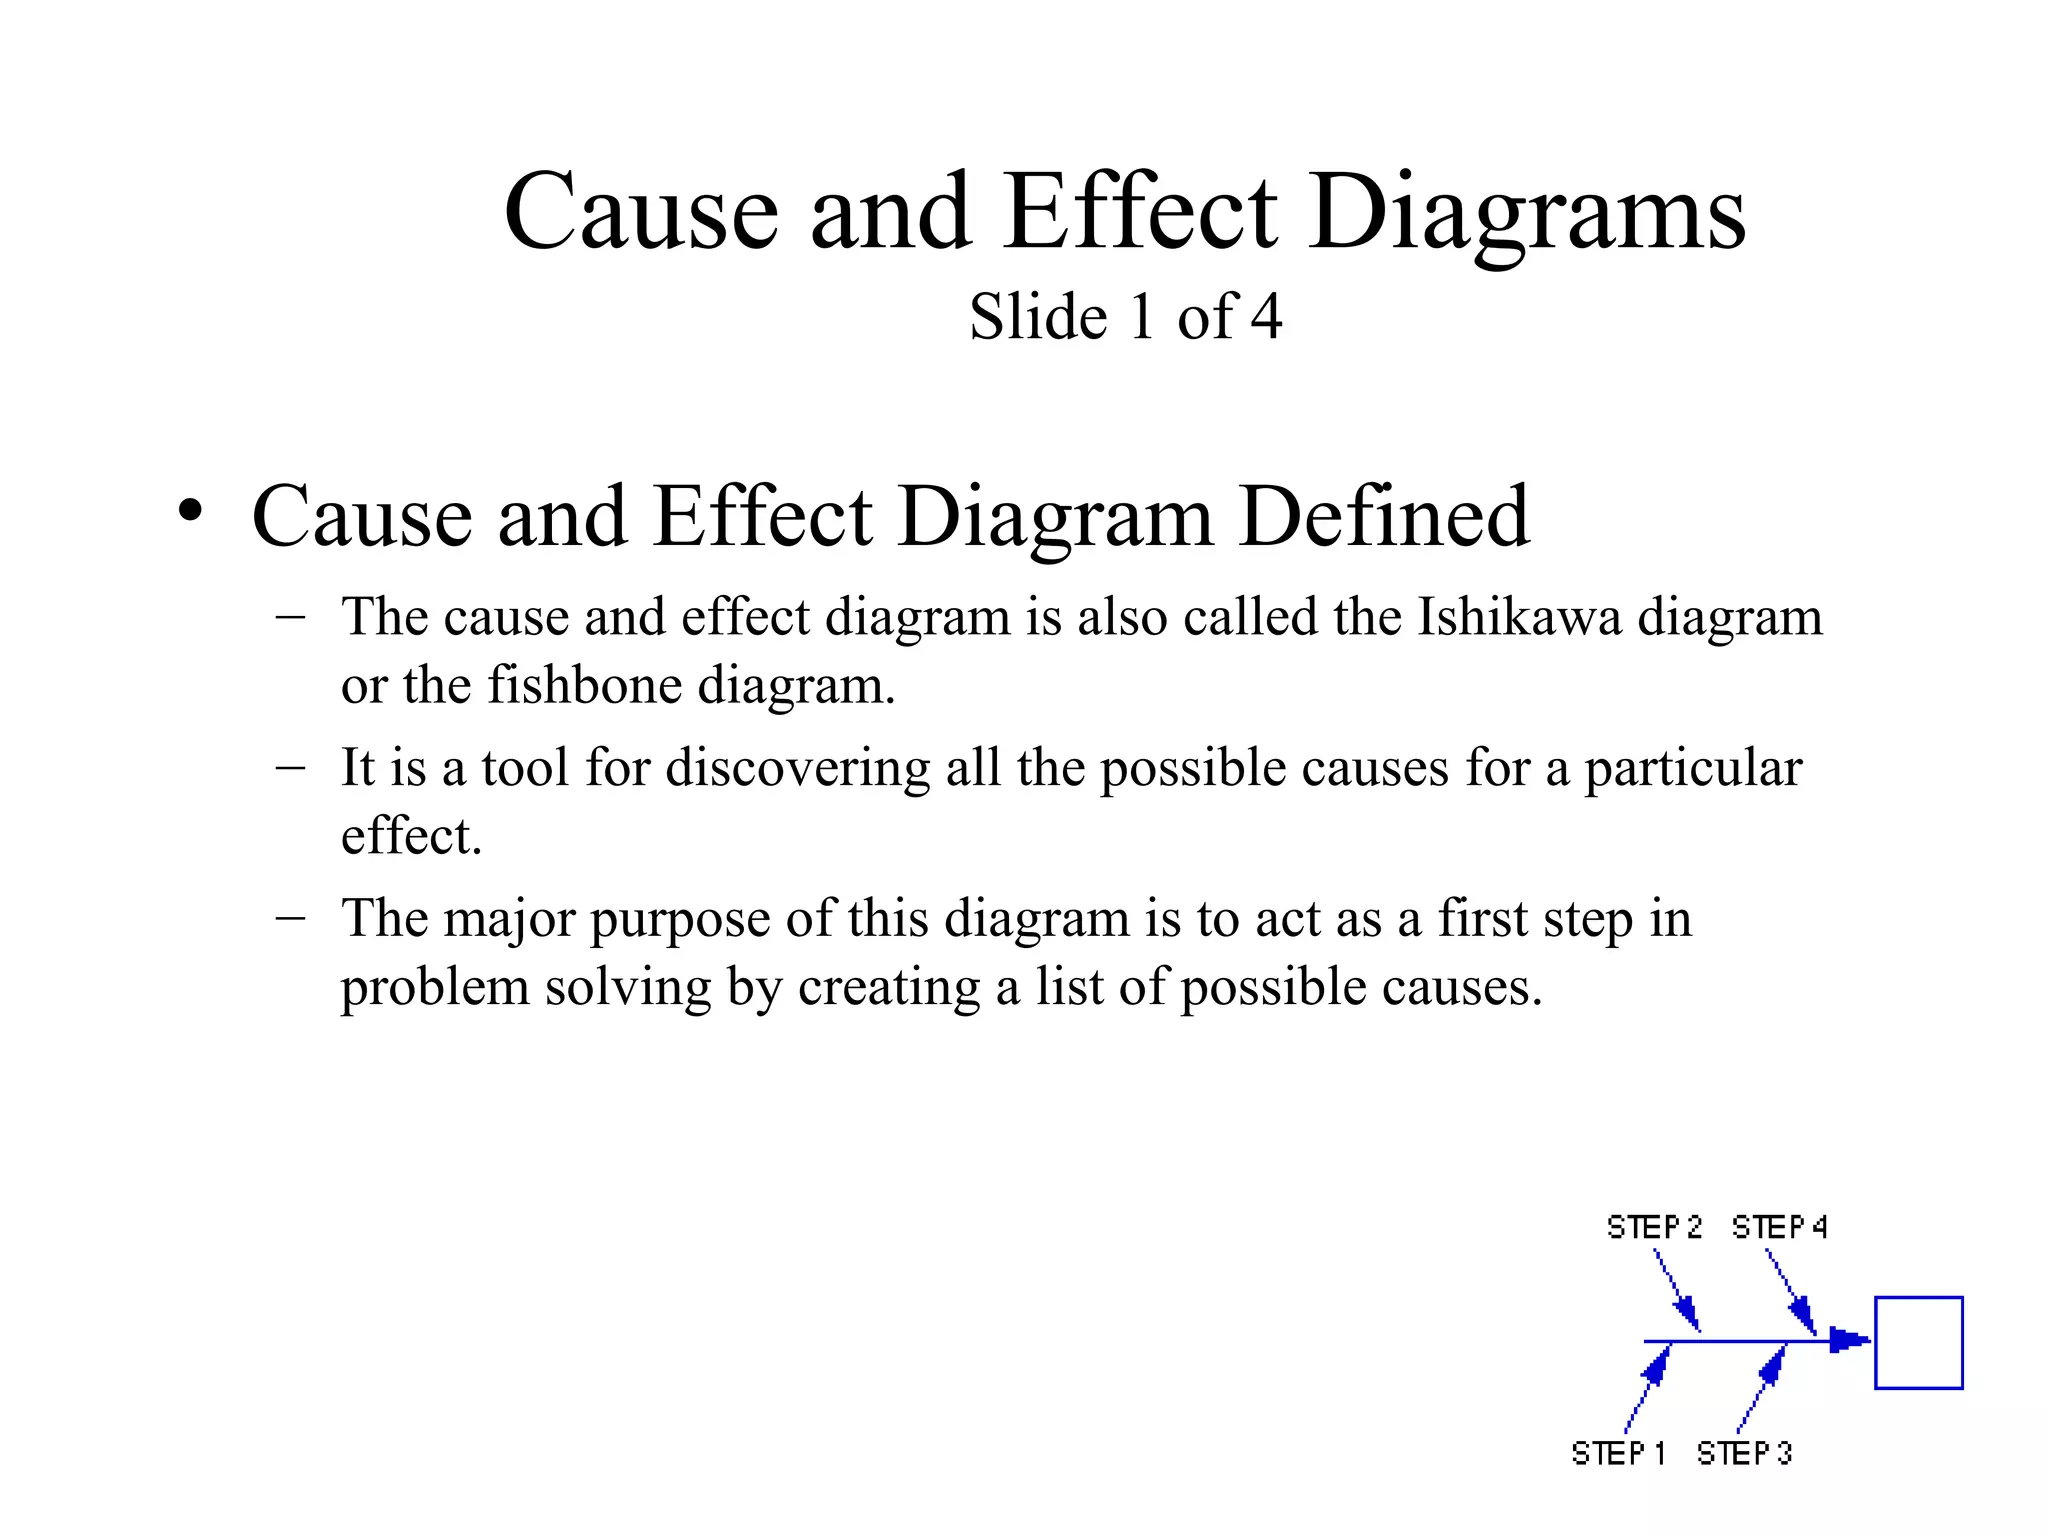
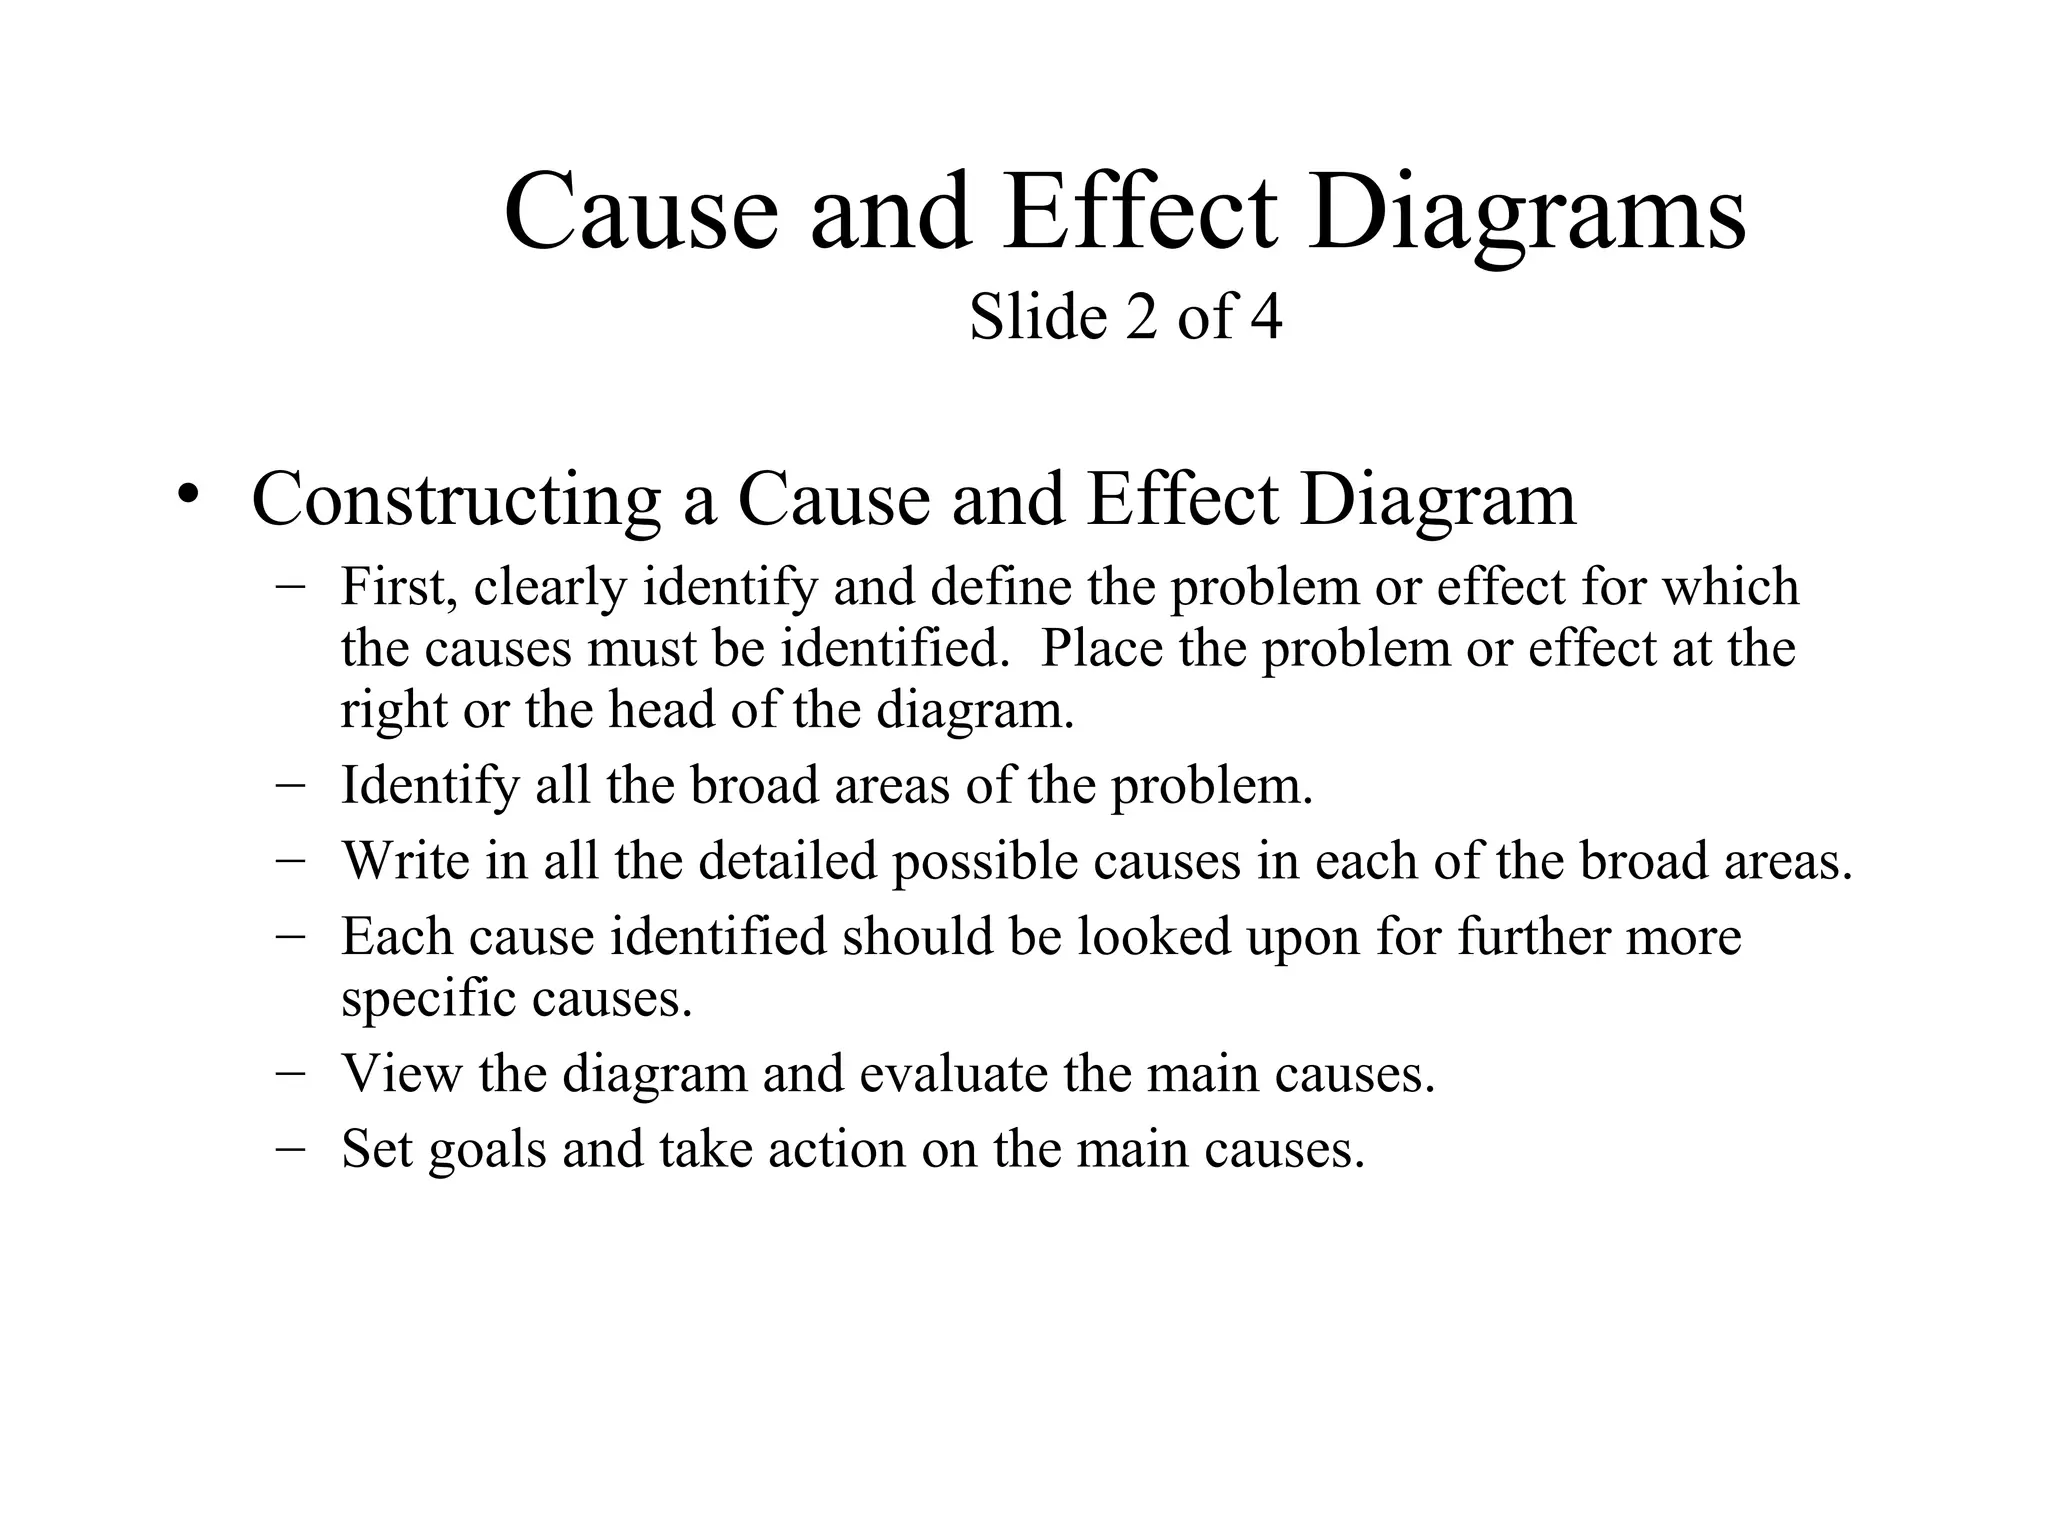

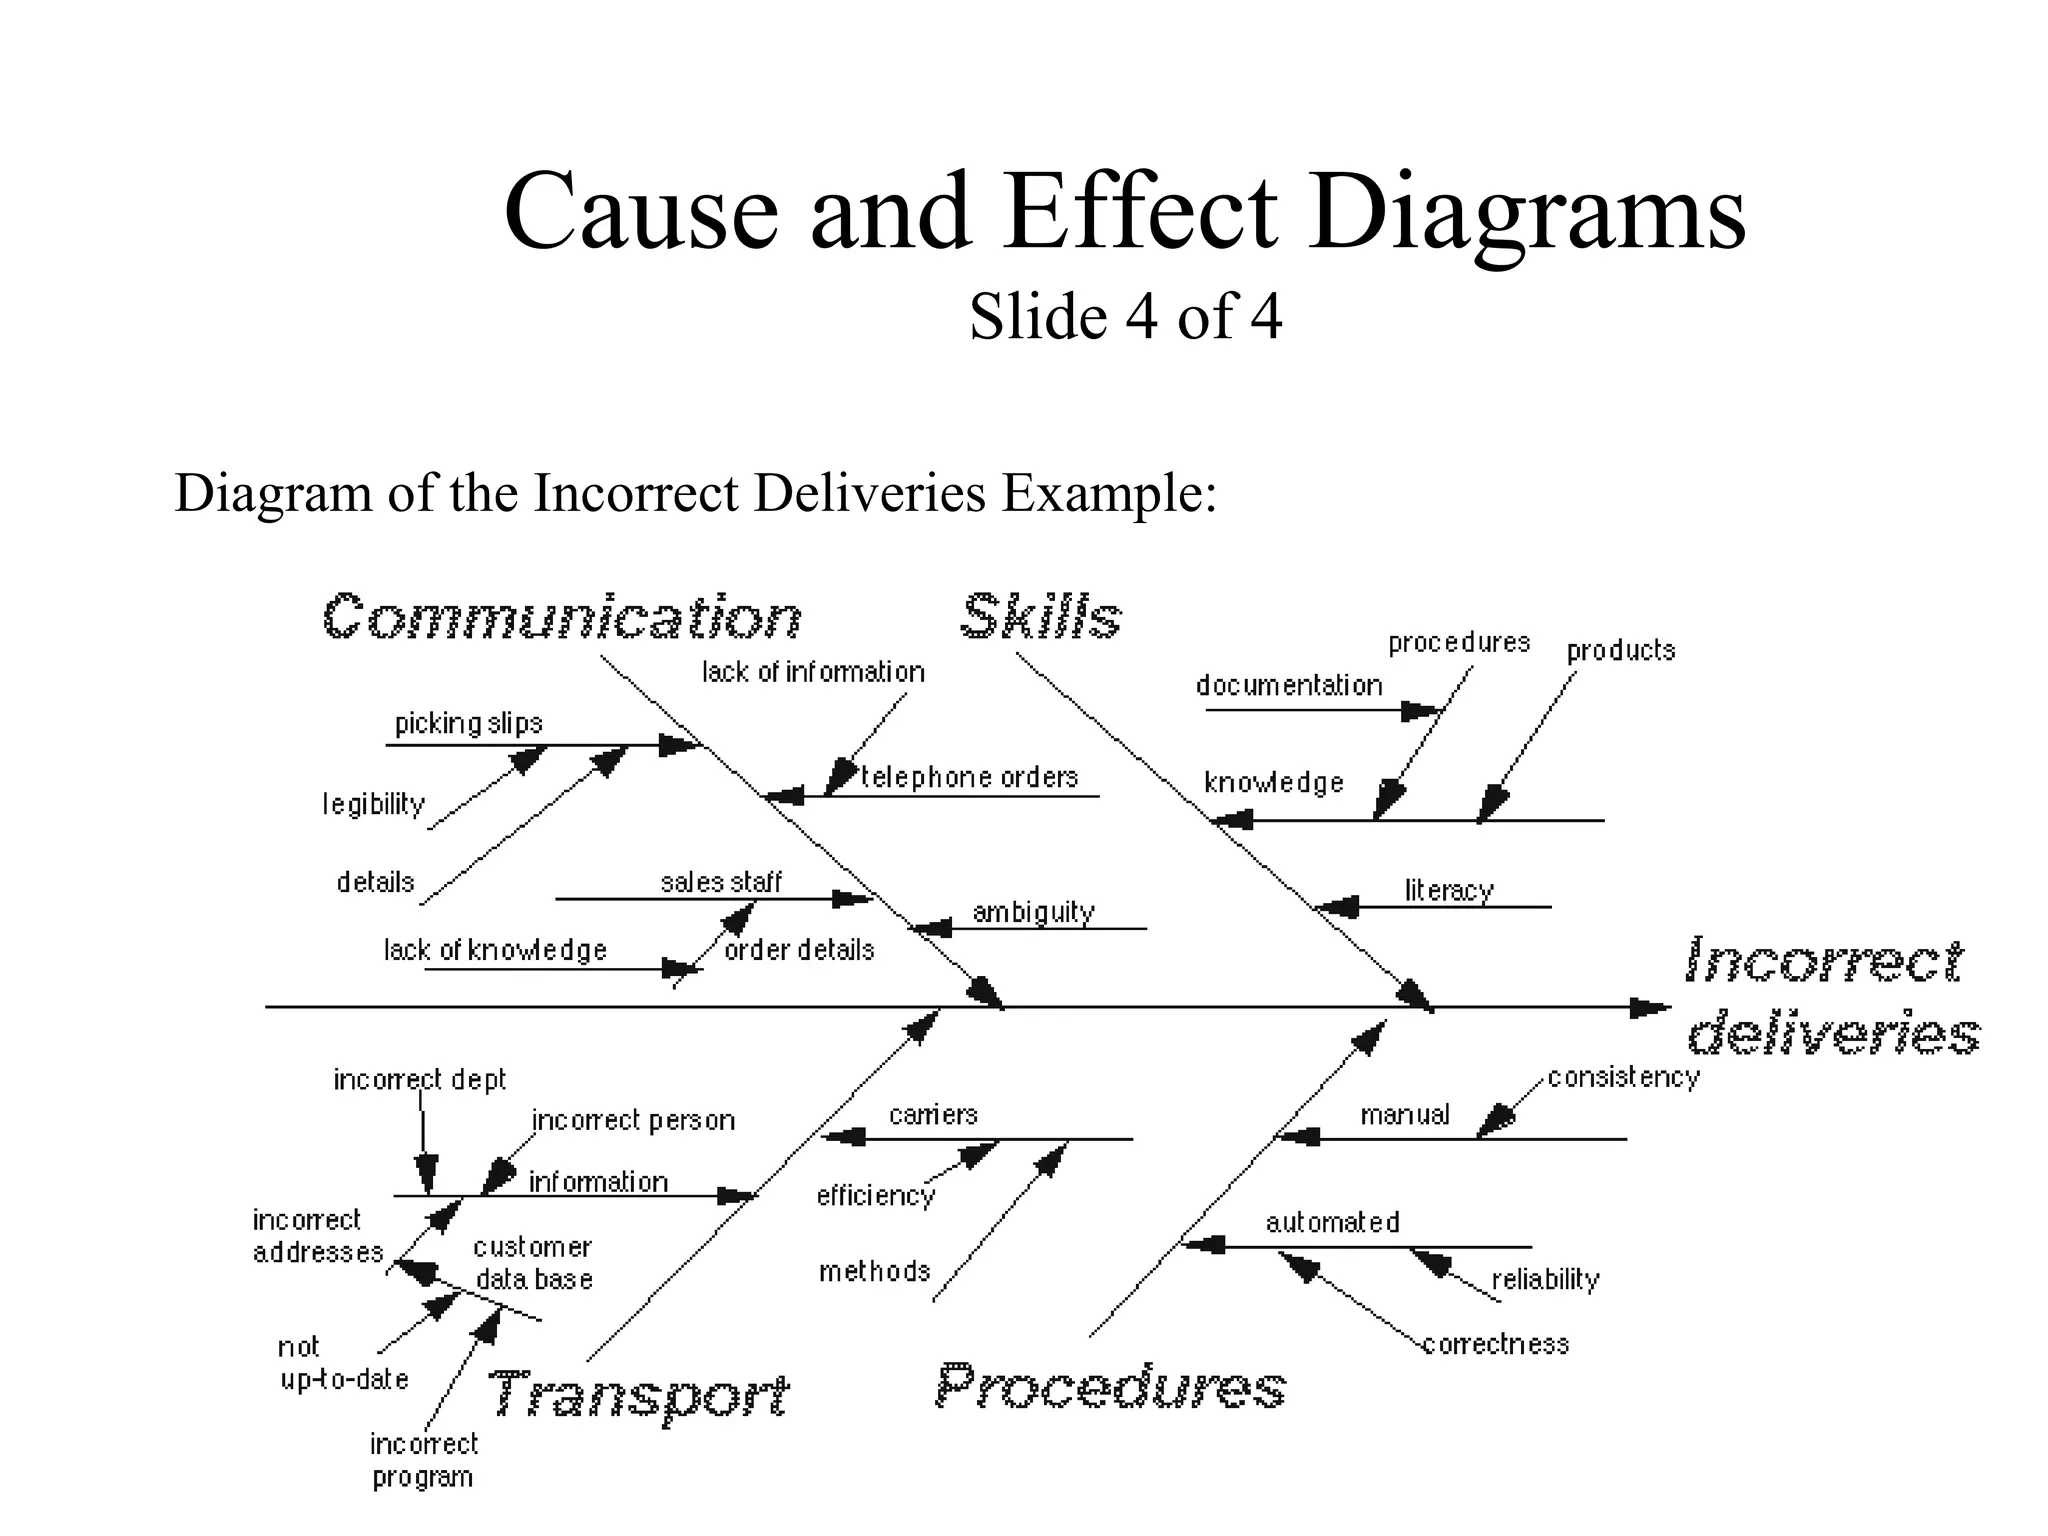


This presentation provided an overview of Ishikawa's seven basic quality tools: histograms, Pareto charts, cause-and-effect diagrams, run charts, scatter diagrams, flow charts, and control charts. For each tool, the presentation defined the tool, explained how to construct it, and provided an example of how the tool can be used. The tools are designed to be simple visual aids to help analyze data, identify relationships and causes, improve processes, and monitor quality.


![7 qc tools[1] to print](https://cdn.slidesharecdn.com/ss_thumbnails/7qctools1toprint-191017092858-thumbnail.jpg?width=640&height=640&fit=bounds)


