1. Sailakshmi Rajagopal (Group D)
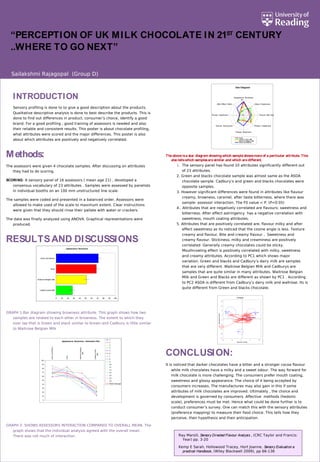
Theaboveisa star diagram showingwhich sampleshowsmoreof a particular attribute. This
alsotellswhich samplesaresimilar and which aredifferent.
1. The sensory panel has found 10 attributes significantly different out
of 23 attributes.
2. Green and blacks chocolate sample was almost same as the ASDA
chocolate sample. Cadbury’s and green and blacks chocolates were
opposite samples.
3. However significant differences were found in attributes like flavour
creamy, browness, caramel, after taste bitterness, where there was
sample- assessor interaction. The F0 value < P. (P<0.05)
4.. Attributes that are negatively correlated are flavours: sweetness and
bitterness. After effect astringency has a negative correlation with
sweetness, mouth coating attributes.
5. Attributes that are positively correlated are, flavour milky and after
effect sweetness as its noticed that the cosine angle is less. Texture
creamy and flavour, Bite and creamy flavour , Sweetness and
creamy flavour. Stickiness, milky and creaminess are positively
correlated Generally creamy chocolates could be sticky.
Mouthcoating effect is positively correlated with milky, sweetness
and creamy attributes. According to PC1 which shows major
variation, Green and blacks and Cadbury’s dairy milk are samples
that are very different. Waitrose Belgian Milk and Cadburys are
samples that are quite similar in many attributes. Waitrose Belgian
Milk and Green and Blacks are different as shown by PC1 . According
to PC2 ASDA is different from Cadbury’s dairy milk and waitrose. Its is
quite different from Green and blacks chocolate.
CONCLUSION:
It is noticed that darker chocolates have a bitter and a stronger cocoa flavour
while milk chocolates have a milky and a sweet odour. The way forward for
milk chocolate is more challenging. The consumers prefer mouth coating,
sweetness and glossy appearance. The choice of it being accepted by
consumers increases. The manufactures may also gain in this if some
attributes of milk chocolates are improved. Ultimately , the choice and
development is governed by consumers. Affective methods (hedonic
scale), preferences must be met. Hence what could be done further is to
conduct consumer’s survey. One can match this with the sensory attributes
(preference mapping) to measure their food choice. This tells how they
perceive, their hypothesis and their anticipation.
Ray Marsili, Sensory Directed Flavour Analysis , (CRC Taylor and Francis:
Year) pp. 3-20
Kemp E Sarah, Hollowood Tracey, Hort Joanne, Sensory Evaluation a
practical Handbook, (Wiley Blackwell 2009), pp 66-136
INTRODUCTION
Sensory profiling is done to to give a good description about the products.
Qualitative descriptive analysis is done to best describe the products. This is
done to find out differences in product, consumer’s choice, identify a good
brand. For a good profiling , good training of assessors is needed and also
their reliable and consistent results. This poster is about chocolate profiling,
what attributes were scored and the major differences. This poster is also
about which attributes are positively and negatively correlated.
Methods:
The assessors were given 4 chocolate samples. After discussing on attributes
they had to do scoring.
SCORING: A sensory panel of 16 assessors ( mean age 21) , developed a
consensus vocabulary of 23 attributes . Samples were assessed by panelists
in individual booths on an 100 mm unstructured line scale.
The samples were coded and presented in a balanced order. Assessors were
allowed to make used of the scale to maximum extent. Clear instructions
were given that they should rinse their pallate with water or crackers.
The data was finally analyzed using ANOVA. Graphical representations were
produced.
RESULTSAND DISCUSSIONS
GRAPH 1:Bar diagram showing browness attribute. This graph shows how two
samples are related to each other in browness. The extent to which they
over lap that is Green and black similar to brown and Cadbury is little similar
to Waitrose Belgian Milk
GRAPH 2: SHOWS ASSESSORS INTERACTION COMPARED TO OVERALL MEAN. The
graph shows that the individual analysis agreed with the overall mean.
There was not much of interaction.
“PERCEPTION OF UK MILK CHOCOLATE IN 21ST
CENTURY
..WHERE TO GO NEXT”
Star Diagram
0
20
40
60
80
Appearance: Browness
Odour: Sweetness
Texture: Bite Noise
Flavour: Sweetness
Flavour: Bitterness
Texture: Stickyness
Texture: Sandiness
After Effect: Bitter
Asda
Cadbury Dairy Milk
Waitrose Belgian Milk
Green and Blacks
Appearance: Browness - Interaction Plot
0
10
20
30
40
50
60
70
80
90
100
GreenandBlacks
Asda
WaitroseBelgian
Milk
CadburyDairy
Milk
1
2
3
4
5
6
7
8
9
10
11
12
13
14
15
16
Panel Average
PCABiplot
0000000000000000000000
Waitrose Belgian
Milk
Green and
Blacks
Cadbury Dairy
Milk
Asda
After Effect:
Mouthcoating
After Effect:
Astringency
After Effect:
Sweetness
After Effect: Bitter
Texture:
Sandiness
Texture: Melting
Speed
Texture:
CrumblynessTexture:
Smoothness
Texture: Creamy
Texture:
Stickyness
Texture: Bite
Noise
Flavour: Caramel
Flavour: Nutty
Flavour: Milky
Flavour:
Bitterness
Flavour:
Sweetness
Odour:
SweetnessOdour: Cocoa
Appearance:
Bloom
Appearance:
Shinyness
Appearance:
Browness
-21
-16
-11
-6
-1
4
9
14
19
-21 -11 -1 9 19
Dimension 1 (74.5%)
Dimension2(15.4%)
Appearance: Browness
0 10 20 30 40 50 60 70 80 90 100
Cadbury Dairy Milk
Waitrose Belgian Milk
Asda
Green and Blacks