Download to read offline


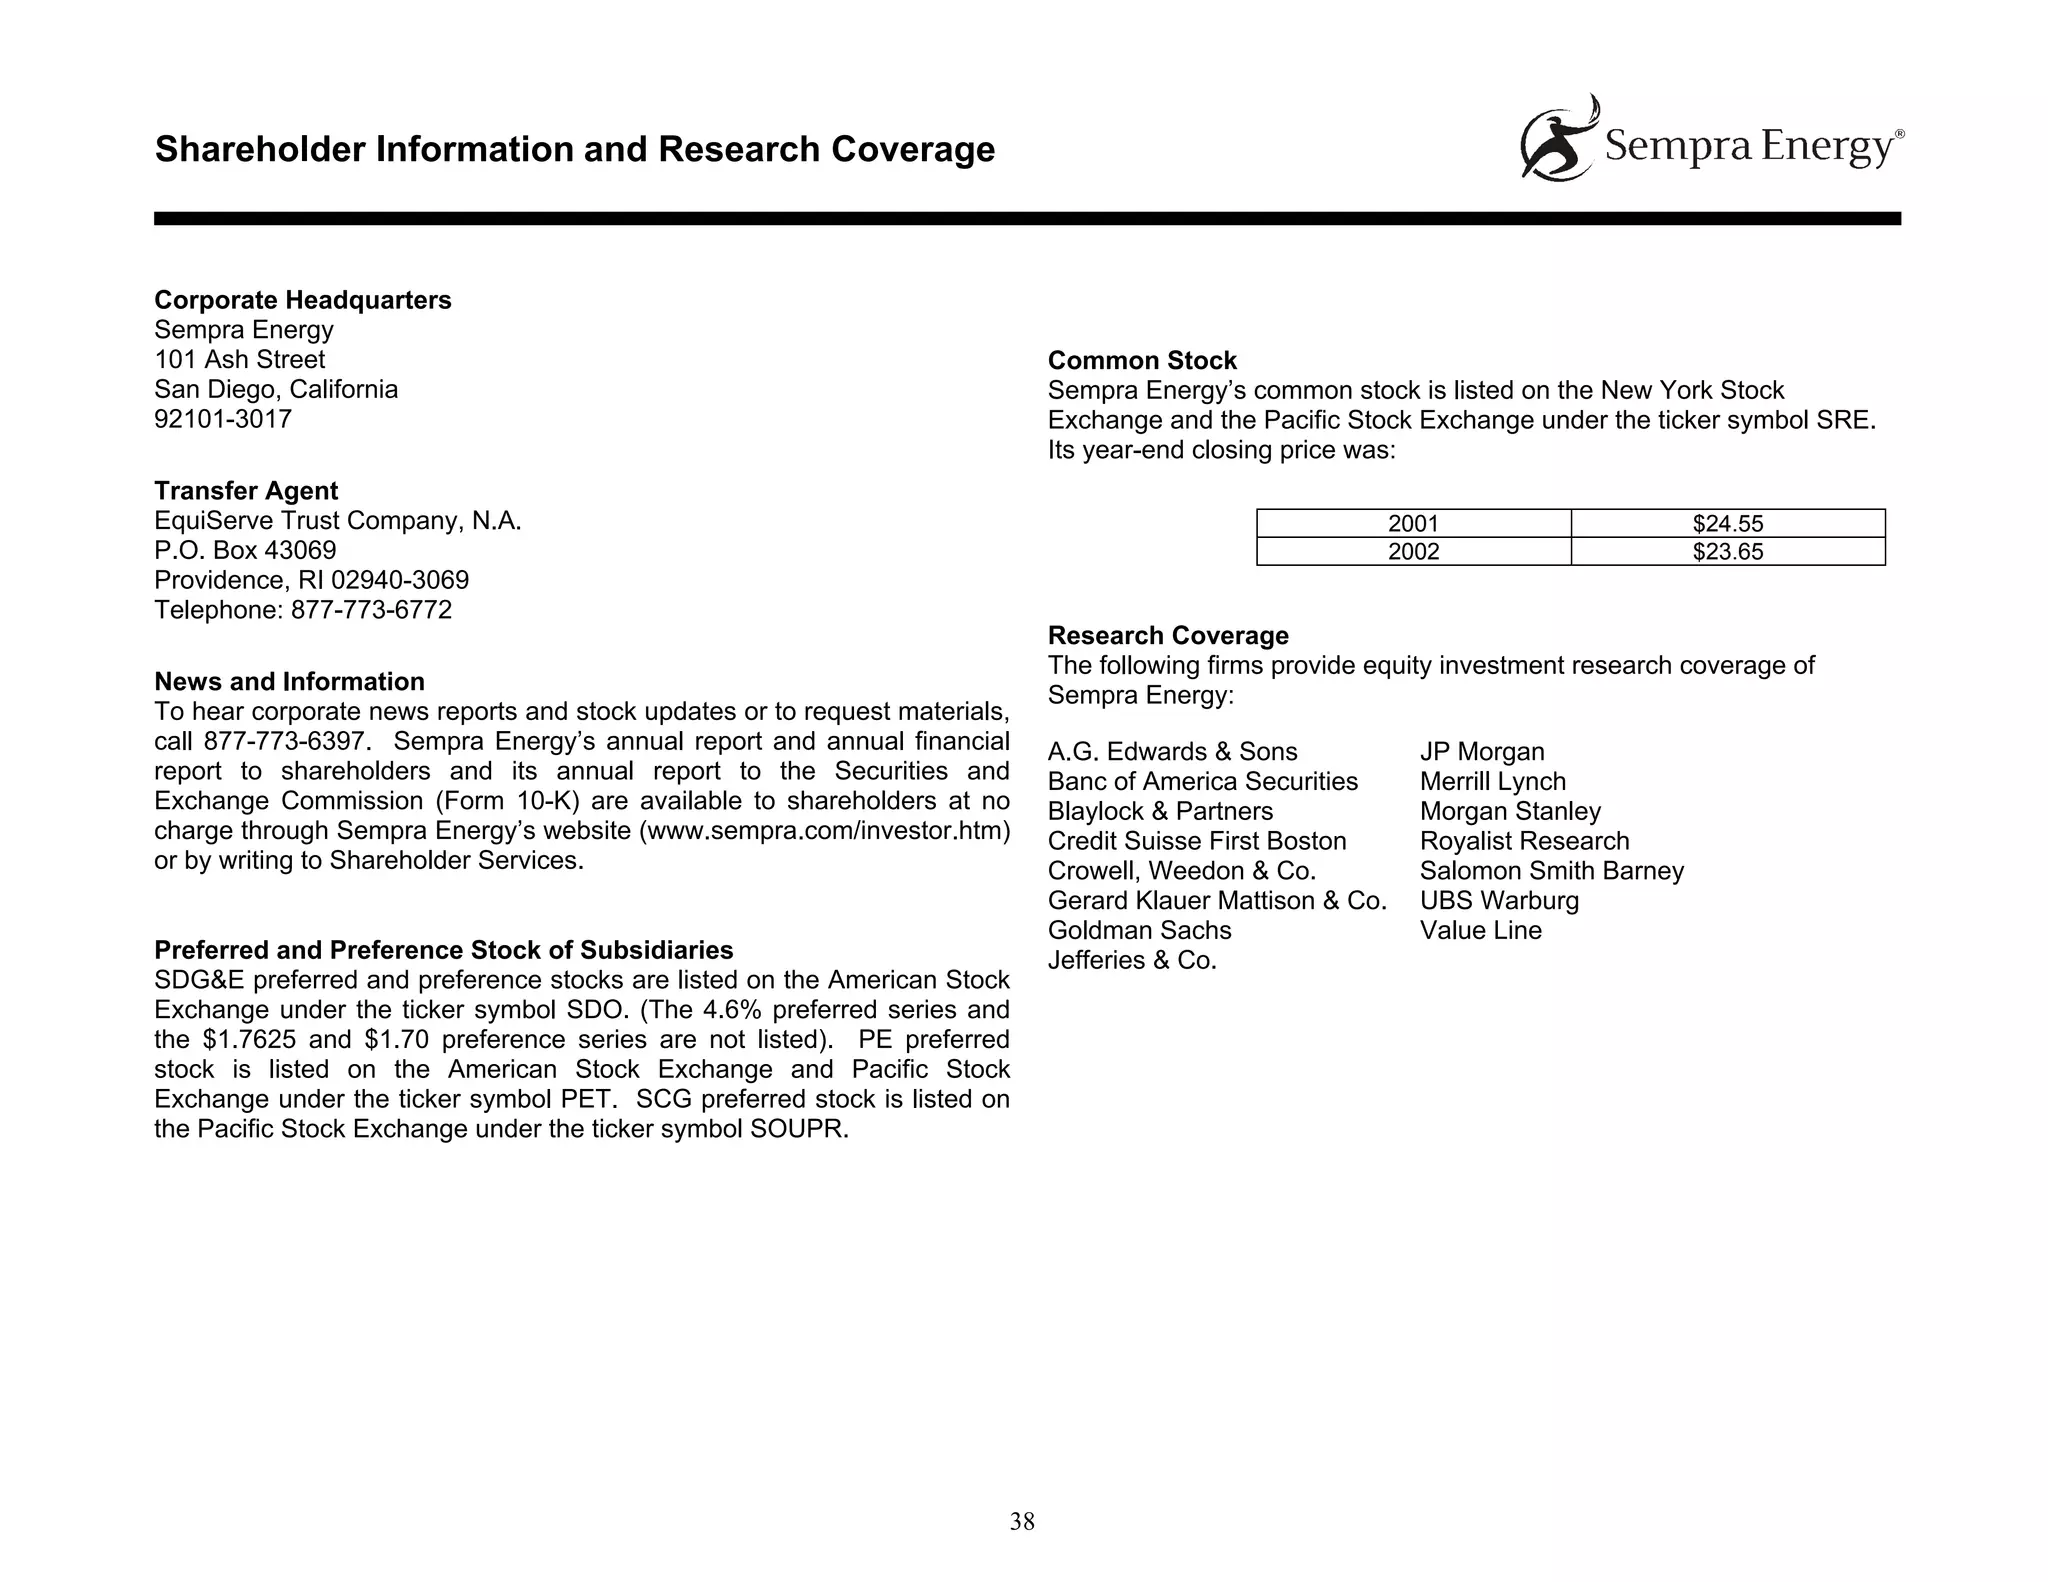

The document provides contact information for shareholders of Sempra Energy and its subsidiaries regarding general questions, investor relations, and stock exchange listings. Sempra Energy is a Fortune 500 energy services holding company based in San Diego with over $6 billion in annual revenues and 12,000 employees. It operates utilities and energy businesses that serve over 9 million customers across North America, Europe, Asia, and South America.


