Downloaded 15 times


![Semiconductors
ARA (Nov’15)- © 2015 - 34
ARA Research
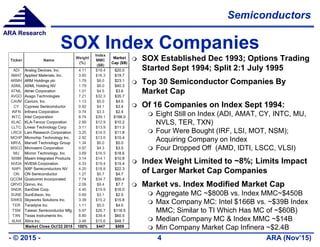
Index Volatility
Basic Definition:
Standard Deviation of Historical Returns
Basically a “Dispersion” Measure; Greater Dispersion (Volatility) Implies Greater Risk
Upside & Downside Price Movements Are Equally Considered in the Volatility
Calculation; The Sortino Ratio Attempts to Capture Just Downside Volatility
Calculation
Step 1) Calculate Daily Periodic Stock Return (Ri) = (Pi – Pi-1)/Pi ; Where Pi is Current
Day’s Closing Price and Pi-1 is Closing Price on Previous Day
More Often Ri = Ln(Pi/Pi-1) is Used as it Better Represents a Continuously
Compounded Return; Approximately The Same For Most Short Intervals
This was the Method Employed in This Study
Step 2) Decide on Time Period; Volatility for Both the Full 20 Year (1994 – 2014) as Well
as 5 Year Intervals Was Calculated for The 3 Indices Examined in This Study
Step 3) Calculate Daily Sample Variance = [ Sum(Pi-1 – Avg P)2 ] / (m-1); Where ‘m’ =
Number of Sample Data Points Over Which The Sum is Performed
Step 4) Calculate Annualized Sample Volatility = Sqrt (Sample Variance) x Sqrt (250);
250 Being The Number of Trading Days in a Typical Year
Note: To Calculate Annualized Weekly or Monthly Volatility Multiply The
Corresponding Weekly or Monthly Volatility By Sqrt(52) or Sqrt(12) Respectively;
The Calculated Volatility Will Be Slightly Different in Each Case](https://image.slidesharecdn.com/soxindexanalysisara151123-151123203915-lva1-app6892/85/Semiconductor-Index-SOX-Analysis-34-320.jpg)

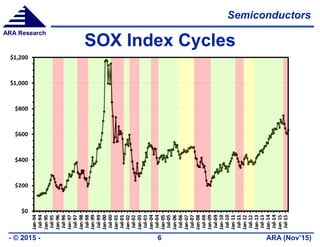
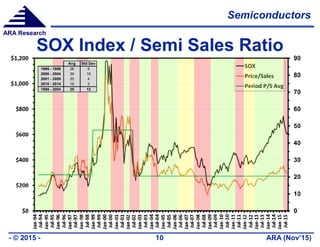
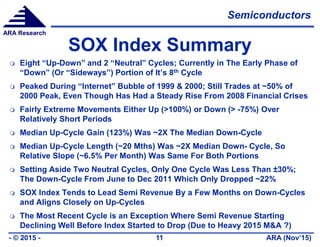
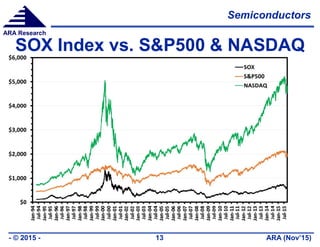
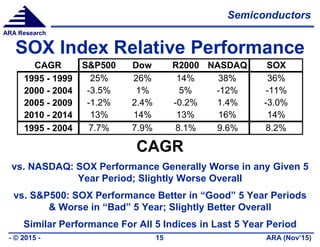
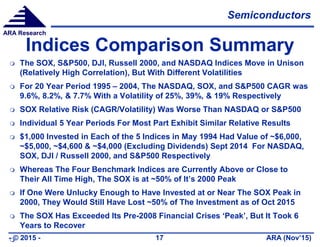
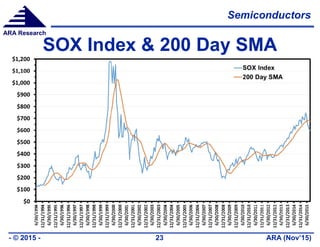
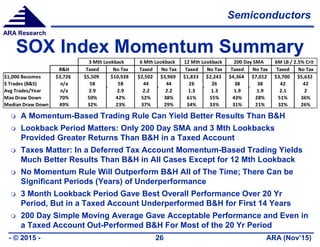
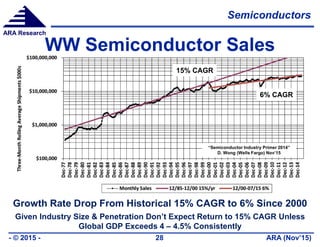
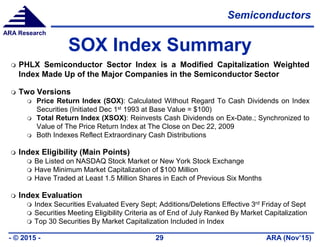
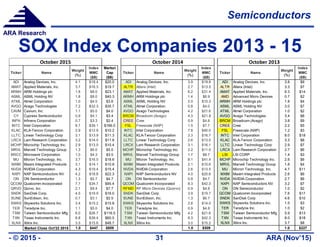
The document provides an analysis of the Philadelphia Semiconductor Sector (SOX) Index, detailing its history, performance relative to benchmarks, and momentum analysis for investment strategies. It discusses the cyclical nature of the index, its volatility compared to other major indices, and the impact of different trading strategies on returns. The findings suggest that a momentum-based trading approach can yield better results than a simple buy-and-hold strategy, particularly over specific lookback periods.


