Download to read offline


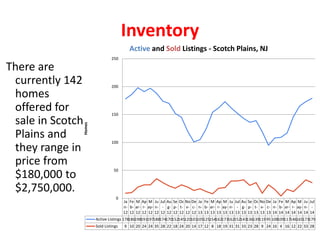
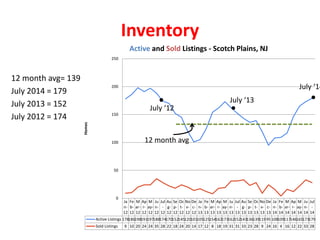
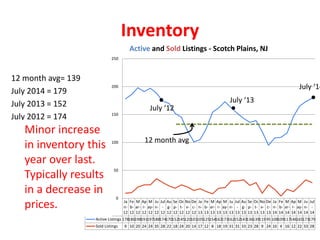
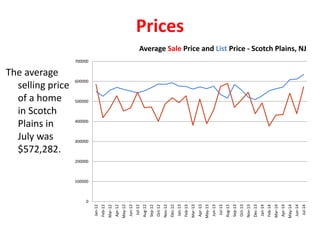
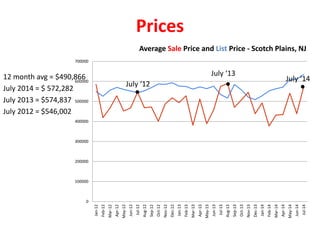
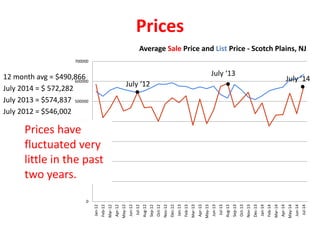


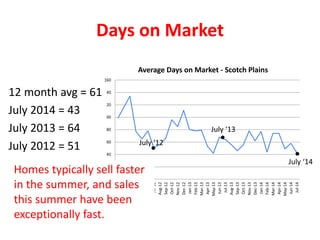


As of July 2014, the Scotch Plains real estate market has 142 homes for sale, with prices ranging from $180,000 to $2,750,000, and an average selling price of $572,282. Inventory has increased slightly from the previous year, and homes are selling faster, with an average of 43 days on the market. Buyers and sellers are advised to take advantage of the stable prices and high competition by ensuring homes are well-prepared and priced appropriately.


