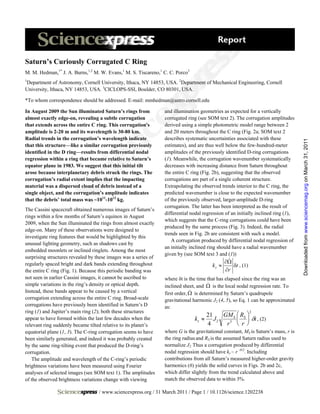
The Search Of Nine Planet, Pluto (Artigo Histórico)
Science 2011-hedman-science.1202238
1. Saturn’s Curiously Corrugated C Ring
M. M. Hedman,1* J. A. Burns,1,2 M. W. Evans,1 M. S. Tiscareno,1 C. C. Porco3
1
Department of Astronomy, Cornell University, Ithaca, NY 14853, USA. 2Department of Mechanical Engineering, Cornell
University, Ithaca, NY 14853, USA. 3CICLOPS-SSI, Boulder, CO 80301, USA.
*To whom correspondence should be addressed. E-mail: mmhedman@astro.cornell.edu
In August 2009 the Sun illuminated Saturn’s rings from and illumination geometries as expected for a vertically
almost exactly edge-on, revealing a subtle corrugation corrugated ring (see SOM text 2). The corrugation amplitudes
that extends across the entire C ring. This corrugation's derived using a simple photometric model range between 2
amplitude is 2-20 m and its wavelength is 30-80 km. and 20 meters throughout the C ring (Fig. 2a; SOM text 2
Radial trends in the corrugation’s wavelength indicate describes systematic uncertainties associated with these
Downloaded from www.sciencemag.org on March 31, 2011
that this structure—like a similar corrugation previously estimates), and are thus well below the few-hundred-meter
identified in the D ring—results from differential nodal amplitudes of the previously identified D-ring corrugations
regression within a ring that became relative to Saturn’s (1). Meanwhile, the corrugation wavenumber systematically
equator plane in 1983. We suggest that this initial tilt decreases with increasing distance from Saturn throughout
arose because interplanetary debris struck the rings. The the entire C ring (Fig. 2b), suggesting that the observed
corrugation’s radial extent implies that the impacting corrugations are part of a single coherent structure.
material was a dispersed cloud of debris instead of a Extrapolating the observed trends interior to the C ring, the
single object, and the corrugation’s amplitude indicates predicted wavenumber is close to the expected wavenumber
that the debris’ total mass was ~1011-1013 kg. of the previously observed, larger-amplitude D-ring
corrugation. The latter has been interpreted as the result of
The Cassini spacecraft obtained numerous images of Saturn’s
differential nodal regression of an initially inclined ring (1),
rings within a few months of Saturn’s equinox in August
which suggests that the C-ring corrugations could have been
2009, when the Sun illuminated the rings from almost exactly
produced by the same process (Fig. 3). Indeed, the radial
edge-on. Many of these observations were designed to
trends seen in Fig. 2b are consistent with such a model.
investigate ring features that would be highlighted by this
A corrugation produced by differential nodal regression of
unusual lighting geometry, such as shadows cast by
an initially inclined ring should have a radial wavenumber
embedded moonlets or inclined ringlets. Among the most
given by (see SOM text 3 and (1))
surprising structures revealed by these images was a series of
regularly spaced bright and dark bands extending throughout ∂Ω
kz ≈ δt , (1)
the entire C ring (Fig. 1). Because this periodic banding was ∂r
not seen in earlier Cassini images, it cannot be ascribed to where δt is the time that has elapsed since the ring was an
simple variations in the ring’s density or optical depth. inclined sheet, and Ω is the local nodal regression rate. To
Instead, these bands appear to be caused by a vertical first order, Ω is determined by Saturn’s quadrupole
corrugation extending across the entire C ring. Broad-scale gravitational harmonic J2 (4, 5), so Eq. 1 can be approximated
corrugations have previously been identified in Saturn’s D as:
ring (1) and Jupiter’s main ring (2); both these structures 2
21 GM S ⎛ RS ⎞
appear to have formed within the last few decades when the kz ≈ J 2 ⎜ ⎟ δt , (2)
relevant ring suddenly became tilted relative to its planet’s 4 r5 ⎝ r ⎠
equatorial plane (1, 3). The C-ring corrugation seems to have where G is the gravitational constant, MS is Saturn’s mass, r is
been similarly generated, and indeed it was probably created the ring radius and RS is the assumed Saturn radius used to
by the same ring-tilting event that produced the D-ring’s normalize J2. Thus a corrugation produced by differential
corrugation. nodal regression should have kz ~ r -9/2. Including
The amplitude and wavelength of the C-ring’s periodic contributions from all Saturn’s measured higher-order gravity
brightness variations have been measured using Fourier harmonics (6) yields the solid curves in Figs. 2b and 2c,
analyses of selected images (see SOM text 1). The amplitudes which differ slightly from the trend calculated above and
of the observed brightness variations change with viewing match the observed data to within 3%.
/ www.sciencexpress.org / 31 March 2011 / Page 1 / 10.1126/science.1202238
2. The largest deviations from this model include a quasi- to Saturn’s equator plane by an angle δθ between 2*10-8 and
periodic wavenumber modulation in the middle C ring and a 3*10-7 radians. Assuming a ring surface mass density of ~5
cluster of low wavenumber values in the outermost C ring (r g/cm2 (see above), the ring’s angular momentum would need
> 90,000 km, Fig. 2c). These residuals are correlated with the to re-orient by δLr ~ 1023 kg m2/s to produce this tilt. While a
optical depth structure of the ring (compare Figs. 2c and 2e), reasonably dense (~1 g/cm3) 1-km-wide object traveling at
and can be ascribed to the C-ring’s finite surface mass density typical impact speeds through the rings (~40 km/s,
σ. The ring’s gravity modifies the local nodal regression rates, comparable to the escape speed from Saturn) would carry
producing perturbations to the corrugation wavenumber: sufficient angular momentum to produce the required δLr, it is
δk z πG ⎛ ∂σ 3σ ⎞ unlikely that an intact comet or meteoroid could have
= ⎜− + ⎟δt , (3) produced a feature as radially extensive as the observed
kz 2ν ⎝ ∂r r ⎠
corrugation. A compact object ~1 km across passing through
where ν is the vertical epicyclic frequency (see SOM text 3).
the C ring would only interact with a small patch of the rings
If we assume the ring’s optical depth τ is proportional to its
containing ~10-3 the mass of the impactor, so any debris from
surface mass density σ, then the largest negative residuals in
this collision would follow essentially the same trajectory as
the corrugation wavenumber should occur where the optical
the pre-impact projectile. Thus most of the incoming object’s
depth has the most positive slope and vice versa, as observed.
momentum would escape in the debris from the collision and
Furthermore, the magnitude of the measured residuals would
not be imparted to the rings, and no large-scale tilt would be
require that the middle C-ring has σ~3-6 g/cm2 (see SOM text
Downloaded from www.sciencemag.org on March 31, 2011
established. However, if the rings encountered a diffuse cloud
4), consistent with previous estimates (7, 8).
of debris instead of a single solid object, then material would
If we only consider regions where the predicted δkz/kz
have rained down across a range of radii, producing a tilt that
caused by the ring’s self-gravity is less than 0.2% (Fig. 2d and
could ultimately form an extensive corrugation. The incoming
SOM text 5), the wavelength estimates are fully consistent
debris would also interact with a much larger area of the rings
with predicted trends based on current estimates of Saturn’s
and a much greater mass of ring material, so more of the
gravity field (6). We may therefore use Eq. 1 to determine
momentum carried by the debris should remain in the ring
how long ago the C-ring was a simple inclined sheet: Julian
instead of departing from the Saturn system. Such a scenario
Date 2445598±40, or Day 263±40 of 1983 (9). This is within
could even explain the differences in the corrugation
a year of the inclined sheet epoch derived from the previously
amplitudes between the C and D rings. Assuming the
observed temporal variations in the D-ring’s corrugation
momenta from the incoming particles are efficiently
wavelength (1), and the difference between the two estimates
transferred to the rings (see SOM text 7), the tilt induced by a
may be attributed to the excess variance in the D-ring
given debris flux should be directly proportional to the ring
wavelength estimates derived from images taken in different
particles’ aggregate cross section and inversely proportional
viewing geometries (1). It is therefore reasonable to conclude
to their total mass. The larger amplitude of the D-ring
that the corrugations in both the C and D rings were
corrugation could therefore arise simply because of the sub-
generated by the same ring-tilting event.
millimeter-wide particles in the D ring (1) have much higher
Saturn was near solar conjunction during the latter half of
surface-area-to-volume ratios than the centimeter-to-meter-
1983, and thus could not be seen clearly from Earth. Archived
sized C-ring particles (10).
images therefore cannot provide direct information about any
The viability of this explanation for the ring’s initial tilt
event that might have caused the rings to become tilted
can be evaluated by estimating the total debris mass required
relative to Saturn’s gravitational equator. However, any
to produce the observed corrugations. For rings of modest
acceptable scenario must be able to produce a tilt across a
optical depth like the C ring, the angular momentum
wide swath of the ring in a short period of time compared to
delivered into the rings by a debris cloud of mass mc can be
the local orbital precession periods (which range between two
expressed as:
weeks to one month). Preliminary calculations suggest that
Lc=DF τ mc vc r, (4)
Saturn’s equator is unlikely to shift appropriately due to
where vc is the mean impact speed of the incoming material, r
either external torques on Saturn or mass redistribution within
and τ are at the orbital radius and normal optical depth of the
the planet (see SOM text 6). Furthermore, recent analyses of
ring and DF is a dimensionless parameter that depends on the
Galileo data indicate that Jupiter’s rings became tilted around
longitudinal distribution of the impacting material. For a
the time comet Shoemaker-Levy 9 struck the planet in 1994
homogeneous debris cloud, DF ~ 0.1 for a wide range of
(3). We therefore investigate scenarios in which the rings
plausible approach trajectories and speeds (see SOM text 7),
became tilted relative to Saturn’s equator plane due to
and it could be higher if the cloud has substantial
interplanetary debris impacting the rings in 1983.
substructure. Assuming DF lies between 1 and 0.01, and
The estimated corrugation amplitudes in the C ring (Fig.
further stipulating that Lc ≈ δLr ~ 1023 kg m2/s, vc ≈ 40 km/s
2a) indicate that the entire C ring was initially tilted relative
/ www.sciencexpress.org / 31 March 2011 / Page 2 / 10.1126/science.1202238
3. and τ ~ 0.1 (Fig. 2e), we find that the total mass of the debris 7. H.A. Zebker, E.A. Marouf, G.L. Tyler, Saturn’s rings -
cloud would need to be 1011-1013 kg in order to produce the Particle size distributions for thin layer model. Icarus 64,
observed C-ring corrugation. 531-548 (1985).
Debris clouds with masses of order 1012 kg were produced 8. P.A. Rosen, G.L. Tyler, E.A. Marouf, J.J. Lissauer,
during the break-up of Shoemaker-Levy 9 in 1992 (11, 12) Resonance structures in Saturn’s rings probed by radio
and the major outburst of comet 17P/Holmes in 2007 (13). occultation. II - Results and interpretation. Icarus 93, 25-
The rate at which Saturn would encounter such massive 44 (1991).
clouds is quite uncertain, but let us consider the specific 9. The error estimate includes ±10 days of statistical error,
scenario where a 1-km wide comet nucleus was captured into ±13 days uncertainty from the published estimate of J6 (5),
orbit around Saturn, broke apart during a close periapse (due ±13 days from allowing J8 to range between 0 and
to planetary tides or a collision with the rings), producing ~ -0.00001, and ±5 days that depends on whether the
1012 kg of debris on bound orbits that crashed into the rings wavenumbers are corrected for the ring’s predicted mass.
on a later periapse (14). While the rate at which captured Additional uncertainty could be introduced if J10 and
cometary debris impacts Saturn has not yet been thoroughly higher-order terms in Saturn’s gravity field are sufficiently
investigated in numerical simulations, existing studies large.
indicate that roughly 4% of the comets that impact Jupiter had 10. J.N. Cuzzi, et al. in Saturn From Cassini-Huygens, M.K.
previously passed close enough to the planet to be disrupted Dougherty, L.W. Esposito, & S,M. Krimigis, Eds.
Downloaded from www.sciencemag.org on March 31, 2011
(15), the impact flux at Saturn is about 40% the flux at Jupiter (Springer, New York, 2009), pp. 459--509.
(16, 17), and the fraction of impactors on bound orbits is 11. J.V. Scotti, H.J. Melosh, Estimate of the size of comet
about an order of magnitude less for Saturn than it is for Shoemaker-Levy 9 from a tidal breakup model. Nature
Jupiter (18, 19, 20). Together, these results indicate that 365, 733-735 (1993).
Saturn should encounter debris clouds derived from comets 12. E. Asphaug, W. Benz, Size, Density, and Structure of
disrupted by previous planetary encounters at a rate that is Comet Shoemaker-Levy 9 Inferred from the Physics of
roughly 0.2% of Jupiter’s impact rate. The 2009 detection of Tidal Breakup. Icarus 121, 225-248 (1996).
a fresh impact scar at Jupiter suggests that 1-km-wide objects 13. M. Montalto, A. Riffeser, U. Hopp, S. Wilke, G. Carraro,
may strike Jupiter as often as once a decade (21). In this case, The comet 17P/Holmes 2007 outburst: the early motion of
the clouds of orbiting debris created by the disruption of a 1- the outburst material. A&A 479, L45-L49 (2008).
km-wide comet should rain down on Saturn’s rings once 14. Scenarios in which the debris from the disrupted comet
every 5,000-10,000 years. The probability that debris from a hits the rings before it can leave the inner Saturn system
previously disrupted comet would hit Saturn’s rings in the are explored in SOM text 8 and are found to be less
last 30 years would then be between roughly 1% and 0.1%, probable.
which is not very small. Such scenarios therefore provide a 15. D.M. Kary, L. Dones, Capture statistics of short-period
reasonable explanation for the origin of the observed comets: Implications for comet D/Shoemaker-Levy 9.
corrugation in Saturn’s C ring. Icarus 121, 207-224 (1996).
16. H.F. Levison, M.J. Duncan, From the Kuiper Belt to
References and Notes Jupiter-Family Comets: The spatial distribution of ecliptic
1. M.M. Hedman et al., Saturn’s dynamic D ring. Icarus 188, comets. Icarus 127, 13-32 (1997).
89-107 (2007). 17. K. Zahnle, P. Schenk, H. Levison, L. Dones, Cratering
2. M.E. Ockert-Bell et al., The Structure of Jupiter’s Ring rates in the outer Solar System. Icarus 163, 263-289
System as Revealed by the Galileo Imaging Experiment. (2003).
Icarus 138, 188-213 (1999). 18. H.F. Levison, M.J. Duncan, K. Zahnle, M. Holman, L.
3. M.R. Showalter, M.M. Hedman, J.A. Burns, The impact of Dones, NOTE: Planetary impact rates from ecliptic
comet Shoemaker-Levy 9 sends ripples through the rings comets. Icarus 143, 415-420 (2000).
of Jupiter. Science 10.1126/science.1202241 (2011). 19. S. Charnoz, A. Morbidelli, L. Dones, J. Salmon, Did
4. C.D. Murray, S.F. Dermott, Solar System Dynamics Saturn’s rings form during the Late Heavy Bombardment?
(Cambridge University Press, Cambridge, UK, 1999). Icarus 199, 413-428 (2009).
5. For Saturn’s C ring, higher-order gravity harmonics J4 and 20. This rate may be conservative because none of the
J6 (6) only contribute a total of 5-10% to the nodal referenced simulations include Saturn’s rings, which could
regression rate and 10-15% to the gradient of the nodal not only disrupt incoming comets but also withdraw some
regression rate. momentum from the debris, increasing its chances of being
6. R.A. Jacobson et al., The gravity field of the Saturnian captured into orbit around Saturn.
system from satellite observations and spacecraft tracking
data. AJ 132, 2520-2526 (2006).
/ www.sciencexpress.org / 31 March 2011 / Page 3 / 10.1126/science.1202238
4. 21. A. Sánchez-Lavega, et al., The impact of a large object on -0.00001 (e) Normal optical depth profile of the C ring
Jupiter in 2009 July. ApJL 715, L155-L159 (2010). measured by the Voyager Radio Science Subsystem (obtained
22. C.C. Porco, et al., Cassini imaging science: Instrument from the Planetary Data System rings node).
characteristics and anticipated scientific investigations at
Fig. 3. Cartoon representation of how differential nodal
Saturn. Space Science Reviews 115, 363-497 (2004).
regression produces a vertical corrugation from an initially
Acknowledgments. We acknowledge the support of the ISS
inclined ring. The top image shows a simple inclined ring (the
team and the Cassini Project, as well as NASA’s Planetary
central planet is omitted for clarity), while the lower two
Geology and Geophysics and Cassini Data Analysis
images show the same ring at two later times, where the
programs. We also wish to thank M.R. Showalter, P.D.
orbital evolution of the ring particles has sheared this inclined
Nicholson, S. Charnoz, L. Dones and D.P. Hamilton for
sheet into an increasingly tightly-wound spiral corrugation.
useful conversations.
Supporting Online Material
www.sciencemag.org/cgi/content/full/science.1202238/DC1
SOM Text
Figs. S1 to S5
Tables S1 to S3
Downloaded from www.sciencemag.org on March 31, 2011
References
27 December 2010; accepted 16 March 2011
Published online 31 March 2011; 10.1126/science.1202238
Fig. 1. Mosaic of images of Saturn’s C-ring obtained during
Cassini’s orbit 117, along with close-ups of selected radial
regions showing the periodic bright and dark bands that
extend across the entire C ring. The contrast has been
adjusted in each close-up image to better show the periodic
structure. Horizontal bands within these close-ups are camera
artifacts (22).
Fig. 2. Corrugation parameters versus radius in the rings
(distance from Saturn’s spin axis) derived from three
observations taken on three different Cassini orbits around the
time of Saturn’s equinox (see SOM text 1 and 2 for analysis
procedures): (a) corrugation amplitude Az, (b) corrugation
wavenumber kz and (c) scaled corrugation wavenumber
k’z=kz/ko*(r/ro)9/2, where ko = (2π/40) km-1 ro = 80,000 km are
constants chosen to normalize k’z to approximately unity at
equinox. In these plots, each data point is computed from a
Fourier analysis of a 500-km-wide ring region, so adjacent
data points from the same observation, which are separated
by only 100 km, are not independent. No amplitudes are
plotted for the Orbit 116 data because the extremely low Sun-
opening angle during these observations complicates the
photometry (see SOM text 2). (d) Estimates of the rescaled
corrugation wavenumber on JD 2455054 at locations in the
ring where the finite mass of the ring is negligible (see SOM
text 5). The solid curves in panels (b), (c) and (d) are the
predicted wavenumber of a vertical corrugation produced by
differential nodal regression of an inclined ring that existed at
JD 2445583, assuming the standard model of Saturn’s gravity
field (5) with Jn = 0 for n > 8 . In panel (d), the dashed curve
shows a similar prediction assuming J8 = 0 instead of J8 =
/ www.sciencexpress.org / 31 March 2011 / Page 4 / 10.1126/science.1202238