Download to read offline
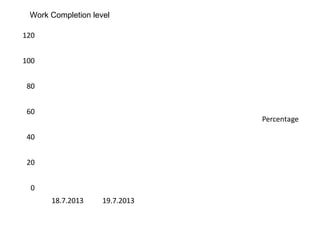

This graph shows the work completion level over two days, July 18th and 19th. On the 18th, work completion was at 20% by midday and reached 40% by the end of the day. The next day, July 19th, work completion started at 40% and steadily increased to 60% by midday and 100% by the end of the day, showing progress on the project over the two days.

![[2019 trend report]_2019_beauty trend_5](https://cdn.slidesharecdn.com/ss_thumbnails/2019trendreport2019beautytrend5-191017095527-thumbnail.jpg?width=640&height=640&fit=bounds)


