Download as PDF, PPTX


![TvM Revenues and EBITDA incl. Hitta
are already significant
Revenues and EBITDA, Schibsted Tillväxtmedier
[MNOK]
835
CAGR 08-11:
+36%
To get back,
656
511
335
101 117
25
-18
2008 2009 2010 2011
Revenues EBITDA
SIFICED’ via
icking off the
16](https://image.slidesharecdn.com/schibsted-120603175736-phpapp02/85/Schibsted-2012-126-320.jpg)


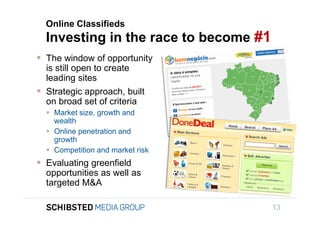
The agenda outlines a board meeting for Schibsted discussing the company's strategic direction and various business areas. The meeting will include opening remarks from the Chairman, a presentation by the CEO on strategic direction, and presentations from the heads of Schibsted Classified Media, various classifieds sites, Media Houses Scandinavia, and the CFO. There will also be Q&A sessions throughout. The dinner following the meeting will take place at the Andaz Hotel.