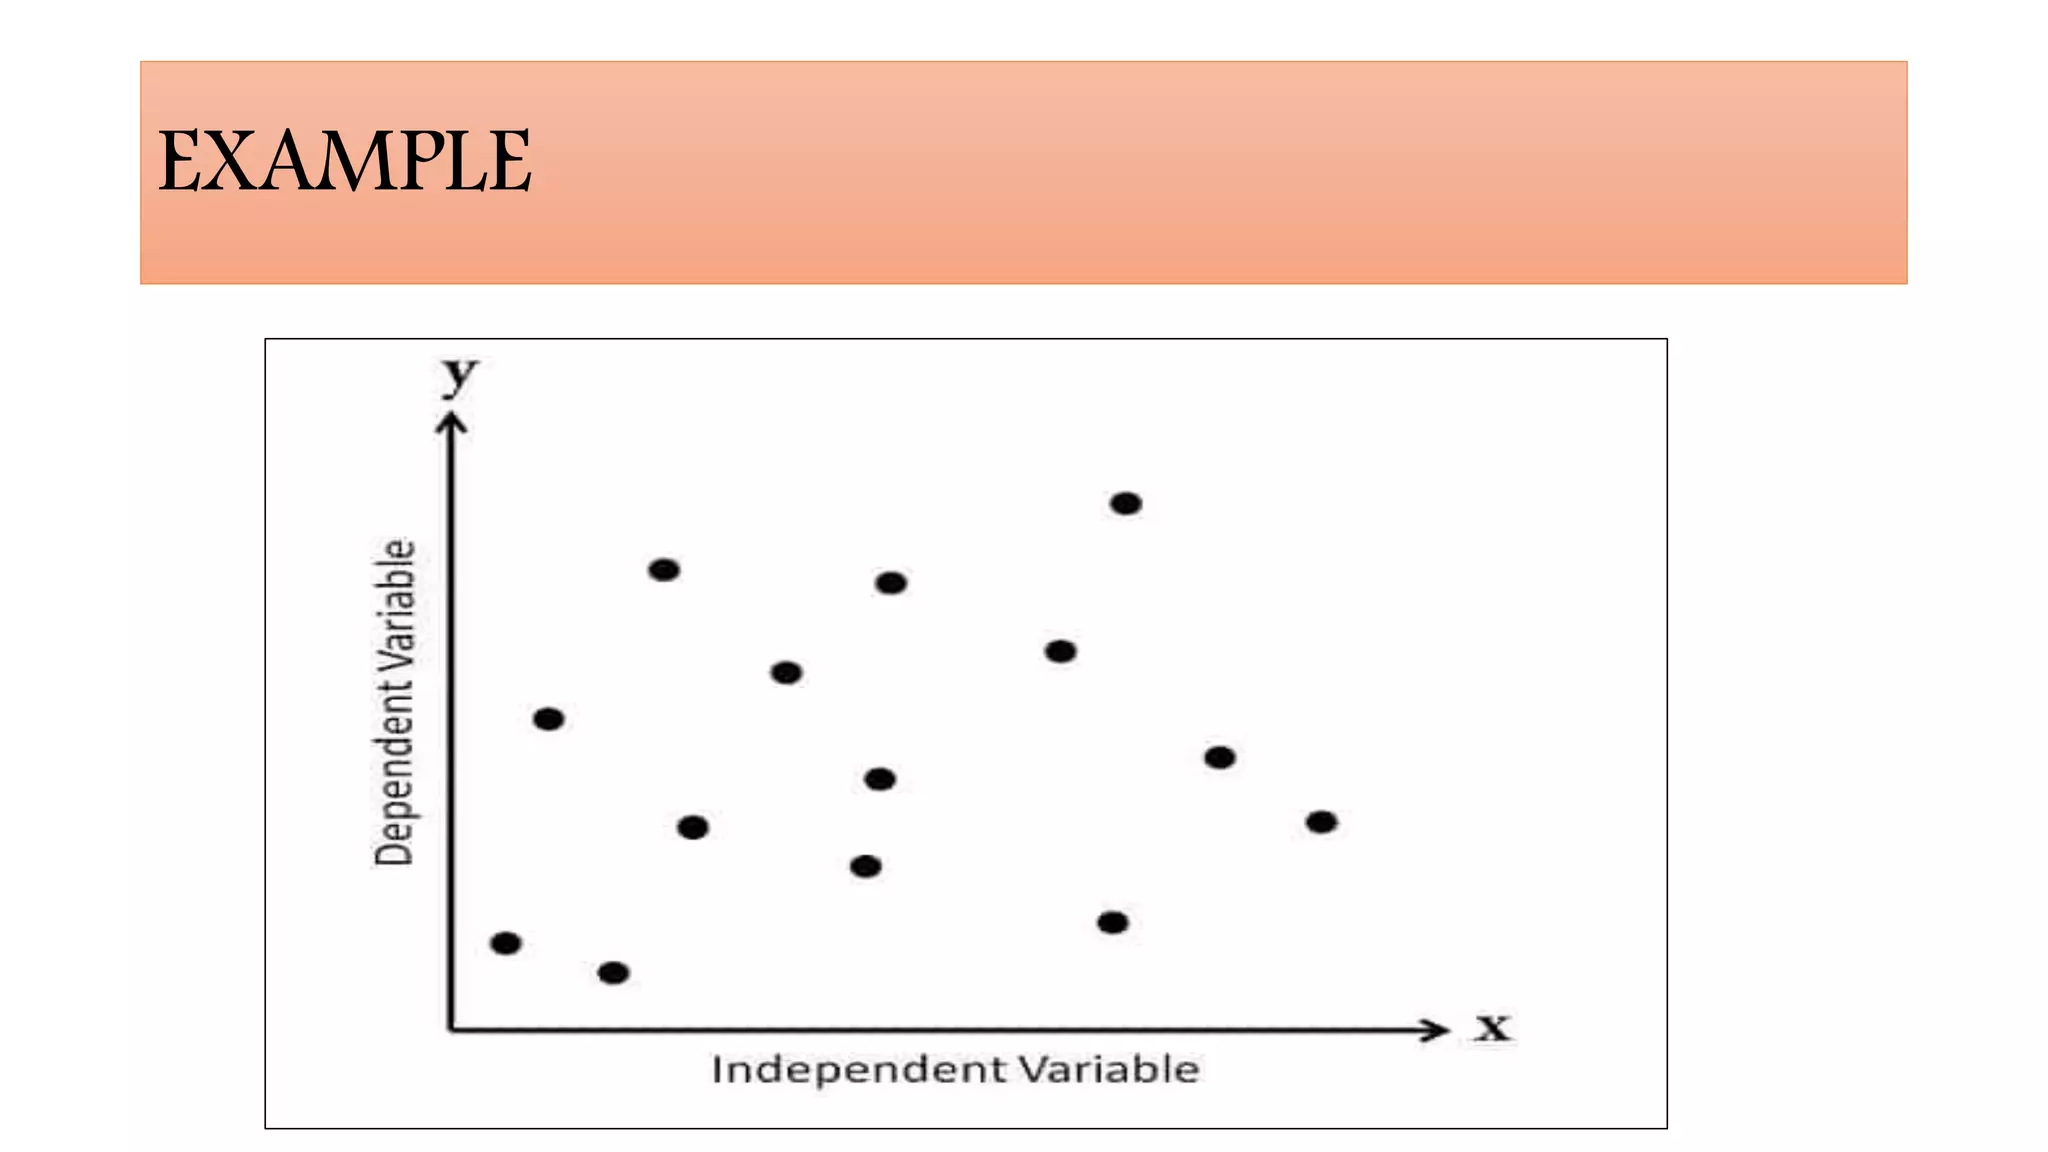
This document discusses scatter diagrams, which plot the relationship between two variables. Scatter diagrams can show no correlation, moderate correlation, or strong correlation between variables. They are useful when one variable is easy to measure and the other is not, as they help determine the relationship between variables and allow prediction of one based on the other. However, scatter diagrams do not provide an exact measure of correlation or show relationships between more than two variables.