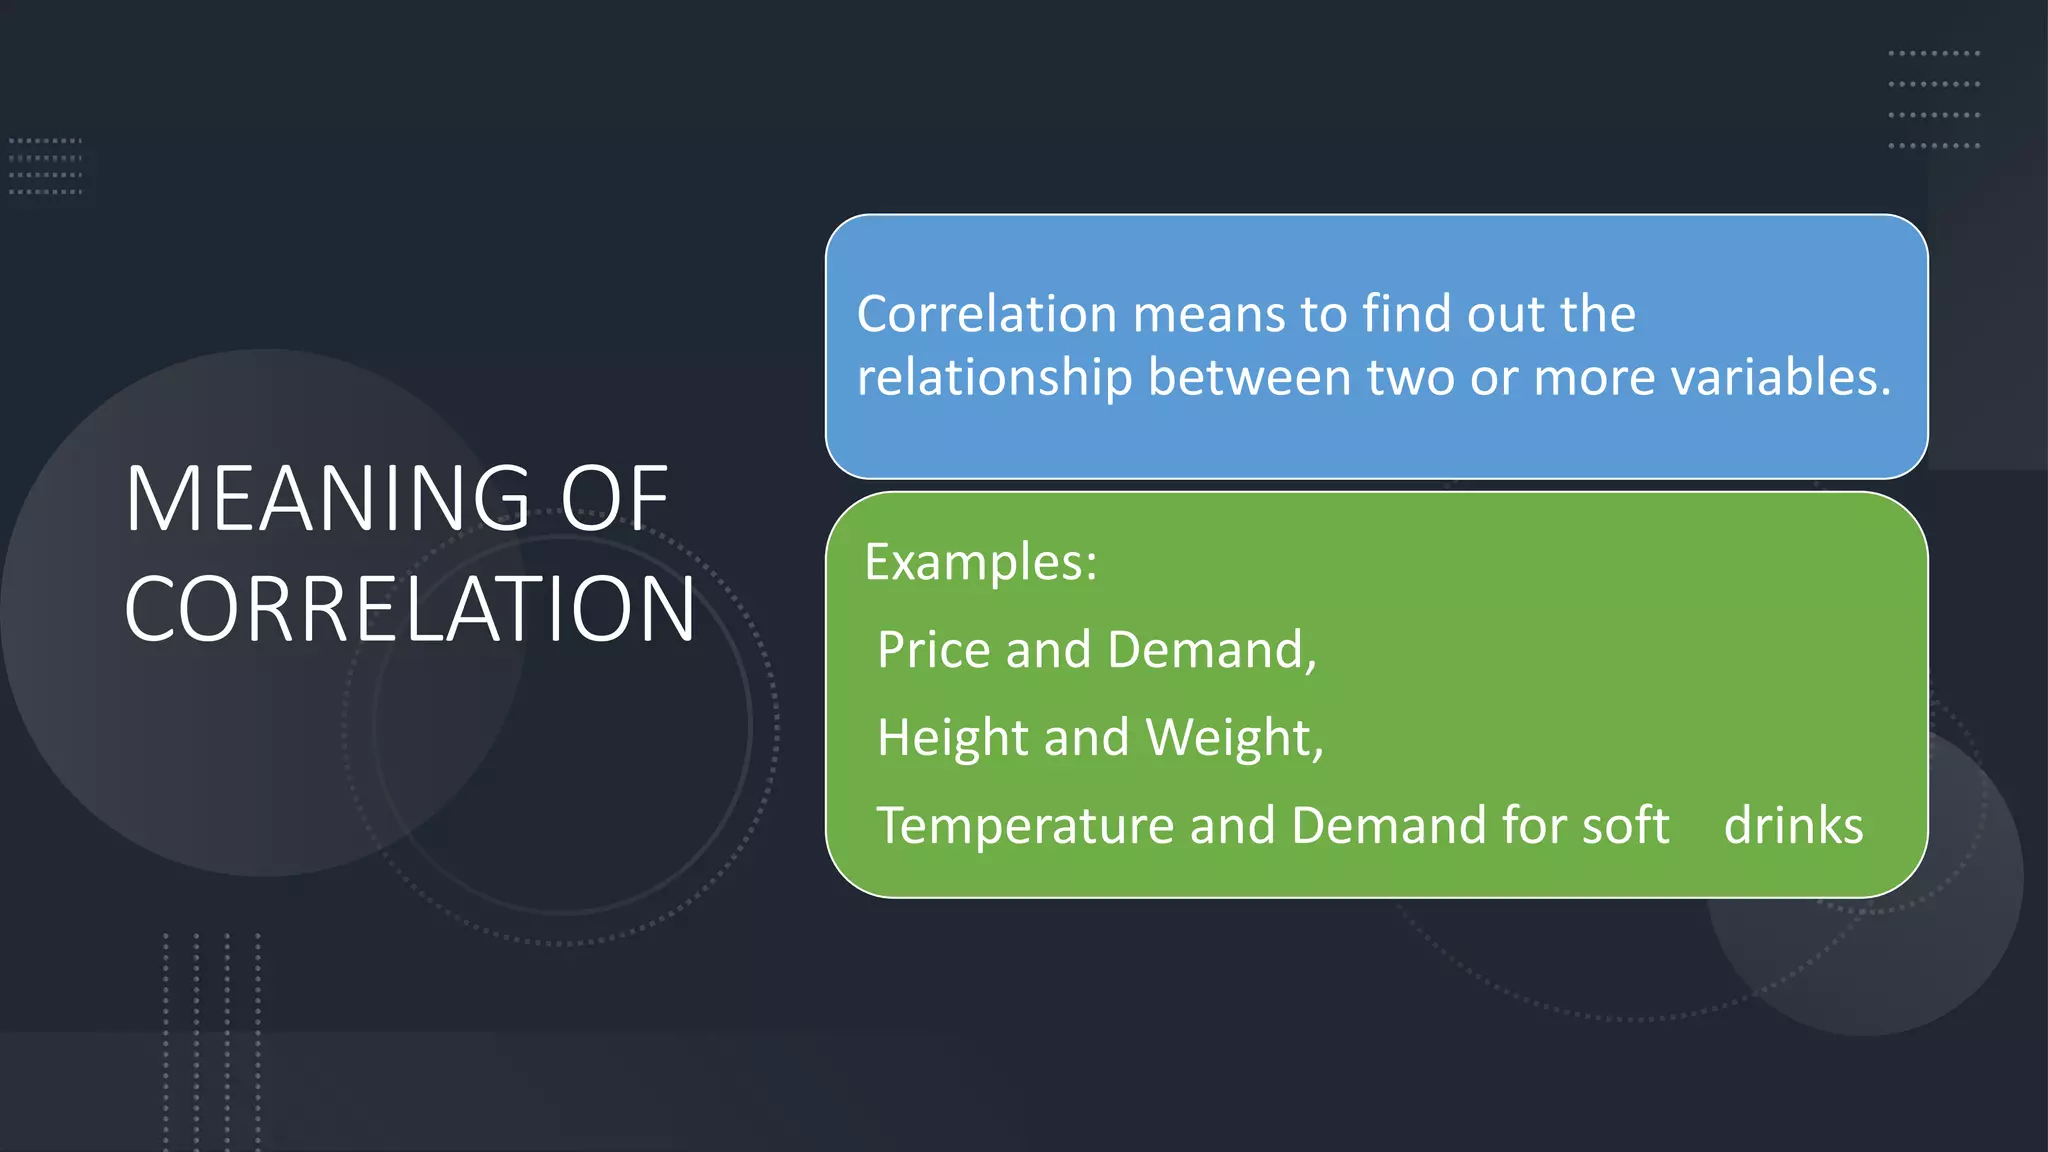
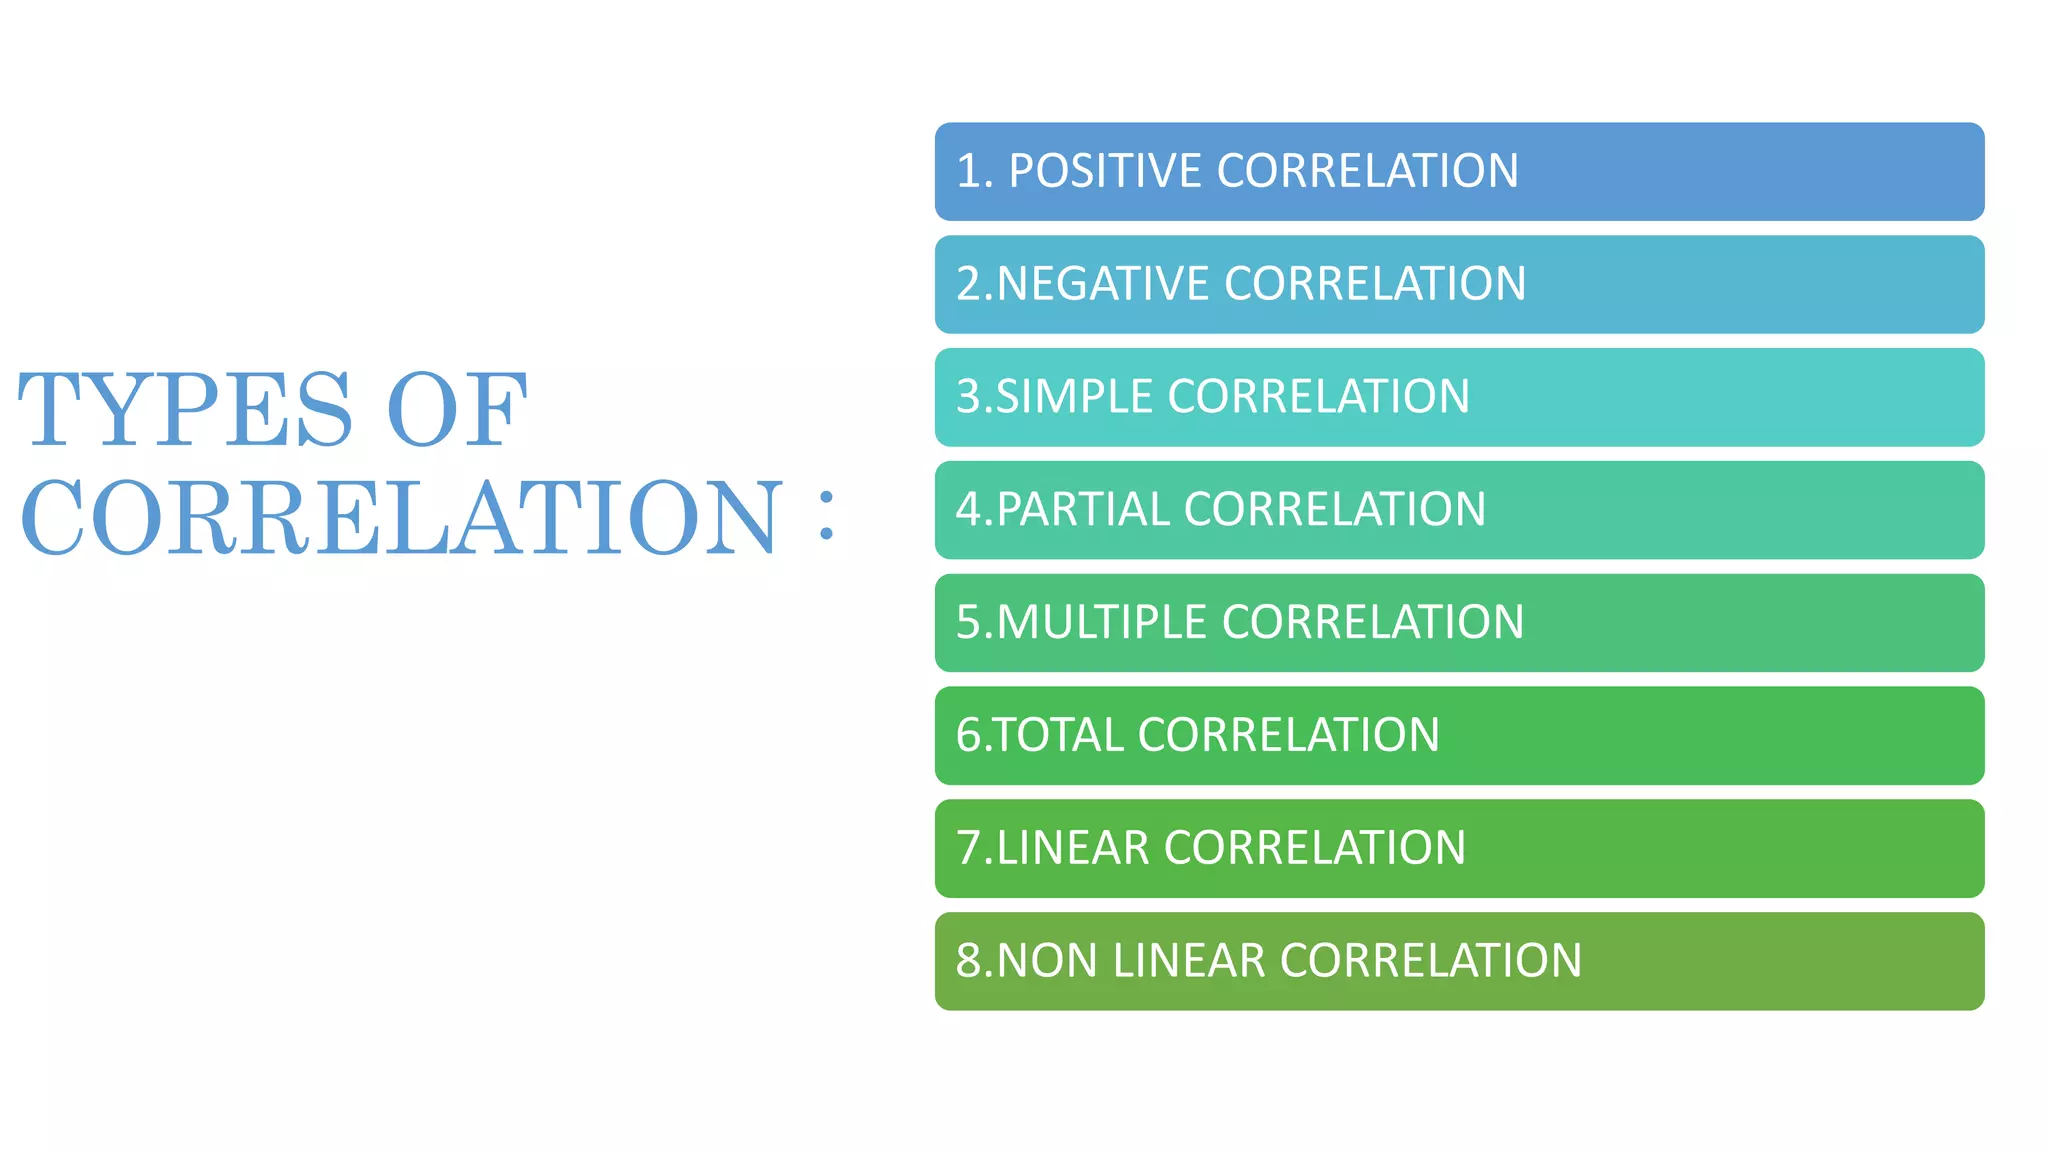
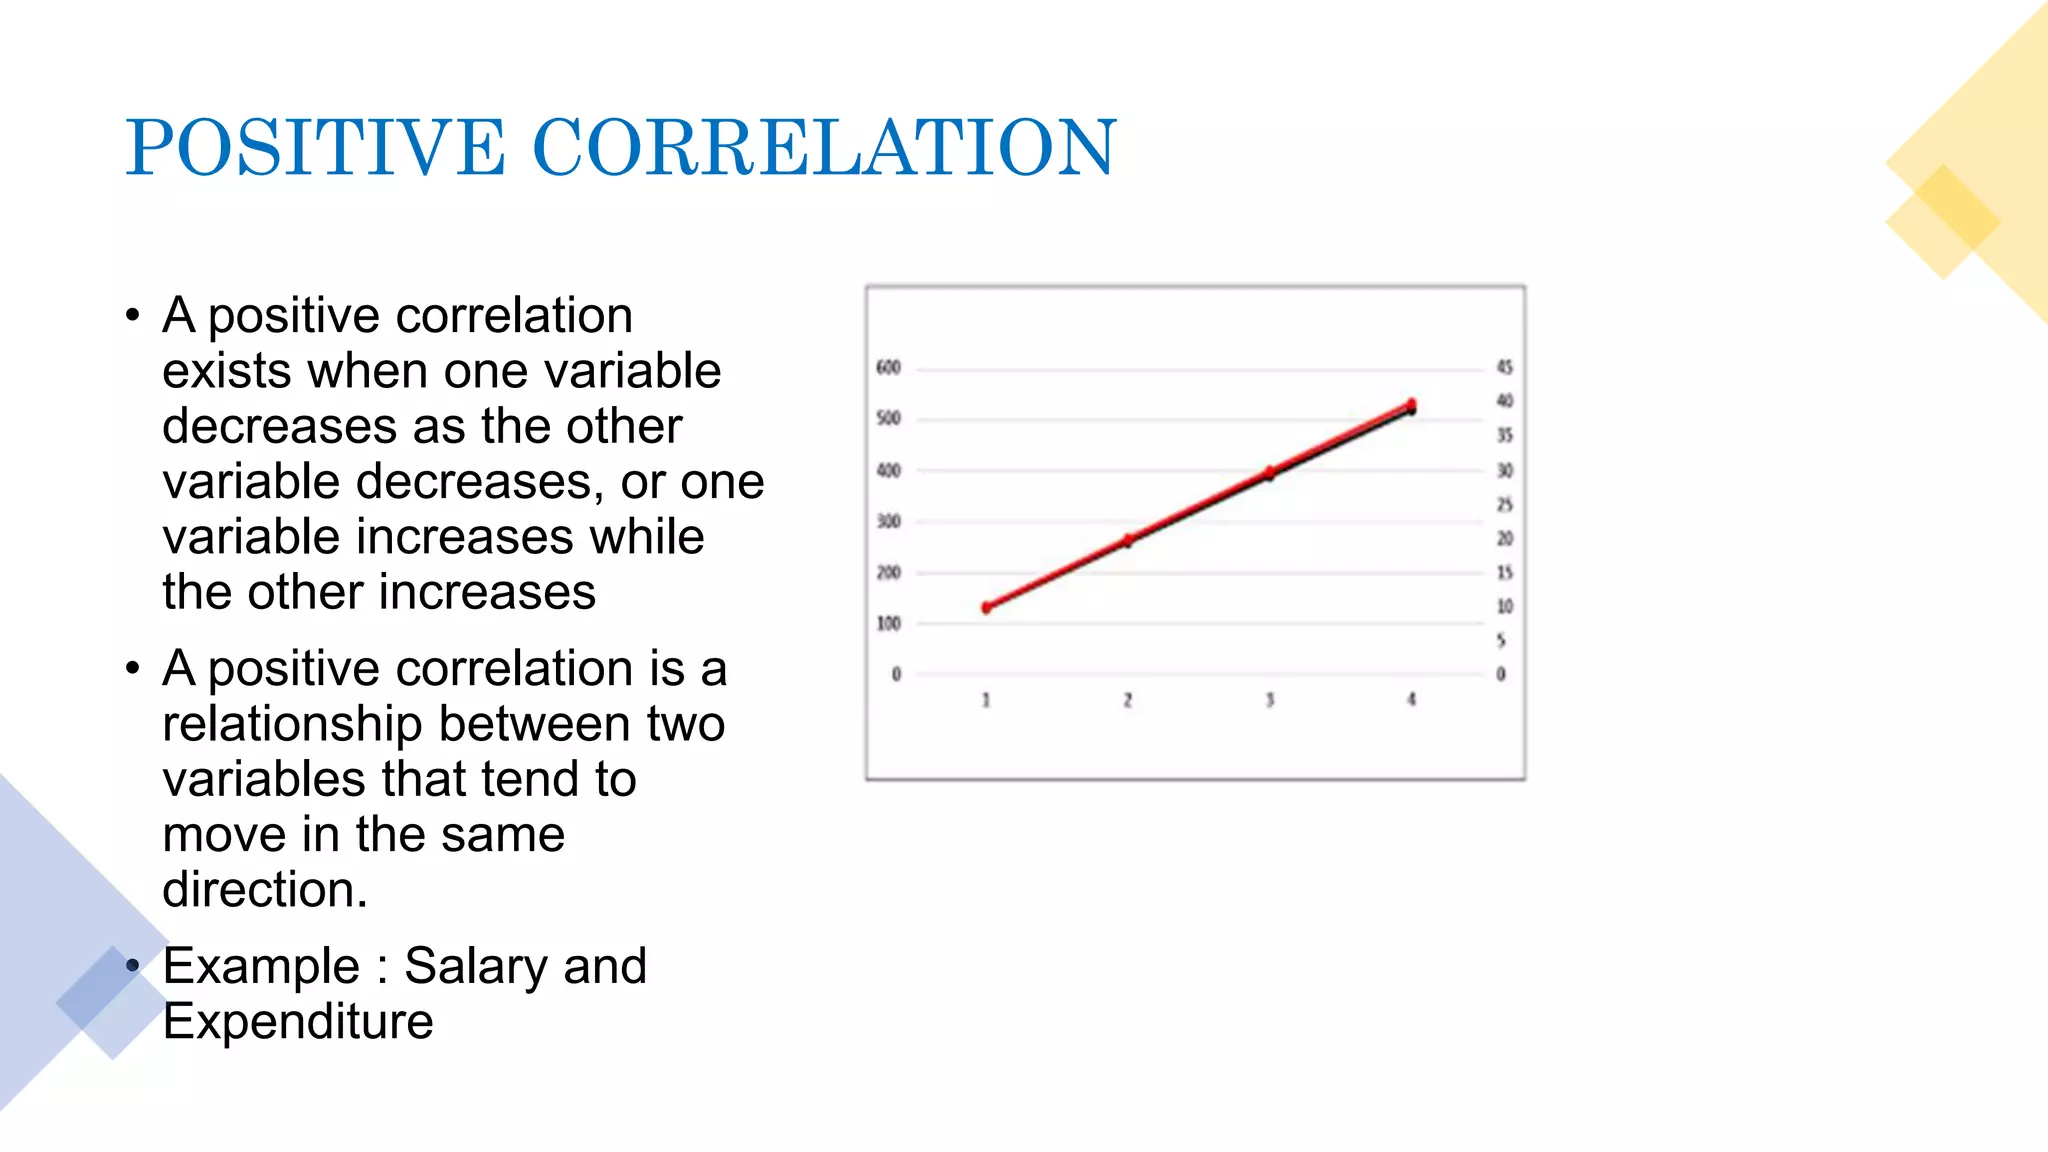
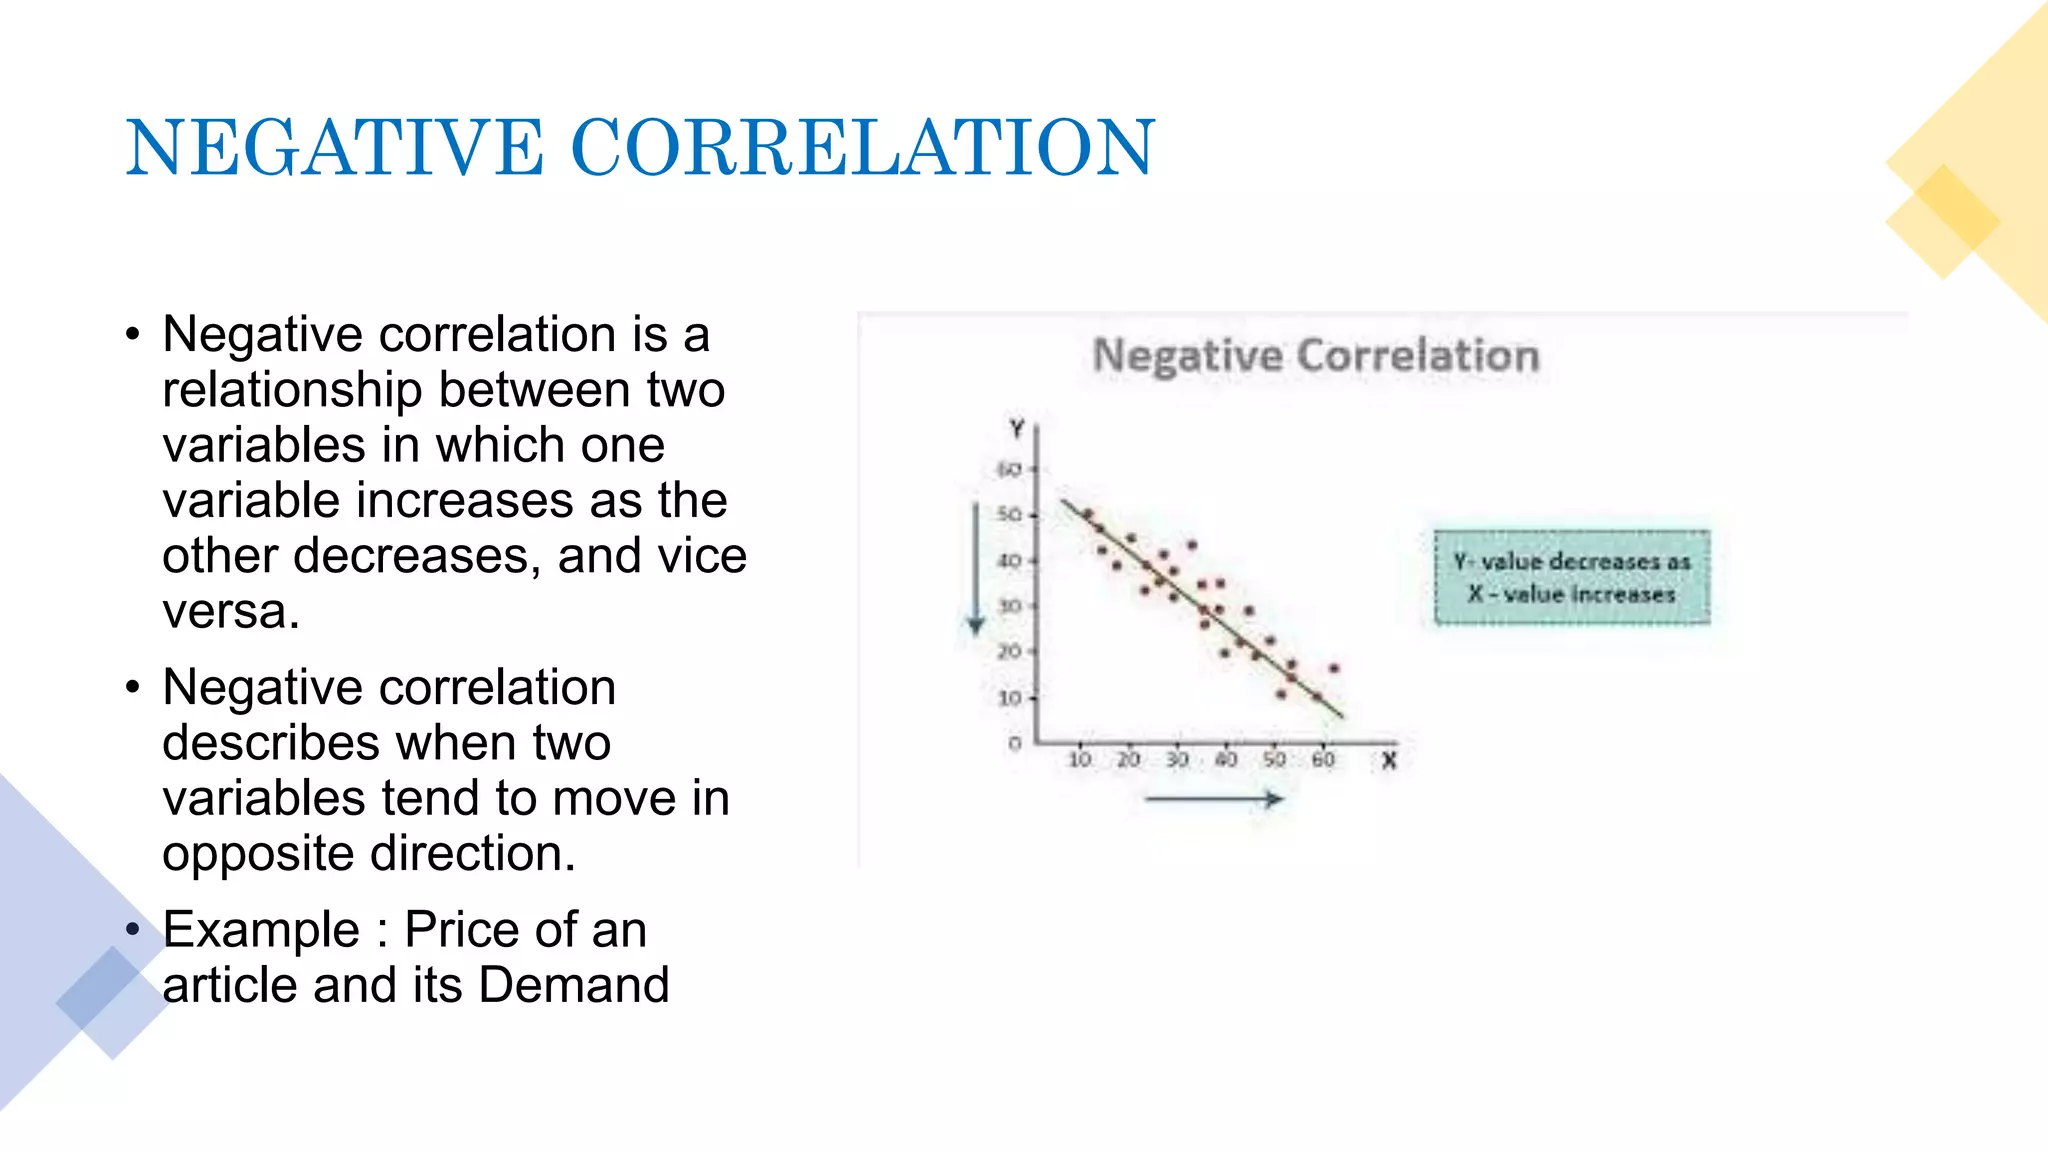
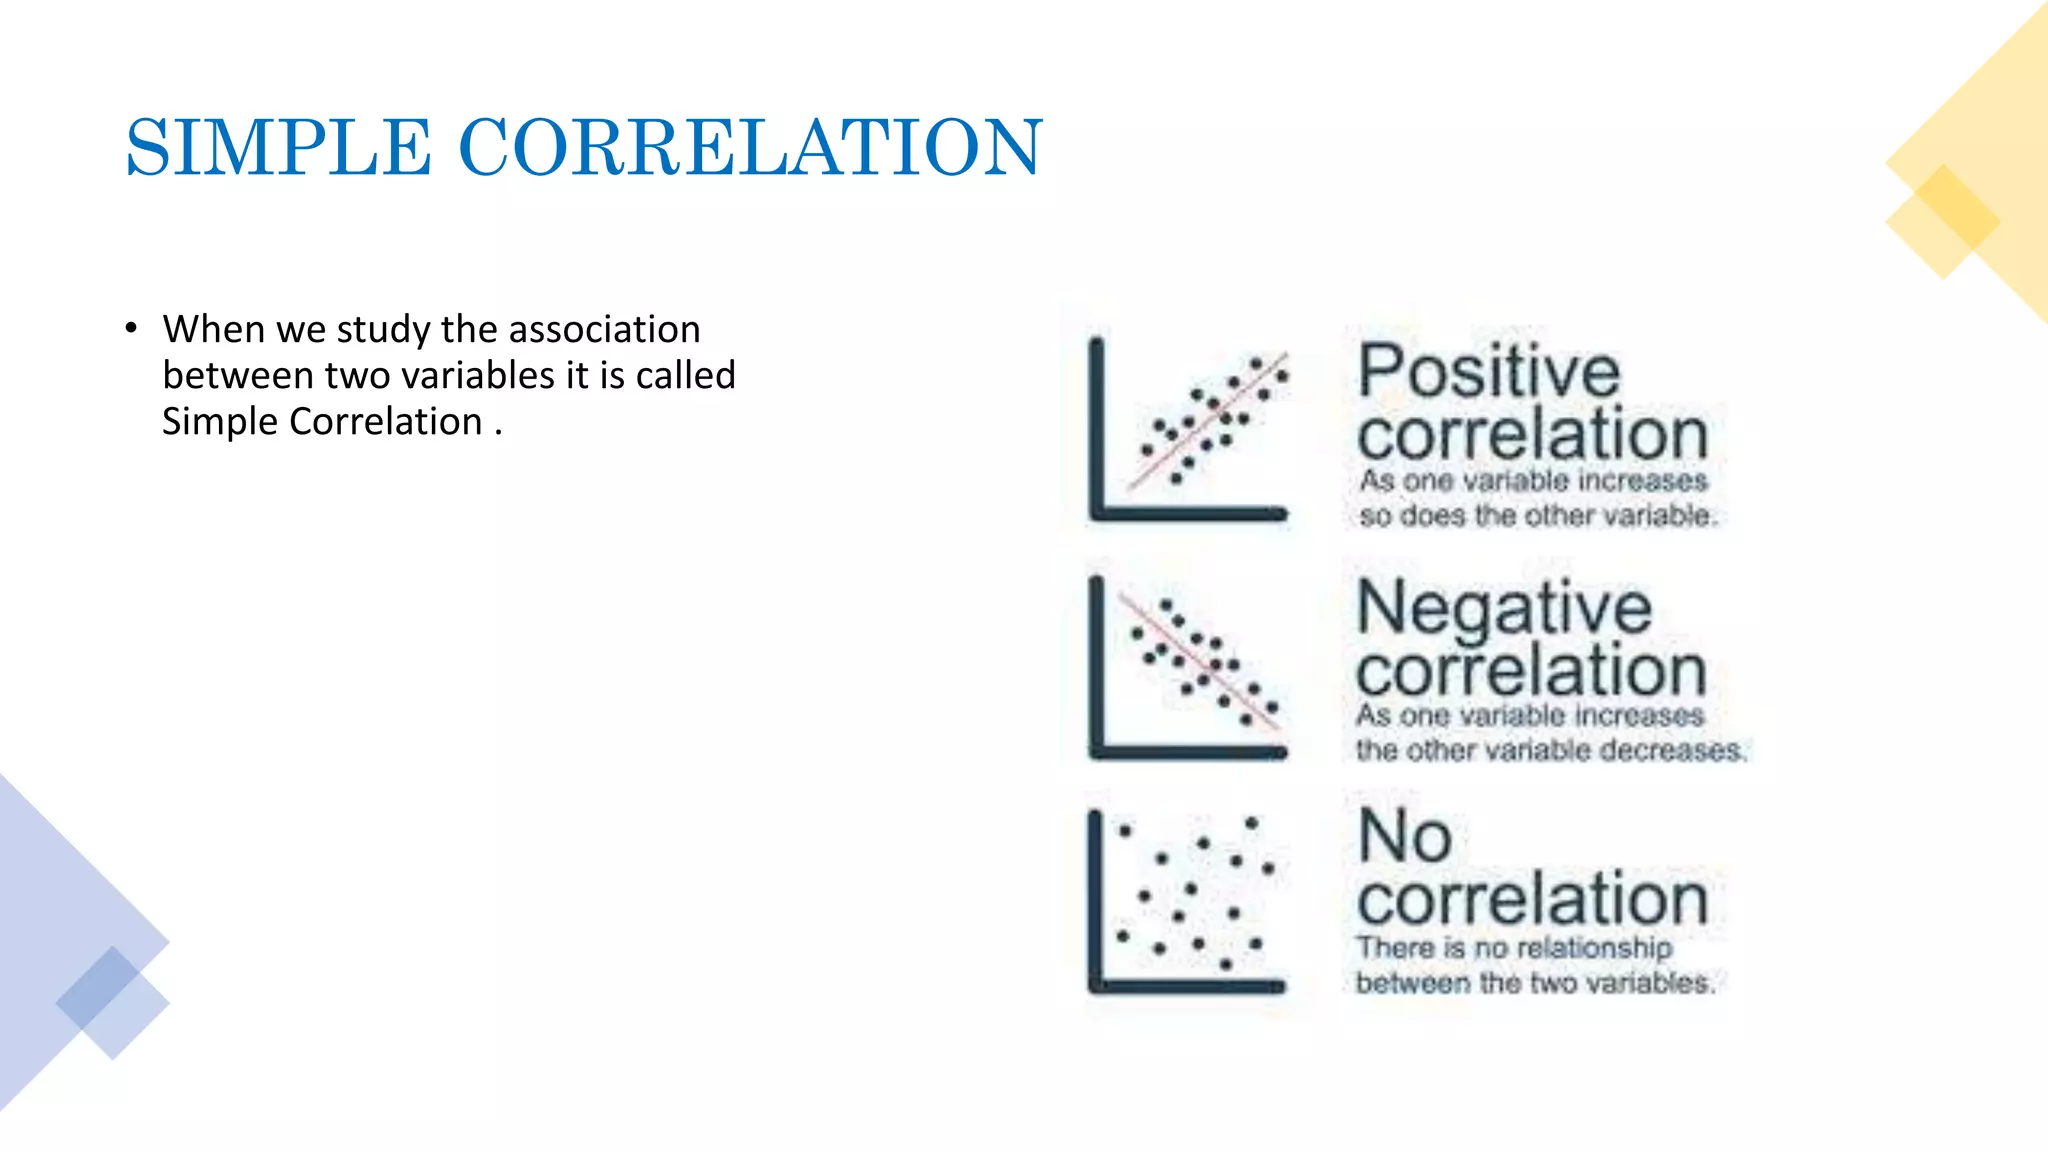
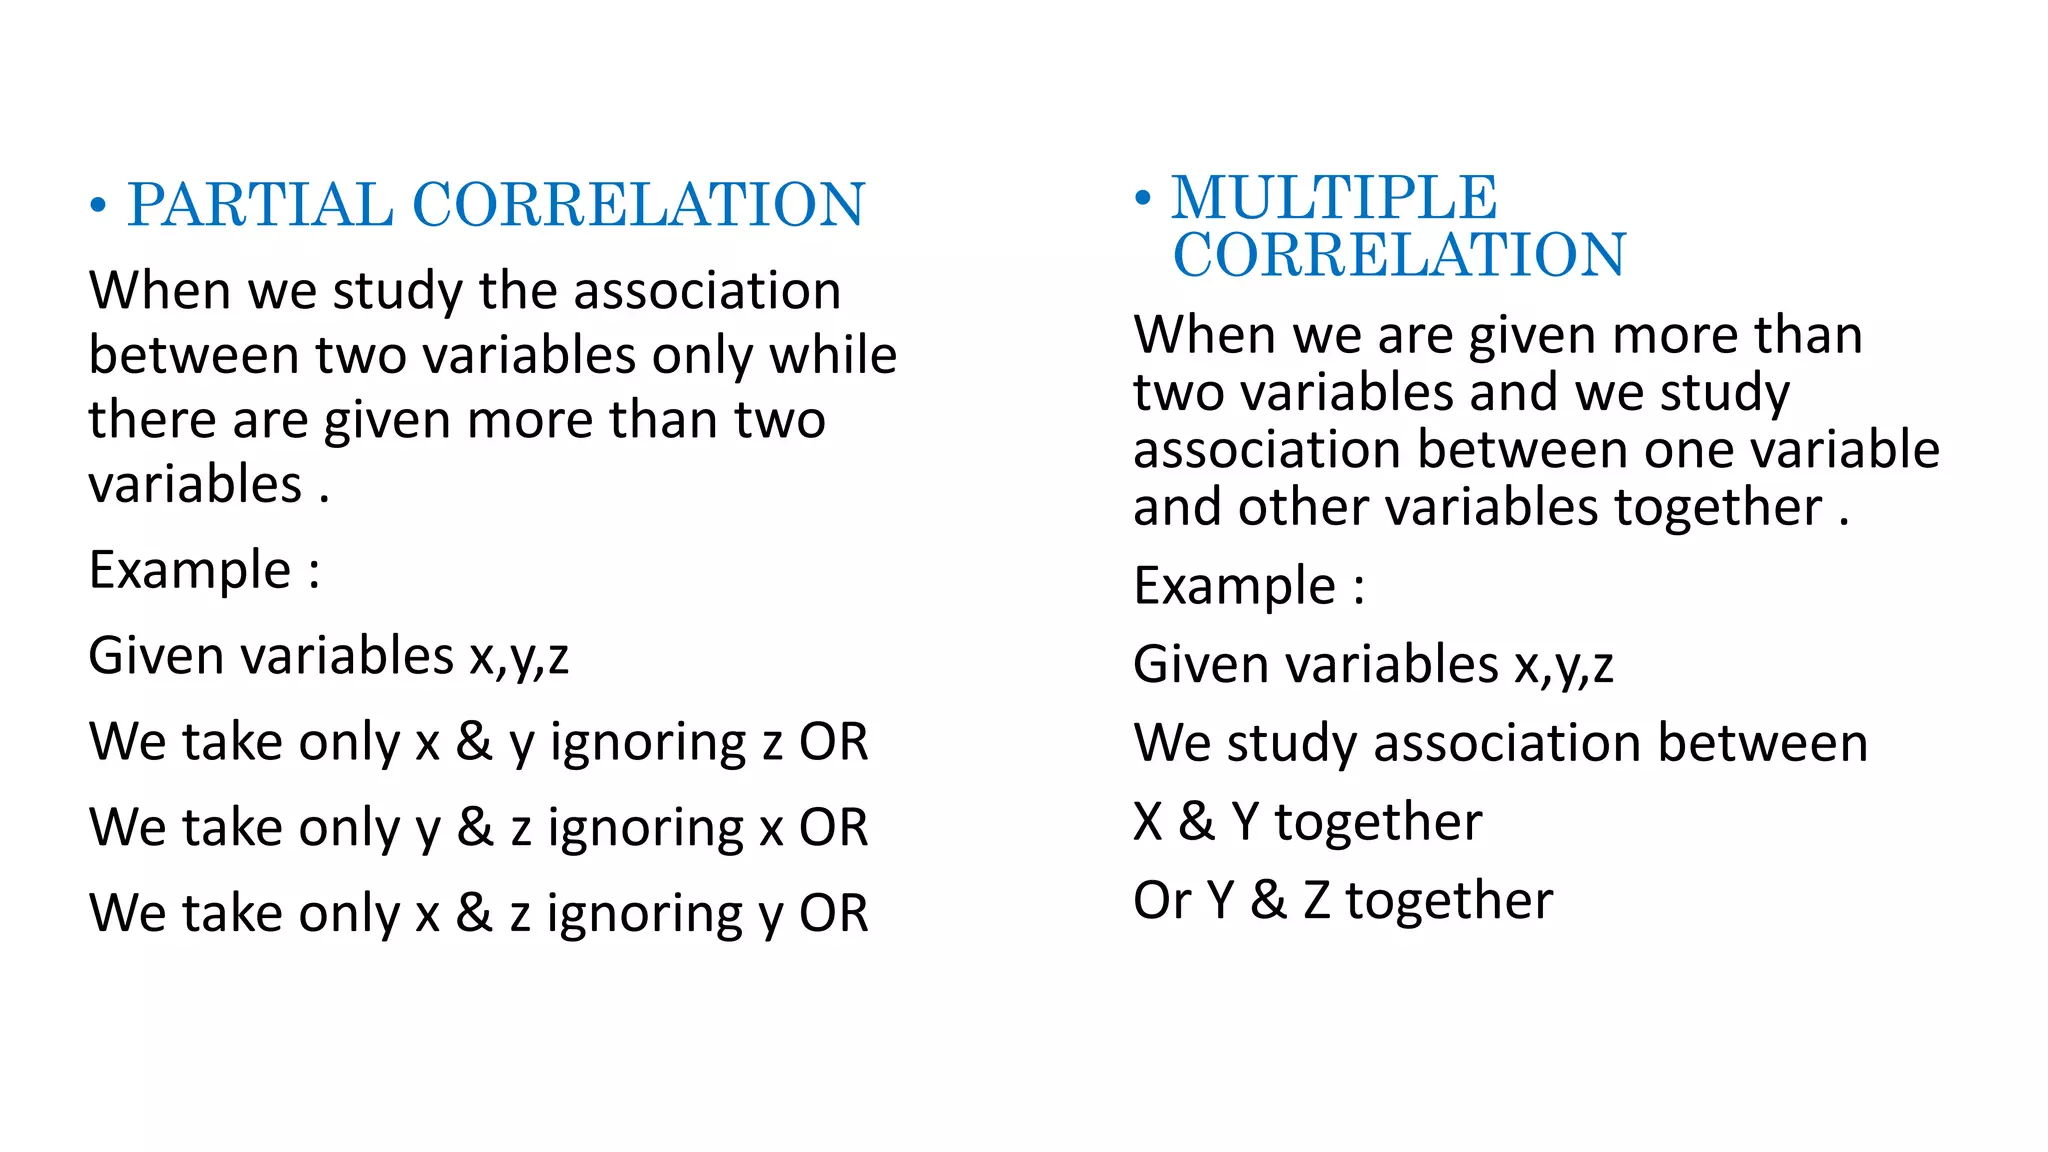
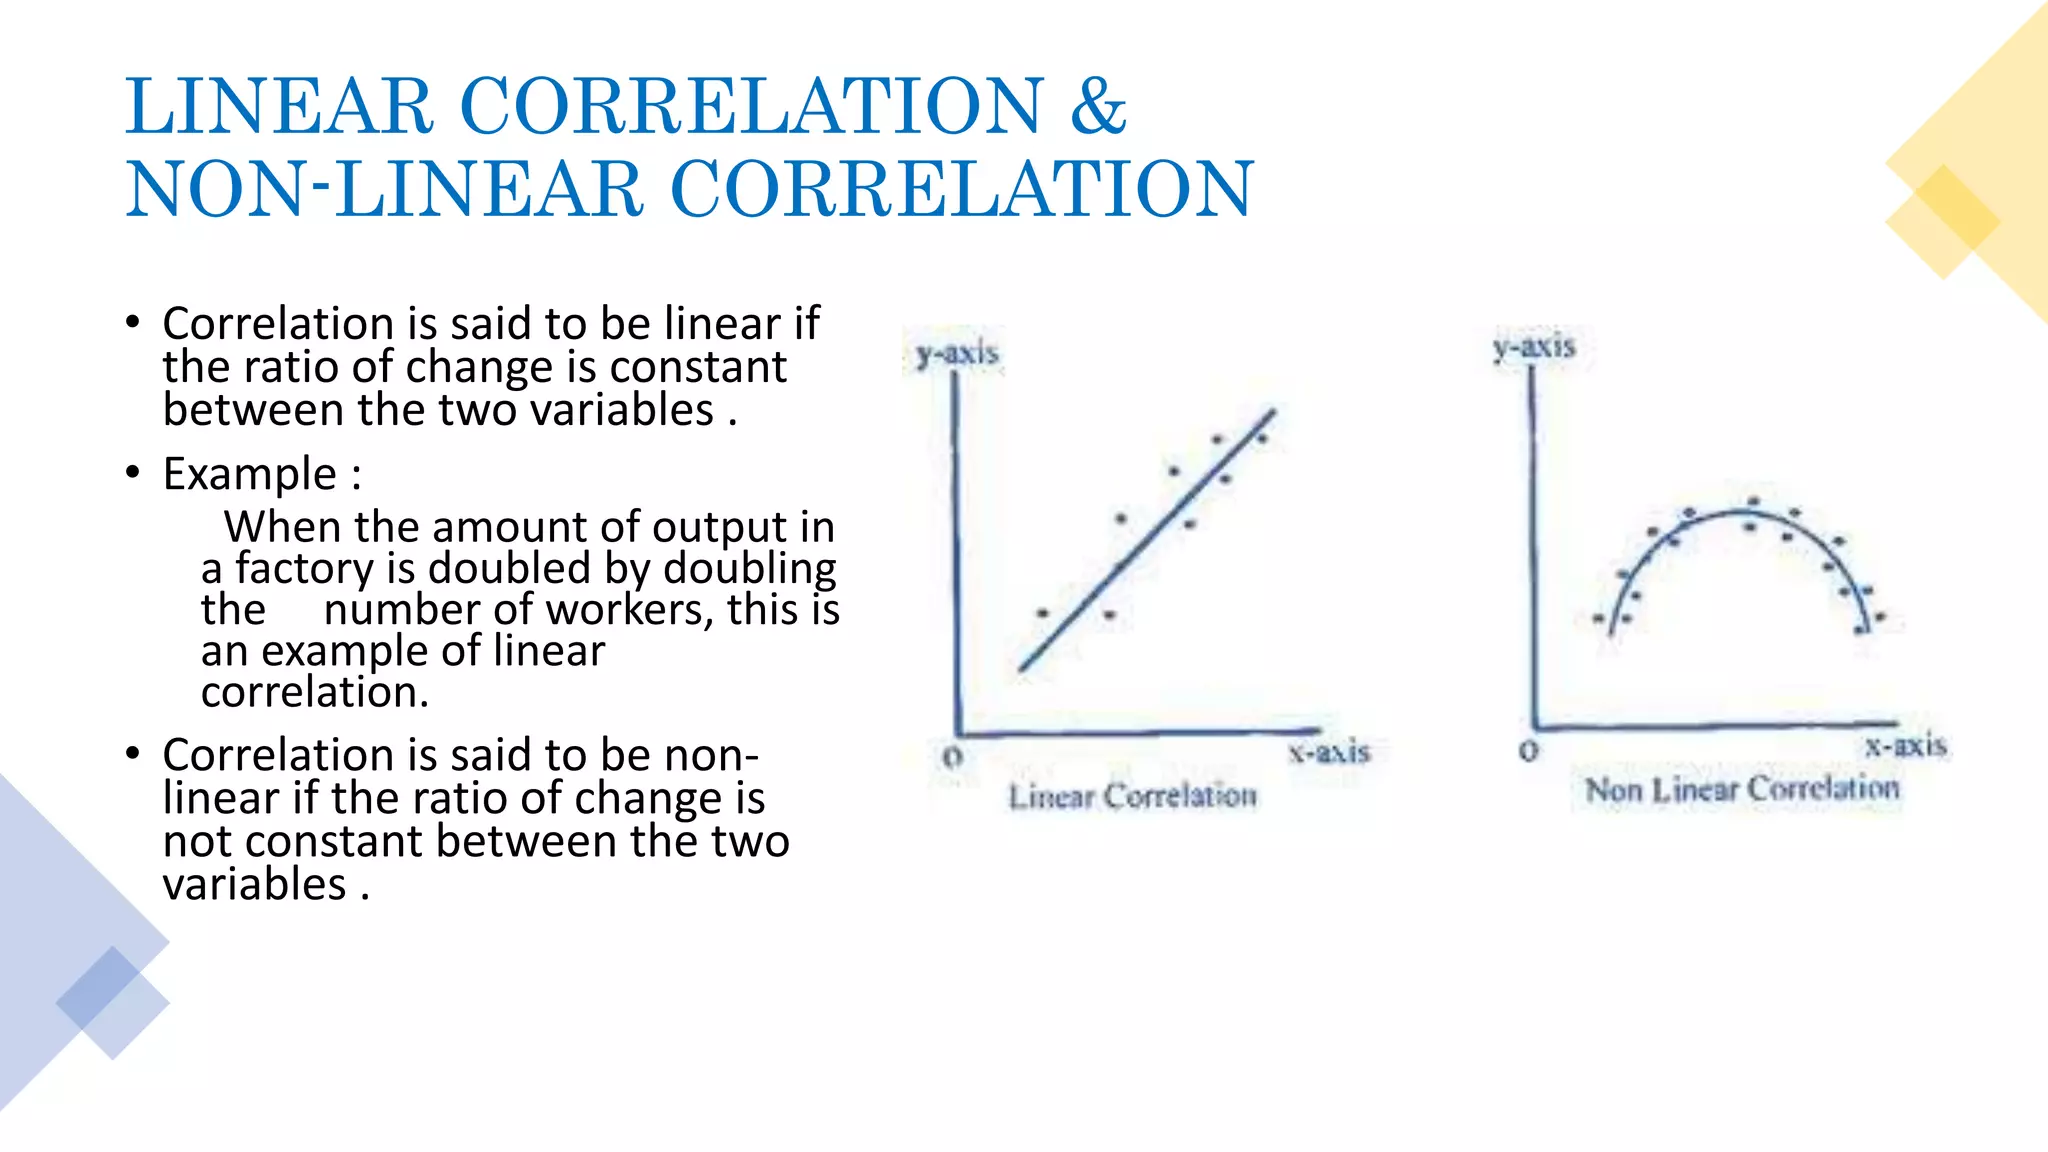
TOPIC : INTRODUCTION OF
CORRELATION
PRESENTED BY: MEHARLEEN KAUR
PUPIL-TEACHER ROLL NO. : 26
MEANING OF
CORRELATION
Correlation means to find out the
relationship between two or more variables.
Examples:
Price and Demand,
Height and Weight,
Temperature and Demand for soft drinks
TYPES OF
CORRELATION :
1. POSITIVE CORRELATION
2.NEGATIVE CORRELATION
3.SIMPLE CORRELATION
4.PARTIAL CORRELATION
5.MULTIPLE CORRELATION
6.TOTAL CORRELATION
7.LINEAR CORRELATION
8.NON LINEAR CORRELATION
POSITIVE CORRELATION
• A positive correlation
exists when one variable
decreases as the other
variable decreases, or one
variable increases while
the other increases
• A positive correlation is a
relationship between two
variables that tend to
move in the same
direction.
• Example : Salary and
Expenditure
NEGATIVE CORRELATION
• Negative correlation is a
relationship between two
variables in which one
variable increases as the
other decreases, and vice
versa.
• Negative correlation
describes when two
variables tend to move in
opposite direction.
• Example : Price of an
article and its Demand
SIMPLE CORRELATION
• When we study the association
between two variables it is called
Simple Correlation .
• PARTIAL CORRELATION
When we study the association
between two variables only while
there are given more than two
variables .
Example :
Given variables x,y,z
We take only x & y ignoring z OR
We take only y & z ignoring x OR
We take only x & z ignoring y OR
• MULTIPLE
CORRELATION
When we are given more than
two variables and we study
association between one variable
and other variables together .
Example :
Given variables x,y,z
We study association between
X & Y together
Or Y & Z together
LINEAR CORRELATION &
NON-LINEAR CORRELATION
• Correlation is said to be linear if
the ratio of change is constant
between the two variables .
• Example :
When the amount of output in
a factory is doubled by doubling
the number of workers, this is
an example of linear
correlation.
• Correlation is said to be non-
linear if the ratio of change is
not constant between the two
variables .
Thankyou

correlation and its types -ppt

  • 1.
    TOPIC : INTRODUCTIONOF CORRELATION PRESENTED BY: MEHARLEEN KAUR PUPIL-TEACHER ROLL NO. : 26
  • 2.
    MEANING OF CORRELATION Correlation meansto find out the relationship between two or more variables. Examples: Price and Demand, Height and Weight, Temperature and Demand for soft drinks
  • 3.
    TYPES OF CORRELATION : 1.POSITIVE CORRELATION 2.NEGATIVE CORRELATION 3.SIMPLE CORRELATION 4.PARTIAL CORRELATION 5.MULTIPLE CORRELATION 6.TOTAL CORRELATION 7.LINEAR CORRELATION 8.NON LINEAR CORRELATION
  • 4.
    POSITIVE CORRELATION • Apositive correlation exists when one variable decreases as the other variable decreases, or one variable increases while the other increases • A positive correlation is a relationship between two variables that tend to move in the same direction. • Example : Salary and Expenditure
  • 5.
    NEGATIVE CORRELATION • Negativecorrelation is a relationship between two variables in which one variable increases as the other decreases, and vice versa. • Negative correlation describes when two variables tend to move in opposite direction. • Example : Price of an article and its Demand
  • 6.
    SIMPLE CORRELATION • Whenwe study the association between two variables it is called Simple Correlation .
  • 7.
    • PARTIAL CORRELATION Whenwe study the association between two variables only while there are given more than two variables . Example : Given variables x,y,z We take only x & y ignoring z OR We take only y & z ignoring x OR We take only x & z ignoring y OR • MULTIPLE CORRELATION When we are given more than two variables and we study association between one variable and other variables together . Example : Given variables x,y,z We study association between X & Y together Or Y & Z together
  • 8.
    LINEAR CORRELATION & NON-LINEARCORRELATION • Correlation is said to be linear if the ratio of change is constant between the two variables . • Example : When the amount of output in a factory is doubled by doubling the number of workers, this is an example of linear correlation. • Correlation is said to be non- linear if the ratio of change is not constant between the two variables .
  • 9.