Download to read offline

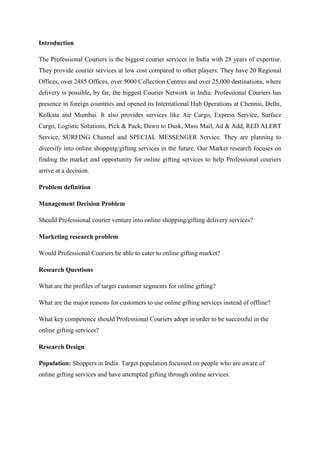


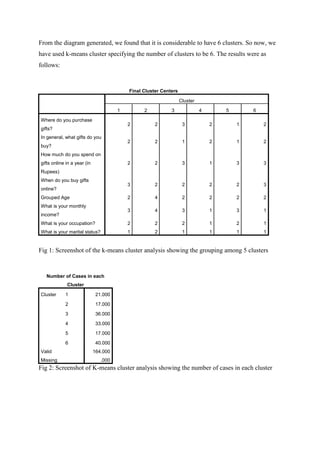
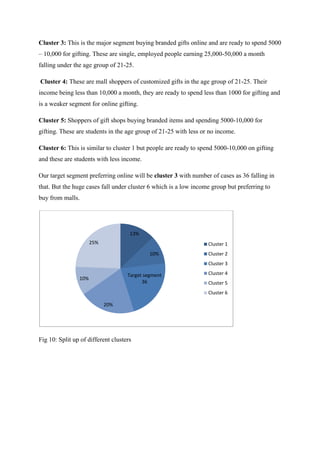


The document analyzes market research data on online gifting services in India. It identifies key customer segments for online gifting through cluster analysis. Younger, employed individuals who spend Rs. 5,000-10,000 annually on gifts are the prime target segment. Products like clothes and electronics are more suitable for online gifting. Factor analysis finds customers value convenience, options and experience. Timely delivery is important to shift offline customers online. The report recommends Professional Couriers focus on customer experience and timely delivery to enter the online gifting market successfully.


