Download to read offline


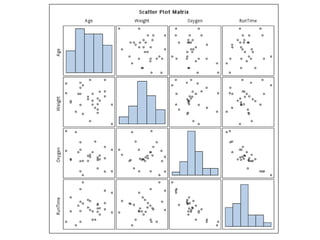
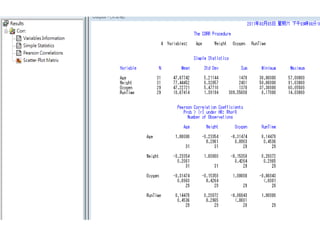
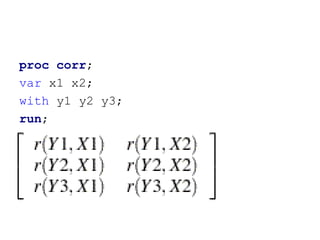
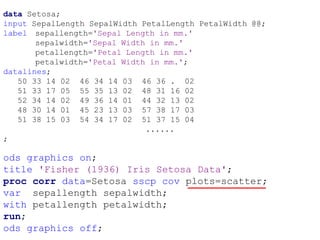
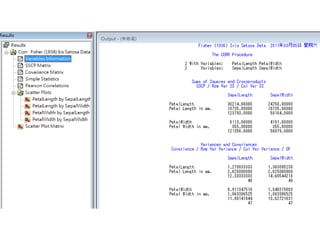

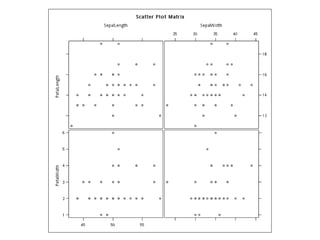


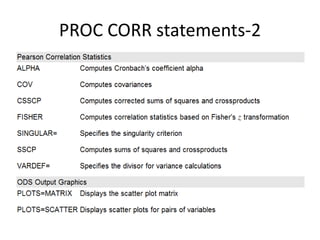


This SAS tutorial discusses procedures for correlation (PROC CORR) and frequency analysis (PROC FREQ). It provides examples of using PROC CORR to generate a correlation matrix and scatter plot for bivariate relationships. PROC FREQ is demonstrated through a 2x3 cross tabulation and chi-square test to examine potential gender differences in attitudes. Additional concepts reviewed include partial correlation, missing data handling, variance/covariance matrices, and the chi-square distribution.