INTRODUCTION
Population/Universe: instatistics denotes the
aggregate from which sample (items) is to be
taken.
A population can be defined as including all
people or items with the characteristic one
wishes to understand.
Because there is very rarely enough time or
money to gather information from everyone or
everything in a population, the goal becomes
finding a representative sample (or subset) of
that population.
3.
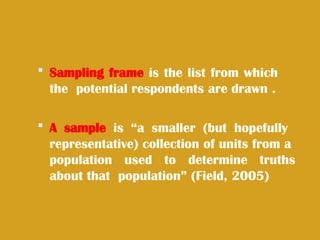
Sampling frameis the list from which
the potential respondents are drawn .
A sample is “a smaller (but hopefully
representative) collection of units from a
population used to determine truths
about that population” (Field, 2005)
SAMPLING
Sampling: theprocess of learning about
population on the basis of sample drawn
from it.
Three elements in process of sampling:
Selecting the sample
Collecting the information
Making inference about population
Statistics: values obtained from study
of a sample.
Parameters: such values from
study of population.
6.
NEED FOR SAMPLING
DATA
(acc.to source)
Primary Secondary
1.ORIGINAL IN
CHARACTER
2. GENERATED
IN LARGE
NO. OF
SURVEYS
OBTAINED FROM
1. PUBLISHED SOURCES
2.UNPUBLISHED
SOURCES
7.
NEED FOR SAMPLING
When secondary data are not available
for the problem under study , primary
data is collected.
Two methods –
Census method or complete enumeration
method
Sample method
8.
CENSUS (COMPLETE ENUMERATIONSURVEY)
ALL THE UNITS OF THE POPULATION IS INCLUDED
• Merits
Data obtained from each and every unit of
population.
Results: more representative, accurate, reliable.
Basis of various surveys.
Demerits
More effort ,money , time.
Big problem in underdeveloped countries.
9.
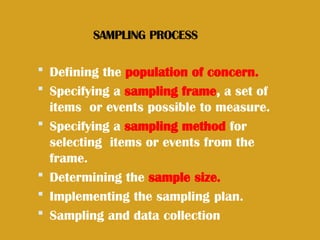
SAMPLING PROCESS
Definingthe population of concern.
Specifying a sampling frame, a set of
items or events possible to measure.
Specifying a sampling method for
selecting items or events from the
frame.
Determining the sample size.
Implementing the sampling plan.
Sampling and data collection
10.
ESSENTIALS OF SAMPLING
Representativeness- Possess the
characteristics of the entire
population-ensure by random
selection
Adequacy - sample size should be
adequate
Independence - same chance of
selection
Homogeneity - no basic difference in
nature of units.
JUDGMENT SAMPLING
Merits
Small no. of sampling units
Study unknown traits/case sampling
Urgent public policy & business decisions
Demerits
Personal prejudice & bias
No objective way of evaluating reliability of
results
15.
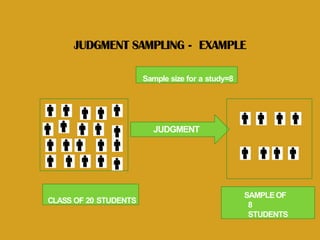
JUDGMENT SAMPLING -EXAMPLE
CLASS OF 20 STUDENTS
Sample size for a study=8
JUDGMENT
SAMPLEOF
8
STUDENTS
16.
CONVENIENCE SAMPLING
Convenientsample units selected.
Selected neither by probability
nor by judgment.
Merit – useful in pilot studies.
Demerit – results usually biased
and unsatisfactory.
17.
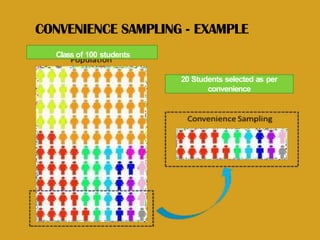
CONVENIENCE SAMPLING -EXAMPLE
Class of 100 students
20 Students selected as per
convenience
18.
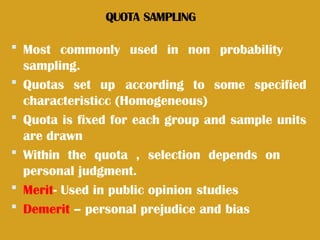
QUOTA SAMPLING
Mostcommonly used in non probability
sampling.
Quotas set up according to some specified
characteristicc (Homogeneous)
Quota is fixed for each group and sample units
are drawn
Within the quota , selection depends on
personal judgment.
Merit- Used in public opinion studies
Demerit – personal prejudice and bias
SNOWBALL SAMPLING
Aspecial non probability method used
when the desired sample characteristic is
rare.
It may be extremely difficult or cost
prohibitive to locate respondents in
these situations.
Snowball sampling relies on referrals from
initial subjects to generate additional
subjects.
21.
SNOWBALL SAMPLING -STEPS
Make contact with one or
two cases in the population.
Ask these cases to identify
further cases.
Ask these new cases to identify further
new cases.
Stop when either no new cases are given or
the sample is as large as is manageable.
22.
SNOWBALL SAMPLING
Merit
access to difficult to reach
populations (other methods may not
yield any results).
Demerit
not representative of the population
and will result in a biased sample as it is
self-selecting.
SIMPLE RANDOM SAMPLING
Each unit has an equal opportunity of
being selected.
Chance determines which items
shall be included.
In case of a population with N units
the probability of choosing n sample
units ,with all possible
combinations.
25.
SIMPLE RANDOM SAMPLING
The sample is a simple random sample if
any of the following is true –
All items selected independently.
At each selection , all remaining items have
same chance of being selected.
All the possible samples of a given size are
equally likely to be selected.
LOTTERY METHOD
Withreplacement-
When the units are selected into a sample
successively after replacing the selected unit
before the next drawn
Probability each item: 1/N
Without replacement –
If the units selected are not replaced before
the next draw and drawing of successive units
are made only from the remaining units of the
population.
Probability 1st draw: 1/N
Probability 2nd
draw: 1/N-1
SIMPLE RANDOM SAMPLING
Merits
No personal bias.
Sample more representative of population.
Accuracy can be assessed as sampling errors
follow principals of chance.
Demerits
Requires completely catalogued universe.
Cases too widely disposed more time and
cost.
30.
STRATIFIED RANDOM SAMPLING
Universe is sub divided into mutually
exclusive groups.
A simple random sample is then chosen
independently from each group.
31.
STRATIFIED RANDOM SAMPLING
Issues involved in stratification
Base of stratification
Number of strata
Sample size within strata.
Sample size within strata
Proportional
(proportion in each
stratum)
Disproportional
(equal no. in each
stratum)
STRATIFIED RANDOM SAMPLING
Merits
More representative.
Greater accuracy.
Greater geographical concentration.
Demerits
Utmost care in dividing strata.
Skilled sampling supervisors.
Cost per observation may be high.
34.
SYSTEMATIC SAMPLING
Selectingfirst unit at random.
Selecting additional units at evenly
spaced intervals.
Complete list of population available.
k=N/n
k=sampling
interval
N=universe size
n=Sample size
Class of 95students : roll no. 1 to 95
Sample of 10 students
k=9.5 or 10
1st student random then every 10th
35.
SYSTEMATIC SAMPLING
Merits
Simple and convenient.
Less time consuming.
Demerits
Population with hidden
periodicities.
36.
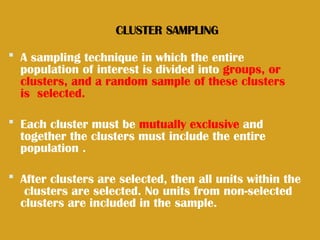
CLUSTER SAMPLING
Asampling technique in which the entire
population of interest is divided into groups, or
clusters, and a random sample of these clusters
is selected.
Each cluster must be mutually exclusive and
together the clusters must include the entire
population .
After clusters are selected, then all units within the
clusters are selected. No units from non-selected
clusters are included in the sample.
37.
CLUSTER SAMPLING
Merits
Most economical form of sampling.
Larger sample for a similar fixed cost.
Less time for listing and implementation.
Reduce travel and other administrative costs.
Demerits
May not reflect the diversity of the community.
Standard errors of the estimates are high,
compared to
other sampling designs with same sample size .
38.
AREA SAMPLING
• Avariant of cluster sampling is area
sampling.
• In area sampling,groups of clusters are
formed on geographical basis such as
sectors,blocks etc.
• In this particular block is chosen randomly
and then all the units or households within
the block are included in sample.
39.
MERITS
Most suitable whensampling frame does not
include every member of the population,but the
list of clusters or geographical area is
available.
DEMERITS
Clusters are rarely heterogeneous.
40.
SEQUENTIAL SAMPLING
A ComplexForm of sampling – It involves drawing
samples in a sequence but data collection is done
at each stage.
The size of the sample is not fixed in advance but a
decision rule is stated before the sampling begins.
At each stage after anlaysis has been done the
decision rule is checked to see if further sampling
is to be continued or not.
41.
SAMPLING AND NONSAMPLING ERRORS
A research project can get affected by
errors arising due to various reasons. The
errors in a sampling procedure can be
classified as sampling errors and non –
sampling errors.
TOTAL ERROR = SAMPLING ERROR + NON
SAMPLING ERROR
42.
SAMPLING ERRORS
BIASED ERRORS
Biasederrors arise due to any bias or
prejudice of the researcher in selecting a
sample. Bias may arise due to any of the
following three reasons.
1.Faulty process of selection
2.Bias due to Faulty collection of data.
3.Bias due to faulty analysis
43.
UNBIASED ERRORS
• Unbiasederrors also called as random sampling
errors are due to chance differences between the
members of the population included in the sample
and those not included .
• These are unavoidable errors which may be purely
due to selecting an individual or object randomly
who may be high ,low or average in the trait under
consideration.
• These errors are also known as non cumulative or
compensating errors,
44.
METHODS OF REDUCINGSAMPLING ERRORS
Biases errors can be reduced by paying attention to
1. Intensive Study of sampling methods
2. Greater investment in enumeration
3. Effective pretesting of sampling and interviewing
techniques
4. Training field workers to handle problems effectively
5. Using appropriate Substitution methods like
matching the missing population units with available
units of similar characteristics etc.
45.
NON SAMPLING ERRORS
Nonsampling errors arise due to reasons other than
sampling, like error in scales instrument ,data
collection,editing,coding or tabulation.
These errors would occur in sampling as well as census
survey.
These errors are to types
1. Response Errors- These errors arise when the
respondents give inaccurate answers or their answers
are nor reordered properly.
• Researcher errors – A research can introduce errors
by recording the wrong information that does not suit
the purpose.
46.
Interviewers Errors: Theseerrors occur when interviewers
select respondents other than those specified in the
sampling design.
Respondents Errors: Such Errors arise on behalf of the
respondents activities
2. Non response Errors: They arise when some of the
respondents do not respond.
The general impact of non- response is that it alerts the
size and composition of original sample.
Non response could be due to failure is locating the
respondents or their willingness to respond or because
they lack the information deired.
47.
HANDLING NON SAMPLINGERRORS
1.Ignore non sampling errors: This strategy is the
most widely practised one. It is based on the fact
that confidence level is relatively insensitive to
sizeable amount of non sampling variable error.
2.Estimate Non – sampling errors: As stated earlier
the non sampling errors as in much larger
proportion than sampling errors hence the
second stratergy suggest that these errors should
be estimated to study their impact on results.
48.
CHOICE OF SAMPLINGTECHNIQUE
The sample design is a plan drawing a sample from a
population. This is an important part of a research
design or plan.
The Preparation of a sample design involves making
decisions on the following Questions:
1.What is the relevant population?
2.What method of sampling frame shall we use?
3.What are the parameters of interest?
4.What should be the sample Size?
5.How much will be the sample Cost?
49.
CRITERIA FOR SELECTINGSAMPLING
TECHNIQUE
1.Purpose of the Survey
2.Measurability
3.Degree of Precision
4.Information about population
5.The Nature of the Population
6.Geographical area of the Study
7.Financial Resources
8.Time Limitation
9.Economy
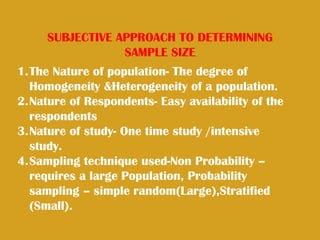
SUBJECTIVE APPROACH TODETERMINING
SAMPLE SIZE
1.The Nature of population- The degree of
Homogeneity &Heterogeneity of a population.
2.Nature of Respondents- Easy availability of the
respondents
3.Nature of study- One time study /intensive
study.
4.Sampling technique used-Non Probability –
requires a large Population, Probability
sampling – simple random(Large),Stratified
(Small).
52.
5. Complexity oftabulation- Deciding on the number of
categories.
6. Availability of Resources- The funds and the time available
to a researcher .
7. Degree of Precision and Accuracy Required- Precision of
the study is measured by standard error, will be high only if
the standard error is less or the sample size is large.
Accuracy can also be ensured only when there is large sample.
53.
SAMPLE SIZE CRITERIA
Threecriteria usually needed for sample size
determination
1.The Level of Precision
2.The Level of Confidence or Risk
3.The Degree of variability in the attribute
being measure
54.
THE LEVEL OFPRECISION
• The level of precision is sometimes called
sampling errors- this is the range in which
the true value of the population is estimated
to be.
• The range is expresses in percentage points
+/- 5 percent.
55.
THE CONFIDENCE LEVEL
•The confidence Level or risk level is based on
ideas encompassed under the Central Limit
Theorem
• The Key idea of Central Limit Theorem – When
a population is repeatedly sampled, the
average value of the attribute obtained by
those samples is equal to the true population
value.
57.
DEGREE OF VARIABILITY
•The degree of variability refers to the
distribution of attributes in the population.
• The more Heterogeneous a population, the
larger the sample size required to obtain a
given level of precision,
• The more homogeneous a population the
smaller the sample size.
58.
STRATERGIES FOR DETERMING
SAMPLESIZE
• Using a Census for small population
• Using a Sample Size of a Similar study
• Using Published tables
• Using Formulas to calculate a sample Size