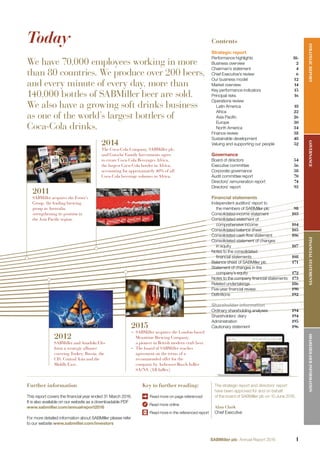
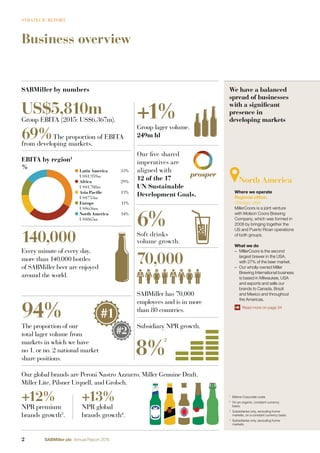
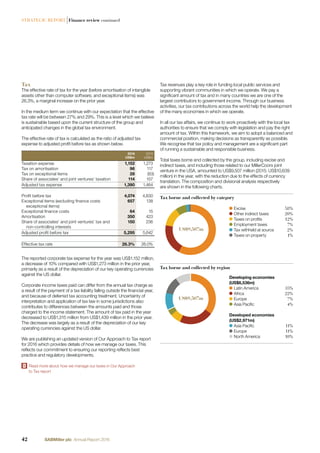
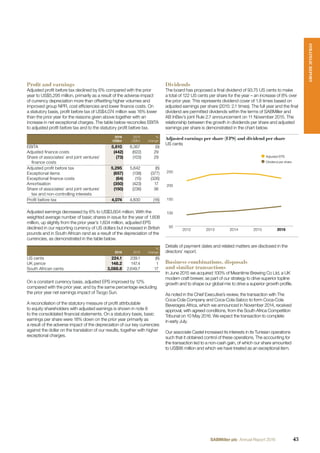
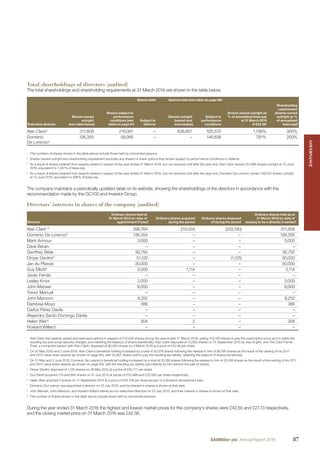
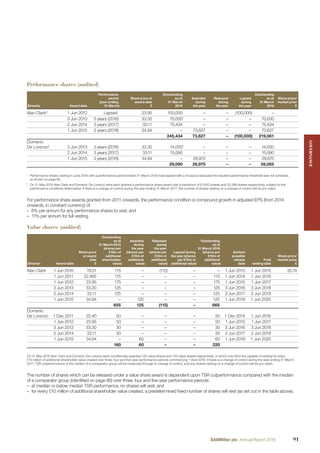
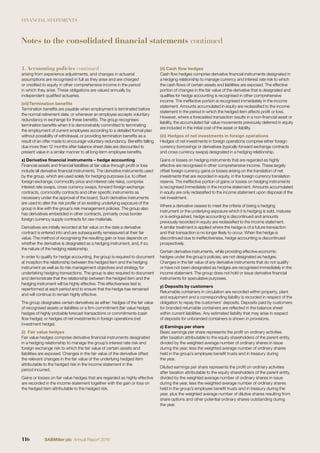
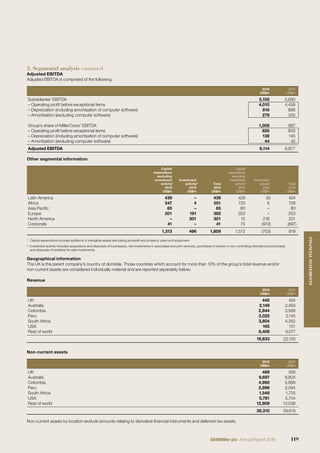
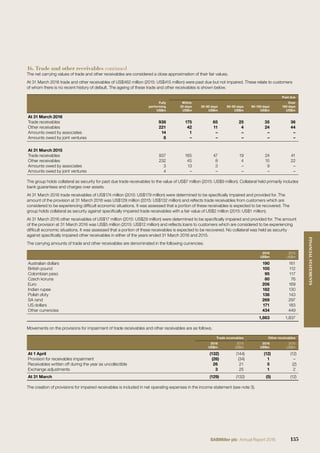
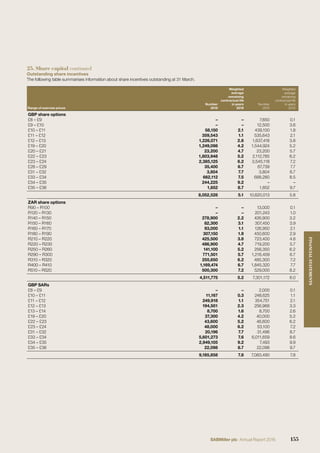
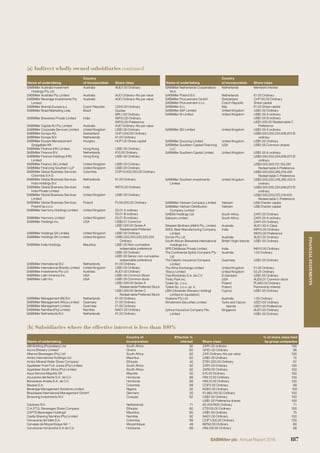
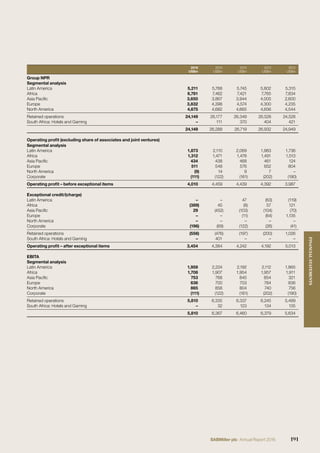
SABMiller plc
Annual Report
2016
SABMiller plc
Annual Report
2016
We are in the beer and soft drinks business.
We bring refreshment and sociability to millions
of people all over the world who enjoy our drinks.
We do business in a way that improves livelihoods
and helps build communities.
We are passionate about brewing and have a long
tradition of craftsmanship in making superb beer
from high quality natural ingredients. We are local
beer experts. We have more than 200 local beers,
from which we have carefully selected and nurtured
a range of special regional and global brands.
Read about our proud heritage overleaf…
Performance highlights
Group net producer revenue1
-8%2016: US$24,149m
2015: US$26,288m
+5%
2
Revenue3
-10%2016: US$19,833m
2015: US$22,130m
+7%
2
+8%
2
EBITA4
-9%2016: US$5,810m
2015: US$6,367m
EBITA margin progression
-10basis points
2016: 24.1%
2015: 24.2%
+60basis points2
Profit before tax
-16%2016: US$4,074m
2015: US$4,830m
Adjusted EPS5
-6%2016: 224.1 US cents
2015: 239.1 US cents
Dividends per share6
+8%2016: 122.0 US cents
2015: 113.0 US cents
Water usage (beer)7
-3%2016: 3.2 hl/hl
2015: 3.3 hl/hl
Net debt8
-8%2016: US$9,638m
2015: US$10,465m
Free cash flow9
-8%2016: US$2,969m
2015: US$3,233m
Total shareholder return10
Five-year
115%Peer median: 102%
Beverage volumes
+2%2016: 331m hectolitres
2015: 324m hectolitres
1
Group net producer revenue (NPR) is defined on page 192 and includes the group’s
attributable share of associates’ and joint ventures’ net producer revenue of
US$9,254 million (2015: US$9,754 million), but excludes excise duties and other
similar taxes.
2
Growth on an organic, constant currency basis.
3
Revenue excludes the group’s attributable share of associates’ and joint ventures’ revenue
but includes excise duties and similar taxes.
4
Note 2 to the consolidated financial statements provides a reconciliation of operating profit
to EBITA which is defined as operating profit before exceptional items and amortisation of
intangible assets (excluding computer software) and includes the group’s share of
associates’ and joint ventures’ operating profit, on a similar basis. As described in the
finance review, EBITA is used throughout this report.
5
A reconciliation of adjusted earnings to the statutory measure of profit attributable to equity
shareholders is provided in note 8 to the consolidated financial statements.
6
The 2016 final dividend is subject to shareholder approval at the annual general meeting.
7
Water usage is defined on page 193.
8
Net debt comprises gross debt (including borrowings, financing derivative financial instruments,
overdrafts and finance leases) net of cash and cash equivalents (excluding overdrafts).
An analysis of net debt is provided in note 27c to the consolidated financial statements.
9
Note 27b to the consolidated financial statements provides a reconciliation of net cash from
operating activities to free cash flow.
10
Total shareholder return (TSR) is shown as the percentage growth in our TSR over the five
years to 31 March 2016.
Our story
1993
SAB acquires the Dreher
Brewery in Hungary,
signalling the beginning of
a game-changing decade
of mergers and acquisitions.
1977
SAB opens its first
Coca-Cola bottling
operation in
South Africa.
1995
– Nelson Mandela opens SAB’s
Centenary Centre in the cultural
precinct of Johannesburg.
– SAB acquires a majority stake
in Poland’s Lech brewery and
acquires the Tyskie brewery
the following year.
1895
The South African Breweries (SAB) is founded, with its head office
in the Castle Brewery. Two years later, SAB becomes the first
industrial company to list on the Johannesburg Stock Exchange.
Little could Charles Glass have known that his Castle Lager would
still be South Africa’s most famous beer 120 years after its launch.
1978
SAB publishes a code
of non-discriminatory
employment – a first
in South Africa.
1979
SAB expands into fruit
juices, taking a 49%
interest in Appletiser
from its Italian founder.
Coca-Cola sold control
of Appletiser to SAB
in 1982. 1994
– SAB enters Tanzania
followed by Angola,
Mozambique and Zambia.
– SAB negotiates joint control
with China Resources of
the second largest brewer
in mainland China – the
home today of the world’s
largest beer brand, Snow.
1990s
SABMiller embarks
on rapid international
expansion
The most local of the global brewers
Our business began life 120 years ago in the Johannesburg gold rush when Charles Glass founded
the Castle Brewery. Today, we are a global community of beer and beverage experts, producing
some of the world’s most recognised global and local beers. At SABMiller we have a proud beer
heritage. We’re the original brewmasters; making beers people love by truly understanding local
tastes. Our brewing magic turns simple natural ingredients into beers that are part of national
identity and culture. That is why we believe the value in beer is local, and why we have built
SABMiller as the most local of global brewers.
Read more about our history at www.sabmiller.com/about-us/history
1955
SAB acquires its two
competitors, Ohlsson’s and
Chandlers Union Breweries and
streamlines production and
distribution within the sector.
From this position of strength,
SAB was set to enter decades of
uninterrupted growth.
Brewing and selling beer is where we began in 1895,
and beer accounts for the majority of our business today.
2003
SABMiller makes its first
significant investment in
western Europe, acquiring
a majority interest in Italian
brewer Birra Peroni.
2007-8
– 2007 – SABMiller acquires Koninklijke
Grolsch NV in the Netherlands.
– 2008 – SABMiller combines Miller
Brewing with the US business of
Molson Coors, to create the MillerCoors
joint venture.
2005
SABMiller’s next step is to move
into Latin America through the
acquisition of Colombia’s
Bavaria SA, the second largest
brewer in the region with
leading positions in Colombia,
Peru, Ecuador and Panama.
2001
– SAB becomes the first
international brewer to enter
Central America when it acquires
the Honduran brewer Cervecería
Hondureña and Industrias La
Constancia in El Salvador.
– A pan-African association
with the Castel group offers
the opportunity to invest in
promising new African markets
and benefit from economies
of scale.
2009
SABMiller launches a broad-based
black economic empowerment
transaction in South Africa,
involving an equity issue of 8.45%
of The South African Breweries
(Pty) Limited.
1999
– First day of trading of
SAB shares on the
London Stock
Exchange: 1 March
1999. List price: 428p
Closing price: 447p.
Market capitalisation
based on list price:
£3,261m.
– SAB acquires
controlling interest in
Plze˘nský Prazdroj in
the Czech Republic,
owner of leading
brands Pilsner
Urquell, Gambrinus,
Kozel and Radegast.
2002
SAB makes its first significant
entry into a developed market
with the Miller Brewing Company
transaction, and changed its 
name to SABMiller.
Visionary leadership
In the early 1990s we set out to become a truly international
beverage company, building on a century of brewing expertise.
Our foray into international brewing was bold, in that it focused
on the rapidly developing economies of central Europe, China and
Africa. Where others saw risk, we saw opportunity. And our long
experience in South Africa had given us considerable experience in
running multicultural operations in developing markets. Our 1993
acquisition of the Dreher brewery in Hungary signalled the start
of a journey to become the world’s second biggest brewing company.
Further information
This report covers the financial year ended 31 March 2016.
It is also available on our website as a downloadable PDF
www.sabmiller.com/annualreport2016
For more detailed information about SABMiller please refer
to our website www.sabmiller.com/investors
Key to further reading:
Read more on page referenced
Read more online
Read more in the referenced report
Today
We have 70,000 employees working in more
than 80 countries. We produce over 200 beers,
and every minute of every day, more than
140,000 bottles of SABMiller beer are sold.
We also have a growing soft drinks business
as one of the world’s largest bottlers of
Coca-Cola drinks.
The strategic report and directors’ report
have been approved for and on behalf
of the board of SABMiller plc on 10 June 2016.
Alan Clark
Chief Executive
Contents
Strategic report
Performance highlights Ifc
Business overview 2
Chairman’s statement 4
Chief Executive’s review 6
Our business model 12
Market overview 14
Key performance indicators 15
Principal risks 16
Operations review
Latin America 18
Africa 22
Asia Pacific 26
Europe 30
North America 34
Finance review 38
Sustainable development 48
Valuing and supporting our people 52
Governance
Board of directors 54
Executive committee 56
Corporate governance 58
Audit committee report 70
Directors’ remuneration report 74
Directors’ report 93
Financial statements
Independent auditors’ report to
the members of SABMiller plc 98
Consolidated income statement 103
Consolidated statement of
comprehensive income 104
Consolidated balance sheet 105
Consolidated cash flow statement 106
Consolidated statement of changes
in equity 107
Notes to the consolidated
financial statements 108
Balance sheet of SABMiller plc 171
Statement of changes in the
company’s equity 172
Notes to the company financial statements 173
Related undertakings 186
Five-year financial review 190
Definitions 192
Shareholder information
Ordinary shareholding analyses 194
Shareholders’ diary 194
Administration 195
Cautionary statement 196
2011
SABMiller acquires the Foster’s
Group, the leading brewing
group in Australia,
strengthening its position in
the Asia Pacific region.
2014
The Coca-Cola Company, SABMiller plc,
and Gutsche Family Investments agree
to create Coca-Cola Beverages Africa,
the largest Coca-Cola bottler in Africa,
accounting for approximately 40% of all
Coca-Cola beverage volumes in Africa.
2012
SABMiller and Anadolu Efes
form a strategic alliance
covering Turkey, Russia, the
CIS, Central Asia and the
Middle East.
2015
– SABMiller acquires the London-based
Meantime Brewing Company,
a pioneer in British modern craft beer.
– The board of SABMiller reaches
agreement on the terms of a
recommended offer for the
company by Anheuser-Busch InBev
SA/NV (AB InBev).
STRATEGICREPORTFINANCIALSTATEMENTSGOVERNANCESHAREHOLDERINFORMATION
1SABMiller plc Annual Report 2016
Business overview
North America
Where we operate
Regional office:
Chicago, USA
MillerCoors is a joint venture
with Molson Coors Brewing
Company, which was formed in
2008 by bringing together the
US and Puerto Rican operations
of both groups.
What we do
– MillerCoors is the second
largest brewer in the USA,
with 27% of the beer market.
– Our wholly-owned Miller
Brewing International business
is based in Milwaukee, USA
and exports and sells our
brands to Canada, Brazil
and Mexico and throughout
the Americas.
Read more on page 34
We have a balanced
spread of businesses
with a significant
presence in
developing markets
1
Before Corporate costs.
2
On an organic, constant currency
basis.
3
Subsidiaries only, excluding home
markets, on a constant currency basis.
4
Subsidiaries only, excluding home
markets.
Our global brands are Peroni Nastro Azzurro, Miller Genuine Draft,
Miller Lite, Pilsner Urquell, and Grolsch.
+12% +13%
NPR premium NPR global
brands growth3
. brands growth4
.
70,000
US$5,810m
Group EBITA (2015: US$6,367m).
69%The proportion of EBITA
from developing markets.
Our five shared
imperatives are
aligned with
12 of the 17
UN Sustainable
Development Goals.
Latin America 33%
US$1,959m
Africa 29%
US$1,708m
Asia Pacific 13%
US$753m
Europe 11%
US$636m
North America 14%
US$865m
EBITA by region1
%
140,000
Every minute of every day,
more than 140,000 bottles
of SABMiller beer are enjoyed
around the world.
SABMiller has 70,000
employees and is in more
than 80 countries.
94%
The proportion of our
total lager volume from
markets in which we have
no 1. or no. 2 national market
share positions.
6%Soft drinks
volume growth.
#1
#2
+1%
Group lager volume.
249m hl
8%
2
Subsidiary NPR growth.
SABMiller by numbers
2 SABMiller plc Annual Report 2016
STRATEGIC REPORT
Europe
Where we operate
Regional office:
Zug, Switzerland
Our primary brewing operations
cover nine countries: the Czech
Republic, Hungary, Italy, Poland,
Romania, Slovakia, Spain (Canary
Islands), the Netherlands, and
the UK.
Asia Pacific
Where we operate
Regional office:
Hong Kong
Our brewing interests across Asia Pacific
cover four countries: Australia, China, India,
and Vietnam.
What we do
– CR Snow, our partnership of more than
20 years with China Resources Beer
(Holdings) Co Ltd, is the largest brewer
in China.
– Carlton & United Breweries (CUB) is
the second largest Australian brewer.
– We are the second largest brewer
in India.
– We have a brewery in Vietnam, and we
export to numerous markets including
South Korea.
Read more on page 26
What we do
– In the majority of these countries we are the number one
or two brewer by market share.
– We cover a further 16 countries including Russia, Turkey,
and Ukraine in a strategic alliance with Anadolu Efes
through brewing, soft drinks and export operations.
– We export significant volumes to a further six European
markets, of which the largest are Germany and France.
Read more on page 30
Africa
Where we operate
Regional office:
Johannesburg, South Africa
Our primary brewing and beverage
operations in Africa cover 17 countries
including Botswana, Mozambique,
Nigeria, South Africa, Tanzania, Uganda,
and Zambia. A further 21 countries are
covered through our associate interests
in the Castel group’s African beverage
businesses and we also have an
associated undertaking in Zimbabwe.
What we do
– In most of these countries we are the
number one brewer by market share.
– We produce Coca-Cola products in 23
of our African markets (with Castel in
15 of these markets and through our
associated undertaking in Zimbabwe).
Read more on page 22
Latin America
Where we operate
Regional office:
Miami, USA
Our primary brewing and beverage
operations cover six countries across
South and Central America: Colombia,
Ecuador, El Salvador, Honduras,
Panama, and Peru.
What we do
– In each of these countries we are the
number one brewer by market share.
– We have a brewery in Argentina, and
we export to Chile and Paraguay.
– We produce soft drinks across the
region including Coca-Cola products
in El Salvador and Honduras.
Read more on page 18
STRATEGICREPORT
3SABMiller plc Annual Report 2016
Chairman’s statement
Dear shareholder
The recommended offer from AB InBev
has naturally made this a momentous year
for your company. The proposed transaction
has inevitably been a distraction for the
senior leadership team and potentially for the
entire organisation, which is why it gives me
so much pleasure to report on another year
of strong underlying business performance.
Notwithstanding the impact of the transaction
and a volatile economic environment, we
achieved beverage volume growth of 2% and
group net producer revenue (NPR) and EBITA
growth, on an organic, constant currency
basis, of 5% and 8%, respectively. EBITA
margin, as a percentage of group NPR, on
the same basis, expanded by 60 basis points,
enabled by both top line performance and
by our cost reduction and productivity
improvements. These results are driven by
our strategy to expand the beer category and
strengthen our brand portfolios through our
affordability and premiumisation initiatives,
supported by innovation. They tell us that we
have the right strategy and that it works.
The continued depreciation of key operating
currencies against the US dollar had an
adverse impact on our reported results.
Reported group NPR, EBITA and adjusted
EPS declined by 8%, 9% and 6%, respectively.
Despite these adverse currency movements,
we delivered free cash flow of US$2,969
million, which has enabled continued
investment in our growth markets in Africa
and Latin America. The strength of the
group’s performance amply justifies the
board’s decision to recommend a final
dividend of 93.75 US cents per share,
bringing the total dividend for the year to
122 US cents, an increase of 9 US cents
over the prior year.
On 11 November 2015, AB InBev announced
a recommended cash offer, with a partial
unlisted share and cash alternative, for your
company. The most important task for the
board in the year was our consideration of
this offer. The board’s initial rejection of terms
that it considered did not adequately value
SABMiller resulted ultimately in significantly
improved offer terms, after six increases,
before agreement was reached between
Total dividend payment
122 US cents(2015: 113 US cents)
The AB InBev offer values the company at US$106 billion,
representing a total return to shareholders of about 1,500% since
listing in London in 1999. This is a tremendous achievement.”
4 SABMiller plc Annual Report 2016
STRATEGIC REPORT
SABMiller and AB InBev. Under the
agreement, AB InBev has agreed to use
its best efforts to secure the regulatory
clearances and authorisations necessary
to satisfy the pre-conditions and regulatory
conditions to the transaction, with a break
fee of US$3 billion being payable if these
clearances are not achieved. The agreed
cash offer represents a significant premium
and cash return for our shareholders,
securing early delivery of the company’s
long-term value potential.
At the time of writing, the transaction is
going through the regulatory processes
and good progress is being made. However,
until AB InBev’s offer is made to and
approved by shareholders, and the
transaction completes, the board remains
focused on the need for our business to
continue to perform strongly and for our
strategic objectives to be executed as an
independent business. We have therefore
continued to uphold rigorous standards,
and in the corporate governance report
on pages 54 to 69, there is a detailed
description of the directors’ approach
to corporate governance, our application
of the UK Corporate Governance Code,
and our views on the role and effectiveness
of the board.
In the months before becoming Chairman,
I was delighted to have the opportunity to
introduce myself to most of our major
shareholders and to listen to their comments
and concerns. These meetings provided
invaluable background when, later in the
year, I had to discuss with them the offer
from AB InBev. Our conversations were open
and constructive, and I am grateful to our
shareholders for their continued support.
SABMiller is an extraordinary success story.
From its origins in Johannesburg in 1895,
the group has grown to be a highly admired,
high-performing global beer and beverage
business. SABMiller has created significant
value for shareholders since listing on the
London Stock Exchange in 1999 with a
market capitalisation of US$5 billion. The
group expanded through organic growth
and a series of highly successful acquisitions
and joint ventures on five continents. Today
our unmatched footprint in fast-growing
developing markets is underpinned by our
portfolio of iconic national and global brands.
The AB InBev offer values the company at
US$106 billion, representing a total return
to shareholders of about 1,500% since
listing in London in 1999, or a compound
return of around 17.4% per year. This is
a tremendous achievement and a great
tribute to the vision of our leaders and the
commitment of our people around the world.
However, these impressive statistics tell only
part of the story. SABMiller has always aimed
to play a positive role in the communities
where it operates, right across the world.
Our global sustainable development ambition
is called Prosper, and this sums up our
philosophy that when communities prosper,
our business prospers. Prosper includes
commitments in five areas that promote:
accelerating growth throughout our value
chain; responsible and moderate alcohol
consumption; secure water supplies;
reducing waste and carbon emissions;
and supporting farming. All of our Prosper
initiatives are designed to protect our
business and improve livelihoods, to support
long-term sustainable growth, and therefore
to create value for shareholders. It has been
a privilege over the past year to see for myself
how deeply management and employees
believe in SABMiller’s stated purpose: to
bring refreshment and sociability, improve
livelihoods and help build local communities.
I am honoured to acknowledge the role
played by successive boards over the years
for their stewardship of the company and for
their consistent support and encouragement
of management. I am also most grateful to
my fellow board members for their support,
commitment, skill and wisdom over the last
year, especially as we navigated the AB InBev
offer. There were a number of changes in the
board this year: we welcomed our new CFO,
Domenic De Lorenzo, as well as two new
non-executive directors, Javier Ferrán and
Dave Beran. Dave succeeded Howard Willard
as an Altria nominee to the board. Our sincere
thanks to John Manser, John Manzoni
and Howard Willard for their invaluable
contributions since joining the board in
2001, 2004 and 2009, respectively.
The board’s sincere thanks and
congratulations are due to our Chief
Executive Alan Clark and the members
of the executive committee, and indeed to
our 70,000 people around the world, for
their tremendous achievements over the
last year. They have continued to execute
our group strategy, maintaining the energy
and momentum in our business, while
dealing with the considerable distraction
of the AB InBev offer. The performance
of our business is a testament to their
unwavering focus on delivering for
consumers and shareholders.
Jan du Plessis
Chairman
10 June 2016
The agreed cash
offer represents a
significant premium
and cash return
for our shareholders,
securing early
delivery of the
company’s long-term
value potential.”
STRATEGICREPORT
5SABMiller plc Annual Report 2016
Chief Executive’s review
Business performance
We achieved strong underlying performance
for the year. We grew EBITA across all
regions and our group EBITA margin
improved through the year, on an underlying
basis. This performance reflects our focus on
driving superior growth by strengthening our
core brands, expanding the beer category to
reach more consumers on more occasions,
and placing an emphasis on premiumisation
in all regions. As noted through the year, the
strengthening of the US dollar against our
operating currencies had a material negative
impact on reported results.
Our affordability and premiumisation
initiatives have allowed us to capture growth
in developing markets and capitalise on key
trends in developed markets. Our subsidiaries
achieved organic volume growth of 5% and
NPR growth of 8% on an organic, constant
currency basis, with a particularly good
performance in a number of key markets.
This was offset by a more muted
performance in our associates and joint
ventures held back by headwinds in their
major markets and continued weak industry
trends in the USA, such that group NPR grew
by 5% on the same basis. Premium lager
brands’ NPR grew by 12%1
and global lager
brands’ NPR grew by 13%1
, both on a
constant currency basis, with growth across
all regions. Our underlying growth accelerated
in the year, driven by improving momentum
in Latin America, continued strong and
well-balanced momentum in Africa, and
improvements in Australia and Europe in
the second half. On a reported basis, group
NPR and EBITA declined by 8% and 9%,
respectively, reflecting the depreciation of
our key operating currencies against the
US dollar.
1
On a subsidiary basis, excluding home markets for
global brands.
Our strong underlying performance reflects our focus on driving
superior growth by strengthening our core brands, expanding the
beer category to reach more consumers on more occasions, and
emphasising premiumisation.”
6 SABMiller plc Annual Report 2016
STRATEGIC REPORT
Supporting small enterprises, supporting growth
Small businesses play a critical role across our value chain and are the lifeblood of local
economies and communities. In Africa, as part of our Go Farming strategy, we assist farmers
by using local crops to produce our affordable beers. In Uganda, Eagle Lager – a beer brewed
from locally-sourced sorghum – supports more than 20,000 smallholders. It has inspired similar
initiatives throughout Africa. Across the world, we help retailers develop the skills to grow their
businesses, sell beer responsibly, access finance, and lead improvements in their communities.
Our 4e programme in Latin America pioneered this approach and to date has supported over
20,000 small-scale shopkeepers.
Read more online www.sabmiller.com/prosper
By creating a more integrated global
business we have been able to cut costs
and free up in-market resources to achieve
our strategic objectives. We continue to focus
on improving our in-country performance in
a cost efficient manner, supported by our
global cost and efficiency programme
which is ahead of schedule and delivered
cumulative net annualised savings of
US$547 million by the year end. The
programme is on track to achieve our 2020
target of US$1,050 million. These initiatives
mitigated adverse transactional currency
headwinds. Exceptional charges of US$721
million before tax, principally relating to the
impairment of our investments in Angola and
South Sudan, together with costs associated
with the AB InBev transaction, resulted in a
16% decline in profit before tax.
We are expanding our exposure to growing
markets and building the optimum portfolio
of lager, soft drinks and other alcoholic
beverages to capture growth. Soft drinks
volumes grew by 6%. On 10 May 2016, the
South African Competition Tribunal approved,
with agreed conditions, the formation of
Africa’s largest soft drinks beverage
operation, Coca-Cola Beverages Africa
(CCBA) in which we will have majority
ownership. We expect the transaction
to complete in early July 2016.
Well-positioned for superior
topline growth
SABMiller’s business is beer and soft
drinks, giving us the benefit of operating
in the two largest profit pools in global
packaged beverages.
We are further advantaged by the
geographical spread that we have built
over many years. This is biased towards
developing markets, which offer higher
long-term growth opportunities in both
volume sales and margin expansion.
Our developing markets exposure is
complemented by our scale in well-
established, highly profitable, and cash-
generative businesses in developed
markets, principally in the USA (through
our joint venture with Molson Coors),
Australia, and Europe.
As developing markets grow and disposable
incomes rise, per capita beer and soft drinks
consumption typically increase in parallel.
Keys to tapping into this growing demand
are availability and affordability. We offer
a range of beers appropriate to each
developing market, starting with affordable
and mainstream lagers and introducing more
local premium and international premium
beers as GDP rises.
Developed markets have higher profits
per hl but mainstream beer sales have been
in gradual decline for a number of years.
Competition from wine and spirits has
intensified at the same time as increasing
consumer focus on health and wellbeing has
led to overall declines in alcohol consumption.
More recently, the beer category has been
undergoing a renaissance as the popularity
of craft beers and easy-drinking lagers
has boomed, but this has intensified
competition with mainstream lager.
In these changing market dynamics,
SABMiller has adopted a strategy to expand
the beer category, which at its heart aims
to make beer more appealing to more
consumers on more occasions.
Our vision
To be the most admired beverage
company in the world.
Our purpose
We bring refreshment and sociability,
improve livelihoods, and help build
communities.
Our values
– People are our enduring advantage.
– Accountability is clear and personal.
– We work and win in teams across
the business.
– We are customer- and consumer-
focused.
– We do our best for local communities.
– Our reputation is indivisible.
STRATEGICREPORT
7SABMiller plc Annual Report 2016
STRATEGIC REPORT |Chief Executive’s review continued
This means supporting jobs and stimulating
growth, promoting responsible alcohol
consumption, and being good stewards
of water and other natural resources.
When communities prosper, our business
prospers too.
This year saw two ground-breaking
global agreements, which will shape the
development agenda for years to come:
the United Nations launched 17 Sustainable
Development Goals (SDGs), and world
leaders committed to tackle climate change
at COP21 in Paris.
Expectations of business are high, and we
welcome the challenge for companies to
step up and collaborate in addressing global
challenges. Many of the SDGs align with our
existing sustainable development strategy,
Prosper, and present opportunities to
strengthen our business as well as to
contribute to society. Putting Prosper at the
heart of our business enables us to drive
growth and commercial results, while making
a sustainable and measurable difference to
the communities and ecosystems in which
we operate. More information is available on
pages 48 to 51, as well as in our 2016
Sustainable Development Report.
Our people
Everyone should be able to return home from
work safely. We continue striving to reduce
or eliminate risks of harm to our employees,
contractors, and all others affected by our
business. Our global health and safety
programme, Safety Around Beverages,
sets out the minimum standards to which
all businesses should adhere. In addition,
our road safety campaigns across Africa
and Latin America are making a difference,
and we are committed to continuing to build
on this effort. Health and safety remains
a priority. More information is available
on pages 52 and 53.
Since the boards of SABMiller and AB InBev
reached agreement in principle on the key
terms of a recommended offer, looking after
our people has been a priority. To retain key
people for business continuity, our focus
has been on ensuring our people are
best-placed for their future careers; and
Some of the key elements in this strategy
include innovation that is scalable and
repeatable across multiple markets, from new
beer styles, including craft, to flavoured malt
beverages to low or zero-alcohol beers;
expanding the range of occasions on which
people will choose to drink beer rather than
other alcohol, such as with meals; and
tackling an age-old challenge of making beer
that is more appealing to women.
Recommended offer by AB InBev
Since the announcement of the AB InBev
offer, we have taken a number of steps to
ensure that we continue to focus on strong
performance, recognising our duty to deliver
sustainable value into the future.
We have continued to manage our business
based on our strategic priorities and budgets,
although some longer-term projects have
been deferred or adjusted. Our values,
leadership behaviours, culture, processes,
and routines have remained the foundation
for how we work and manage our business.
Throughout the period, we have continued
to reinforce our focus and priority on
consumers and customers, and to delight
them with our level of service and quality
brands of their choice. An extremely
important priority has been to maintain
employee engagement during the many
months between announcement of the
transaction and completion, and to ensure
that our employees are as well-placed as
possible for their future careers.
It is a huge credit to all of our people that
they have not allowed the uncertainty and
prospective changes to distract them from
delivering a very strong performance, with
momentum increasing in the second half.
This is testament to the strength and depth
of talent across our workforce, and their
resilience and dedication.
Prosper: our strategy for
sustainable growth
We have a proud beer heritage that began
over 120 years ago in South Africa. Since
then, our brewmasters around the world have
made beers people love by understanding
local tastes. We also aim to play a positive
role in the communities where we operate.
It is a huge credit
to all of our people
that they have
not allowed the
uncertainty and
prospective changes
to distract them from
delivering a very
strong performance,
with momentum
increasing in the
second half.”
Powering successful
innovation
Innovation is central to our strategy of
making beer more appealing to more
consumers on more occasions. To deliver
bigger, better innovations that can succeed
in more markets, we have integrated our
innovation expertise into three regional
centres. These locations bring together
multidisciplinary teams, with expertise
ranging from marketing and brewing to
packaging and procurement. Located in
Bogota, Johannesburg and Woking, the
three facilities serve, respectively, our
markets in Latin America, Africa and
Europe. Two of the year’s most successful
launches, Aguila Cero in Colombia and
Castle Milk Stout Chocolate Infused in
South Africa, involved people from
these teams.
8 SABMiller plc Annual Report 2016
keeping employee motivation and business
performance up during a prolonged period of
uncertainty.
There were several executive moves during
the year. Domenic De Lorenzo was appointed
Chief Financial Officer and joined the board in
July 2015, following his appointment as Acting
CFO in February 2015.
We announced in April that Tony van
Kralingen intended to retire at the end of 2015,
and that subsequently his role as Director of
Integrated Supply and Human Resources
would be split into two new positions on
SABMiller’s executive committee, namely
Group Director, Human Resources and
Group Director, Integrated Supply.
Johann Nel rejoined SABMiller as Group
Director, Human Resources in September
2015 and Philip Hodges was appointed
Group Director, Integrated Supply. He was
due to join in December 2015, but in the light
of the AB InBev offer, we agreed with Philip
that there was no point in his taking up
his new position. With this development,
Tony van Kralingen agreed to postpone
his retirement, and is continuing to act as
Group Director, Integrated Supply.
Tom Long retired as CEO of MillerCoors on
30 June 2015. He led MillerCoors as CEO
since 2011, having been president and chief
commercial officer since the launch of the
MillerCoors joint venture in 2008, and CEO
of Miller Brewing Company before that.
In September, we and our joint venture
partner, Molson Coors, announced that
Gavin Hattersley had been appointed CEO
of MillerCoors, following his tenure as interim
CEO since July.
I would like to thank all of my executive team
for driving our strong performance this year
and their enormous efforts in keeping the
business focused despite the potential
distraction from the AB InBev transaction.
Taking on spirits at their own game
When Castle Milk Stout was challenged in South Africa by the
rise in popularity for spirits we evolved the brand to make it more
attractive to spirits drinkers. Castle Milk Stout’s dark colour,
complex taste and traditional image were off-putting for some
people, but loved by devotees. So we transformed Castle Milk
Stout’s pricing and packaging in South Africa from mainstream to
premium, imitated spirit brands by communicating the product’s
uniqueness, and introduced a chocolate variant, Castle Milk Stout
Chocolate Infused. This year volumes for Castle Milk Stout in South
Africa, including the chocolate variant, were up by 14%.
Managing water and climate change risk
Water scarcity is our most significant climate change-related challenge, with certain SABMiller
breweries already facing significant risk. We have completed water risk assessments for nearly
all our breweries and established plans to tackle the main issues, often with partners. We are
on track to meet our target of using 3.0 hectolitres (hl) of water for 1 hl of beer by 2020, having
used an average of 3.2 hl/hl during the year. We have reduced carbon emissions from on-site
energy use by 36% in absolute terms between 2008 and 2016 and are on course to meet
our 50% carbon efficiency target by 2020. Within our cost saving programmes, we saved
US$1161
million in the year from water and energy initiatives, compared with 2010.
1
Reflects cost savings on an annual basis, based on savings actions initiated in 2010, and calculated using 2016
volumes, exchange rates and energy prices.
Read more online www.sabmiller.com/prosper
STRATEGICREPORT
9SABMiller plc Annual Report 2016
STRATEGIC REPORT |Chief Executive’s review continued
Addressing risks
We place great emphasis on identifying,
monitoring, and mitigating risks to our
business and we have a well-developed risk
management process which includes detailed
mitigating action plans. In the year, the risk
management process was refined and further
enhanced to ensure alignment with Financial
Reporting Council (FRC) revisions to the UK
Corporate Governance Code.
The principal risks and uncertainties which
the group faces have been updated and
broadened to reflect the changed situation
as a result of the AB InBev offer and are
set out on pages 16 and 17. Two new
transaction-related risks have been added:
first, failure to comply with anti-trust legislation
and the necessary information security
protocols in place during the offer period,
and, secondly, the impact on stakeholders
if the transaction does not complete.
As a result of the most recent review
completed by the board, three of the
previous year’s principal risks (relating to
industry consolidation, delivering business
Fresh tank beer rejuvenates classic brands
Our oldest, most revered brands are enjoying a fresh lease of life thanks to our tank
concept. During the year, Club Colombia became our latest brand to be available
on-premise from a gleaming 500 litre copper tank. The Colombian beer’s tank debut
means that consumers now have the opportunity to try nine of our premium brands as
tank beer across 16 countries, including unpasteurised Pilsner Urquell in the UK and Castle
Lager in South Africa. The great taste and novelty of fresh tank beer, which is delivered
direct from the brewery in branded trucks, is proving extremely popular with consumers.
(Clockwise from top left)
Carlton Draught, Castle 1895 Draught, Club Colombia and Pilsner Urquell
10 SABMiller plc Annual Report 2016
transformation, and the acquisition of CUB)
are no longer considered as being principal
risks of the group or are not currently relevant.
Management has defined robust mitigation
actions and monitoring mechanisms
supported by assurance processes for
all principal risks. There has been good
progress in respect of mitigation actions
during the year.
Outlook
We expect to deliver good underlying
performance in the year ahead. Our cost
and efficiency programme is on track to reach
targeted annualised savings of US$1,050
million per annum by the financial year ending
31 March 2020. We anticipate that we will
continue to face foreign exchange volatility
and the results of certain of our key
operations will be impacted by currency
depreciation against the US dollar.
Conclusion
As this may be SABMiller’s final annual
report, it is worth reflecting on what we have
achieved. We grew from small beginnings,
brewing quality cold beer for thirsty miners
in the dusty streets of 19th century
Johannesburg. More than 120 years later,
generations of incredibly talented people
have built a highly-admired, high-performing,
global beer and beverage business.
We have always nurtured the art of brewing,
which has given us a stable of locally-loved
and internationally-famous beers. What
has also made us special is our deep
understanding of navigating different local
markets, catering for local tastes and helping
to build the communities around us.
Listing on the London Stock Exchange in
1999 was the launch pad for our global
ambitions, leading to the creation of the
number two global brewer and a FTSE-10
company. Upon listing, the value of the
business was £3.3 billion. The £44 per share
proposed by AB InBev values us at almost
£70 billion. This is an outstanding result by
any measure.
The SABMiller story is a simply amazing
achievement, and everyone who has been
a part of it should feel immensely proud of the
value they have helped to create. I am sure
the next chapter will bring new opportunities
for exceptional success.
Alan Clark
Chief Executive
10 June 2016
Key strategic priorities
Drive superior topline growth through strengthening
our brand portfolios and expanding the beer category
– Strengthen our local and global brand portfolios to capture superior
profitable growth.
– Accelerate premium mix and the growth of our premium brands.
– Develop and expand the category to capture new consumers,
new occasions and grow category share of value.
– Prioritise and focus investment and resources on revenue growth
in key markets and segments.
Build a globally integrated organisation to optimise
resource, win in market and reduce costs
– Systematically build a high performance talent pool.
– Up-weight and right-size out of market structures to ensure optimum
service delivery at an affordable cost.
– Develop a commercial operating model that will facilitate winning
in and across markets.
– Reduce costs to drive growth and returns.
Actively shape our global mix to drive a superior
growth profile
– Focus resources on highest growth opportunities.
– Deliver superior performance in soft drinks operations.
– Build material positions in new categories in attractive markets.
– Mergers and acquisitions to access new growth in attractive markets.
STRATEGICREPORT
11SABMiller plc Annual Report 2016
Our business model is built
on our passion for beer
We are local beer experts. Our success is rooted in deep local insights,
global skills, talented people and community investment.
Creating sustainable value chains
We create sustainable value chains that contribute to local economic and social development.
Understanding consumer tastes
and applying local insights
Sharing our consumers’ passion for local beer, more than 200 of
our brands are mostly sold locally in their country or region of origin.
We have a selected number of regional and global brands, which
complement our local portfolios.
Using global skills and scale
to drive local performance
Our local markets focus on commercial activity, producing, marketing
and selling the right beers and beverages for their area.
We support our country operations with broader, shared service
operations. These help us to achieve economies and efficiencies
of scale and drive duplicative costs out of local businesses.
We also share best practice and success across our markets
in innovation, marketing, technical standards and training.
Investing in talent for
competitive advantage
We are proud to attract and retain the best talent, and invest in
individuals’ skills and careers.
The global mobility of our leaders is one of our major strengths,
by moving around, they take insights into new markets.
We incentivise management at every level through a rigorous goal-
setting process that aligns the need for commercial success with the
longer-term ambition of achieving sustainable best practice.
Refreshing our success: innovation
and selling across the price spectrum
We enhance our enduring brands with innovation across a vibrant
spectrum of beer styles to reflect demographic, cultural and societal
shifts and evolving consumer tastes.
We reinvigorate national icon brands to keep our strength in core lager
and are developing products for more occasions and consumer types.
Our brands range from entry-level beers, including sorghum and
cassava beers such as Eagle and Impala to international super premium
beers such as Peroni Nastro Azzurro.
Sourcing
Working closely with suppliers, including
large-scale and smallholder farmers who
grow quality crops, and sourcing locally
where we can.
Brewing
Producing beers that taste great demands a
mix of traditional craftsmanship, modern
science and fresh, natural ingredients.
Bottling and distribution
Delivering quality, fresh beers and soft drinks for
our consumers to enjoy while minimising waste
and promoting returnable bottles and recycling.
12 SABMiller plc Annual Report 2016
STRATEGIC REPORT
Delivering
value for our
stakeholders:
– sustainable
superior returns
for shareholders;
– refreshment and
sociability for
consumers;
– jobs and career
development for
employees;
– incomes and
livelihoods for
suppliers and
retailers;
– growth for
national
economies; and
– support for
communities.
Working with associates and joint ventures
We generate a significant amount of group NPR from interests in
associates and joint ventures and in Africa we have significant minorities
in our subsidiaries. These have facilitated our global expansion and are
valuable where local knowledge is an important asset.
Retail
Partnering with small and large retailers
in the on- and off-trade segment to
bring refreshment and sociability
to our consumers.
Consumers
Listening and responding to changing
consumer needs, using local insight
and broadening our appeal across new
segments and occasions.
Partnering for
shared prosperity
By supporting the small businesses across our value chains – and in local
communities – to prosper, our business will prosper too.
By joining forces with others who share our goals, we can co-ordinate
action and unlock innovation for job creation, responsible alcohol
consumption, watershed protection, lower carbon emissions and more
productive use of land.
We tailor our approach in response to challenges, widening and deepening
partnerships as our understanding develops and our initiatives grow.
STRATEGICREPORT
13SABMiller plc Annual Report 2016
Market overview
Beer accounts for almost one-third of global retail sales value in
packaged beverages, with attractive industry margins. The global soft
drinks market is slightly larger than that for beer, accounting for
approximately 40% of global retail sales value in packaged beverages.
The global beer market is relatively
consolidated, with the top four largest
brewers (AB InBev, SABMiller, Heineken,
and Carlsberg) accounting for around 50%
of global volumes and will consolidate further
on completion of the AB InBev transaction.
SABMiller is the number two globally, which
gives us the opportunity to leverage our scale,
global brands and skills to improve in-market
performance. Given the importance of local
brands and scale, the strength of local market
positions is also important to sustainable
long-term performance in beer, and 94%
of our beer volumes come from markets
where we are the number one or two brewer.
The nature of competition and competitive
intensity varies by market, but we typically
compete not only against the major global
brewers, but also with small and large local
brewers and other alcohol producers.
The global beer market has been growing
at 2% to 3% over the past 10 years. However,
there is a clear difference in growth, category
dynamics and characteristics between
developing and developed markets and,
accordingly, in the growth opportunities
they present.
Developing markets
Developing markets offer significant
underlying demand-led growth, with
growth in beer consumption driven by:
– affordability, with per capita consumption
increasing sharply as consumer disposable
income levels grow;
– beer being an aspirational and higher
quality beverage compared with other
competing alcoholic beverages in these
markets, which are typically local spirits
or informal/illicit alcohol; and
– demographics and drinking occasions
being skewed towards core beer
consumers, with mainstream lager critical
to growth.
Ensuring the affordability, availability and
quality of core mainstream lager is critical
to growth in these markets. However, while
the beer category is heavily focused on
mainstream lager, the rise in disposable
incomes provides opportunities for
premiumisation through local and
international brands.
Compared with our global competitors,
a greater proportion of our total profit and
volumes comes from developing markets.
This has helped support our superior rates
of organic topline growth.
Developed markets
In contrast with developing markets, volume
and consumption growth in more developed
markets have typically been flat or have
declined over the past decade. This reflects
both a general decline in alcohol consumption
and a fall in beer’s share of total alcohol.
There are many reasons for this shift and the
increasing fragmentation of consumer choice,
including changes in the nature of drinking
occasions and in the demographics of
alcohol consumers. These changes include
the growth of mixed gender drinking
occasions and ageing populations.
These dynamics are challenging, but they
also represent future growth opportunities
for the beer category. For example, increased
consumer demand for variety and new
experiences has driven the higher growth
of different beer styles outside of core lager,
notably in the US craft beer segment but also
across other developed markets.
Delivering topline growth in these markets
is dependent on successful premiumisation
to drive revenue per hectolitre growth and on
appealing to more consumers on more
occasions, by:
– improving core mainstream lager offers
to better meet the needs of a wider range
of consumers;
– innovating to evolve portfolios towards
more attractive growth segments; and
– regaining share from other beverages.
Soft drinks
Sparkling, or carbonated soft drinks (CSDs),
make up approximately 40% of total soft
drinks global retail sales value. Global soft
drinks volumes have been growing at around
4% per year over the past 10 years, with the
category demonstrating similar consumption
characteristics and growth dynamics to beer,
with rapid growth and increasing levels of per
capita consumption as markets develop.
Soft drinks also show a similar overall
category development dynamic to beer.
In developing markets, CSDs and bottled
water are the dominant sub-categories,
but fragmentation of the category occurs
as markets develop, with still drinks, juices,
and premium bottled water becoming
much more evident. As with beer, scale and
leadership in a market is critical to long-term
sustainable success.
14 SABMiller plc Annual Report 2016
STRATEGIC REPORT
Key performance indicators
The key performance indicators (KPIs) outlined below are used to monitor progress
against our overall financial goal and our strategy, which defines how we will achieve
this goal. While our strategy naturally evolves and changes in line with market conditions,
it continues to guide our short, medium and long-term growth.
Measuring our progress
What we measure Why we measure How we have performed
Financial goal 2016 2015 2014
Total shareholder return in excess
of the median of our peer group over
five-year periods
To monitor the value created for our shareholders
over the longer term relative to alternative investments
in the drinks industry, in line with our business
performance goal
13 % pts 36 % pts 98 % pts
Growth in adjusted earnings per share To determine the improvement in earnings per share
for our shareholders at reported exchange rates
-6% -1% 2%
Growth in adjusted earnings per share
(constant currency)
To determine the improvement in earnings per share
for our shareholders at constant exchange rates
12% 5% 9%
Free cash flow To track cash generated to pay down debt, return
to our shareholders and invest in acquisitions
US$2,969m US$3,233m US$2,563m
What we measure Why we measure How we have performed Associated
strategic
priorities
Commercial and strategic goals 2016 2015 2014
The proportion of our total lager volume
from markets in which we have no. 1 or
no. 2 national market share positions
To gain an overall picture of the relative strength
of our market positions 94% 94% 95%
The proportion of group EBITA from
developing economies
To assess the balance of our earnings exposure
between regions of the world economy with highest
growth potential and more developed regions
69% 72% 72%
Organic growth in total beverage volumes To track the underlying growth of our business
2% 1% 2%
Group net producer revenue growth
(organic, constant currency)
To assess the underlying rate of growth in net sales
value of our brand portfolios
5% 5% 3%
Net producer revenue growth in premium
brands (constant currency)
To monitor progress in building our portfolio of global
and local premium brands
12% 8% 3%
EBITA growth (organic, constant currency) To track our underlying operational profit growth
8% 6% 7%
EBITA margin progression (organic,
constant currency)
To monitor the rate of growth in our underlying
operational profitability
60 bps 30 bps 90 bps
Hectolitres of water used at our breweries
per hl of lager produced
To gauge our progress in reducing the amount
of water used in our breweries
3.2 hl/hl 3.3 hl/hl 3.5 hl/hl
Fossil fuel emissions from energy use at
our breweries per hl of lager produced
To assess progress towards reducing fossil fuel
emissions at our breweries
8.9 kgCO2e/hl 9.4 kgCO2e/hl 10.3 kgCO2e/hl
Cumulative financial benefits from our
cost and efficiency programme
To track the cost and efficiency savings from the
programme to leverage our skills and scale
US$547m pa US$221m pa n/a1
1
Not applicable.
Key to strategic priorities
Drive superior topline growth through strengthening
our brand portfolios and expanding the beer category
Actively shape our global mix to drive a superior growth profile
Build a globally integrated organisation to optimise resource,
win in market and reduce costs
Further detail is contained within the finance review and the
sustainable development review. Remuneration is linked to our
KPIs as detailed in the directors’ remuneration report on pages
74 to 92. Detailed definitions are on pages 192 and 193.
STRATEGICREPORT
15SABMiller plc Annual Report 2016
Principal risks
Principal risk Context Specific risks we face Possible impact
Management
capability
We believe that our people are our enduring
advantage and it is essential that we develop and
maintain global management capability.
Our people are a source of competitive
advantage and will continue to be in the new
enlarged organisation or in a standalone business
if the AB InBev transaction does not complete.
– Failing to identify, develop and retain an
appropriate pipeline of talented managers for
the present and future needs of the group.
– Potential disruption to management and staff
arising from uncertainty during the AB InBev
offer period and exacerbated by the
complexity of potential disposals to facilitate
regulatory approvals.
– Failure to deliver the group’s
strategic and financial ambitions.
– Lower long-term profitable growth
– Loss of competitive advantage.
Regulatory
changes
With an increasingly high profile debate over
alcohol consumption in many markets, the
alcohol industry is coming under more pressure
from national and international regulators, NGOs
and local governments.
This risk has broadened as compared with
the previous year due to possible increased
regulatory scrutiny arising from the AB InBev offer.
– Regulation places increasing restrictions
on the availability and marketing of beer.
– Tax and excise changes cause pressure
on pricing.
– Anti-alcohol advocates erode industry
reputation.
– Lower growth, profitability and
reduced contribution to local
communities in some countries.
– Loss of consumer goodwill and
public sentiment.
Consistent
sustainable
revenue
growth
Consumer tastes and behaviours are constantly
evolving, and at an increasingly rapid rate.
Competition in the beverage industry is
expanding and becoming more fragmented,
complex and sophisticated.
Potential actions of our competitors and
stakeholders during the offer period could
impact the competitive environment and our
commercial performance.
– Failing to develop and ensure the strength
and relevance of our brands with consumers,
shoppers and customers.
– Failing to continue to improve our commercial
capabilities to deliver brand propositions which
respond appropriately to changing consumer
preferences.
– Topline growth progression does
not meet internal and external
expectations.
– Market positions come under more
pressure and market opportunities
are missed, leading to lower
profitability.
Information
and cyber
security
There is increasing sophistication of cyber-attack
capabilities. Business’s increasing demand for
consumers’ and customers’ personal data means
legislators rightly continue to impose tighter data
management control.
There is a heightened risk of information loss,
cyber security attacks and deliberate, harmful
acts as a result of possible disruption and
business distraction during the AB InBev
offer period.
– Disruption of information technology systems
and a loss of valuable and sensitive information
and assets.
– Significant business disruption.
– Failing to comply with tightening legislation
poses a threat of significant financial penalties
or restrictions.
– Loss of competitive advantage and
reputational damage through the
publicised loss of key operating
systems and confidential data.
– Adverse effect on profitability,
cash flows or financial position.
Confidentiality
and anti-trust
compliance
The business’s support for the AB InBev offer
and the post-transaction convergence planning
process through to change of control requires
clear and consistent compliance with anti-trust
legislation and information security protocols with
respect to provision of information to AB InBev
and other parties.
– Failure to comply with anti-trust legislation
and information security protocols results in
negative reputational impact, commercial
implications, and significant financial penalties.
– Loss of competitive advantage
and reputational damage.
– Adverse effect on profitability,
cash flows or financial position.
Transaction
fails to
complete
The AB InBev offer is subject to multiple
approvals from regulatory bodies and
shareholders.
– Transaction failure impacts the organisation
resulting in loss of momentum and short
and medium-term disruption to business
performance.
– Unsettled management and staff.
– Transaction failure poses threat to relationships
with external stakeholders including
shareholders, customers, suppliers, and joint
venture and associate partners.
– Loss of value.
– Loss of short-term competitive
advantage.
– Failure to deliver the group’s
short and medium-term strategic
and financial ambitions.
Focused on managing our risks
The principal risks facing the group and considered by the board and the executive committee
are detailed below.
The group’s risk management process is described in the corporate governance section while financial risks
are discussed in the finance review on page 47 and in note 21 to the consolidated financial statements.
16 SABMiller plc Annual Report 2016
STRATEGIC REPORT
Mitigation Associated strategic
priorities
Comparison to
previous year
– Building the group’s leadership talent pipeline through our Global Talent Management model, strategic people
resourcing and long-term talent pipeline.
– Sustaining a strong culture of accountability, empowerment, and personal development.
– Continuous employee engagement and communication to promote retention of key talent and use of incentive
programmes that support motivation and retention.
– Aligned goal setting focused on current priorities.
– Rigorous adherence to the principle of self-regulation backed by appropriate policies and management review.
– Building licence to trade capabilities across the group to facilitate sound risk analysis and mitigation plan development.
– Constructive engagement with government and all external stakeholders on alcohol-related issues.
– Investment to enhance the positive economic and social impact of our businesses in local communities and working
in partnership with local governments and local and global NGOs.
– Driving our Prosper shared imperatives to make a sustainable and measurable difference to the communities and
ecosystems in which we operate.
– Pursuing a beer category structure that enables us to grow both the value of the beer category, and our share of it.
– Ensuring we have a deep understanding of changing consumer and industry dynamics in key markets, enabling us
to respond appropriately to opportunities and issues which may impact our business performance.
– Ongoing evaluation of our brand portfolios in every market to ensure that they target current and future opportunities
for profitable growth.
– Building our brand equities through innovation and compelling marketing programmes; creating a pipeline of
opportunities to support our premium offering.
– Focus on monitoring and benchmarking commercial performance and developing the critical commercial capabilities
that are required in order to win in local markets.
– Active management of key relationships in local markets to minimise any potential disruption arising during the
AB InBev offer period.
– Continued development and implementation of information security policies.
– Increased investment to improve information security awareness, intelligence and implementation of sound
security processes.
– Building and enhancing processes to accelerate detection of, and deal with, IT security incidents.
– Group-wide communications and protocols developed and disseminated throughout the organisation.
– Engagement of external anti-trust counsel engaged at global and local levels to ensure SABMiller’s interests are
protected.
– Use of ‘clean teams’ and associated protocols to manage necessary information sharing as part of the regulatory,
disposals and convergence planning processes.
– Engagement with AB InBev to support timely transaction completion including support for disposal processes
and convergence planning assistance.
– US$3 billion break fee in place should the AB InBev offer fail to complete.
– Strong continued focus on delivery of strategy and financial performance, cost control and budget discipline in place
across the organisation.
– Management response plans in place should the AB InBev offer fail to complete.
Key
Associated strategic priorities Comparison to previous year
Drive superior topline growth. Build a globally integrated organisation
to optimise resources, win in market
and reduce costs.
Actively shape our global mix to
drive a superior growth profile.
New risk due to the
AB InBev offer
Risk broadened
due to the
AB InBev offer
STRATEGICREPORT
17SABMiller plc Annual Report 2016
Where we operate Lager volumes
46.6m hl
+6% +4%
Soft drinks volumes
20.6m hl
20,000retailers
supported
Since its launch, our 4e Path to
Progress programme has provided
more than 20,000 small retailers
across Latin America with training
to improve their businesses
and livelihoods.
Significant business with
production operations
Selling operations and
major export markets
+8%
1
Group NPR
US$5,211m
+7%
1
EBITA
US$1,959m
Drive superior topline growth through our brands:
NPR growth was supported by premium lager volume growth
of 7% across the region;
Above mainstream brands Aguila Light and the alcohol-free
Aguila Cero delivered double digit growth in Colombia; and
Our affordability strategy in Honduras and El Salvador drove strong
volume and NPR growth in both countries.
Where we operate
1
Constant currency basis.
18 SABMiller plc Annual Report 2016
STRATEGIC REPORT |Operations review
Financial summary
Reported
2015
Net
acquisitions
and disposals
Currency
translation
Organic
growth
Reported
2016
Organic,
constant
currency
growth
%
Reported
growth
%
Group NPR (US$m) 5,768 – (1,020) 463 5,211 8 (10)
EBITA (US$m) 2,224 – (431) 166 1,959 7 (12)
EBITA margin (%) 38.6 37.6
Sales volumes (hl 000)
Lager 44,156 – 2,471 46,627 6 6
Soft drinks 19,865 – 747 20,612 4 4
Total beverages 64,021 – 3,218 67,239 5 5
Latin America reported NPR growth of 8%
on a constant currency basis (down 10% on a
reported basis), with beverage volume growth
of 5%. Lager volume growth of 6% was
underpinned by our affordability strategy
together with the successful targeting of new
consumption occasions with innovations and
effective marketing. Our NPR growth was
further supported by momentum in our above
mainstream and premium brands, with
premium lager segment volume growth of
7%, together with lager pricing and soft drinks
volume growth of 4%. EBITA growth of 7% on
a constant currency basis (down 12% on a
reported basis) was driven by the topline
performance while EBITA margin declined by
20 bps on a constant currency basis as cost
productivity and improved efficiencies in
manufacturing and distribution only partly
compensated for the currency pressure on
imported raw materials. The reported EBITA
margin decline of 100 bps reflected the
depreciation of our operating currencies
against the US dollar, which disproportionately
impacted our key Colombian operation.
In Colombia, group NPR grew by 11% on
a constant currency basis, with beverage
volume growth of 8%. Lager volume growth
of 11% reflected our bulk pack affordability
strategy and the success of our enhanced
sales service model. Our lager volume
growth, which was further supported by
shifts in consumer spending away from
durable goods, and favourable weather,
lifted our volume share of the alcohol market
Karl Lippert
President,
SABMiller Latin America
Lager volume growth of 6% was
underpinned by our affordability strategy
together with the successful targeting
of new consumption occasions with
innovations and effective marketing.”
STRATEGICREPORT
19SABMiller plc Annual Report 2016
by 220 bps. NPR growth was boosted by
selective price increases, trading up by
consumers and our continued focus on
revenue management. Our above mainstream
brands Aguila Light and the alcohol-free
Aguila Cero delivered double digit growth,
with robust growth from our mainstream
brands. Premium brands performed well,
particularly the Club Colombia brand family
which achieved double digit volume growth
and exceeded one million hectolitres for the
year. Volumes of our non-alcoholic malt
beverage brand, Pony Malta, declined 13%
following an unfounded social media rumour.
Raw material costs came under pressure due
to the adverse impact of the exchange rate on
our imported commodities as well as higher
prices for local raw materials. These impacts
were partially mitigated by the December
price increases and fixed cost productivity.
In Peru, group NPR growth of 7% on a
constant currency basis reflected beverage
volume growth of 4% with lager volumes up
2%. NPR was further enhanced by selective
price increases and positive brand mix
reflecting the continued trade up by our
consumers from Cristal to our above
mainstream brand Pilsen Callao. Our local
premium brand Cusqueña saw a return to
growth through increased distribution and
rate of sale, and the success of its brand
variants. The expansion of our direct sales
and distribution model helped to offset the
impact of heavy rains that affected parts of
the country. Our volume share of the alcohol
market continued to grow, up 180 bps,
as we expanded the category with gains
captured mostly from informal alcohol.
Soft drinks volumes grew by double digits
driven by our water brand San Mateo and
sparkling soft drink Guarana. Financial results
also benefited from manufacturing and
distribution efficiencies.
In Ecuador, group NPR grew by 1% with
beverage volumes down 2% as a result of
weaker economic conditions, increased
enforcement of trading restrictions and the
effect of heavy rains on both consumption
patterns and distribution. Group NPR growth
was aided by selective price increases
together with positive brand and pack mix,
as consumers continued to trade up from
Pilsener to the more profitable Pilsener Light
packs. Our volume share of the alcohol
market, down 270 bps, was driven by the
consumer shift to our lower alcohol content
beers, but we outperformed the beer
category with volume share growth of 70 bps.
Higher duties on imported materials were
mitigated by further cost productivity which
enhanced our margin.
In Panama, group NPR declined by 12%
owing to a rise in beer excise duties in April,
a strike in July and intensified competition,
which particularly impacted our premium
segment. Lager volumes decreased by 16%
with a decline across all segments, which
resulted in a 330 bps1
decline in our volume
share of the alcohol market. However our
innovations targeted at the growing light
segment yielded encouraging growth. Soft
drinks volumes were down 3% in a highly
competitive market. Cost discipline only
partially offset the impact of the softer
topline performance.
Delivering affordable brands
Our affordability strategy has helped deliver impressive returns in Latin
America. When we entered the region in 2005, beer consumption was
limited by its high cost, relative to wages, and due to it generally being
available in just one pack size. Our innovative response, which has
included introducing varied pack sizes and flexible pricing, led to a
40% increase in the year in regional volumes of our affordable offerings.
In Colombia, for example, we successfully offered 750ml bottles and
473ml cans; in El Salvador our Tabernitas outlet development
programme further increased sales of our 750ml products, and in
Honduras a price reduction on bulk packs helped achieve significant
increases in volume.
Over 100 years old and still
going strong
Our century-old beer Aguila is one of
Latin America’s top 10 brands, across all
sectors, and a national icon in its native
Colombia. During the year we continued to
build on Aguila’s rich heritage: Aguila Cero
gained more than 90% of the non-alcoholic
beer category in Colombia within one
year of launch; Aguila Light, which we
introduced in 2002, remained the fastest
growing national beer brand in the country,
and the original Aguila made a significant
growth rate recovery by strengthening its
ties with football. Overall, in the year the
Aguila brand franchise achieved double
digit growth in volume.
1
On an adjusted like for like basis.
20 SABMiller plc Annual Report 2016
STRATEGIC REPORT |Operations review |Latin America
In Honduras, group NPR grew by 12%
on a constant currency basis and beverage
volumes increased by 11%. Strong lager
volume growth of 21%, with a 600 bps1
gain
in our volume share of the alcohol market,
was underpinned by the execution of our
affordability strategy, which reinvigorated the
category, and by unusually hot weather. Soft
drinks volume growth of 9% also benefited
from the good weather.
El Salvador delivered group NPR growth
of 8% and beverage volume growth of 6%.
Lager volume growth of 9% was driven by the
expansion of our direct sales and distribution
model and supported a 110 bps increase in
our volume share of the alcohol market.
Growth in our mainstream brands, Pilsener
and Golden Light, reflected the consumer
adoption of the bulk packs, and our local
premium brand Suprema saw double digit
growth, which enhanced our brand mix. Soft
drinks volumes grew by 5%, with particularly
strong growth in still drinks.
Having completed water risk assessments at all our
Latin American breweries, we now understand the main
risks, and how they link to local watersheds. As part of our
response, we are working with The Nature Conservancy in
Peru, Colombia and Ecuador to build AquaFunds, which
source funding from water users to conserve ecosystems
that regulate water supplies for all.
Read more at www.sabmiller.com/nowaternobeer
Road traffic accidents are the cause of a significant
proportion of fatalities involving SABMiller employees. Our
Vía Responsable campaign in Panama introduced a holistic
approach to road safety, dealing with topics such as texting
while driving, speeding and drink driving. Between 2010 and
2014 there has been a 15% reduction in traffic accidents with
injuries. The programme is now being replicated across Latin
America as Por un Buen Camino (On the Right Track).
Read more at www.sabmiller.com/roadsafety
Read more about regional and country sustainability
priorities and performance at www.sabmiller.com/sam
Supporting small-scale retailers
Since its launch three years ago, our 4e Path to Progress
programme in Latin America has provided over 20,000 small
retailers – “tenderos” – with business and leadership training,
in partnership with the Inter-American Development Bank
(IADB) and FUNDES. Participating tenderos have reported
a 13% average sales growth in the year post training. During
the year we broadened the programme to include access to
micro-finance and technology.
Delivering on our sales strategy
A transformation of our Latin American sales operation is yielding
increased efficiency, cost savings and stronger customer
relationships. The establishment of a network of customer interaction
centres (CICs) serving Colombia, El Salvador and Ecuador has
been central to the change. The CICs provide centralised telesales,
customer service and collections and are a linchpin between the
field sales force and the rest of the business. They have enabled
the transition of our sales approach from one reliant on third party
distributors, wholesalers and manual ordering, to a sophisticated,
digitally-enabled direct service model with automated ordering.
1
On an adjusted like for like basis.
STRATEGICREPORT
21SABMiller plc Annual Report 2016
Where we operate Lager volumes
50.8m hl
+5% +8%
Soft drinks volumes
37.8m hl
Significant business with production operations
Associates
+11%
1
Group NPR
US$6,781m
+11%
1
EBITA
US$1,708m
Drive superior topline growth through our brands:
In the affordable category, Impala, our cassava-based beer,
and Eagle were the main drivers of growth;
Castle Lite continued to grow strongly, which helped to drive premium
segment growth of 11% for our subsidiaries; and
Our innovation pipeline delivered double digit growth for our premium
flavoured beer Flying Fish, along with the successful pan-African launch
of our premium, single malt beer Carling Blue Label.
AFRICA
22 SABMiller plc Annual Report 2016
3.5hl
water/hl beer
1
Organic, constant currency basis.
This year our breweries in Africa
improved their water efficiency by
6%, using on average 3.5hl of water
to produce 1hl of beer.
22 SABMiller plc Annual Report 2016
STRATEGIC REPORT |Operations review
Financial summary
Reported
2015
Net
acquisitions
and disposals
Currency
translation
Organic
growth
Reported
2016
Organic,
constant
currency
growth
%
Reported
growth
%
Group NPR (including share of associates) (US$m) 7,462 43 (1,519) 795 6,781 11 (9)
EBITA1
(US$m) 1,907 8 (423) 216 1,708 11 (10)
EBITA margin (%) 25.6 25.2
Sales volumes (hl 000)
Lager 48,413 41 2,349 50,803 5 5
Soft drinks 34,901 1 2,884 37,786 8 8
Other alcoholic beverages 7,618 (2) 158 7,774 2 2
Total beverages 90,932 40 5,391 96,363 6 6
1
In 2016 before a net exceptional charge of US$422 million, being impairments and related charges of US$508 million arising from Angola and South Sudan, net of the group’s US$86 million
share of a gain recognised as a result of Castel’s operations in Tunisia being reclassified from an associate to a subsidiary following the acquisition of additional shares (2015: net exceptional
credit of US$45 million, being additional profit on disposal of a business in 2012).
In Africa, group NPR grew by 11% on an
organic, constant currency basis (down 9%
on a reported basis), reflecting beverage
volume growth of 6% supported by our
affordability strategy, selective price increases
and continued premiumisation in South
Africa. On an organic, constant currency
basis, our subsidiaries achieved volume and
NPR growth of 8% and 12%, respectively,
with increased topline momentum in the year,
notwithstanding increased currency and
economic volatility in the second half. Our
associate, Castel, delivered more modest
growth, predominantly due to very
challenging macro-economic conditions
in its key market of Angola.
The Castle Lite brand continued to grow
strongly, which helped to drive premium
segment growth of 11% for our subsidiaries
in the region and increased premium mix.
Our strategy of price moderation assisted the
growth in the mainstream segment while in
the affordable category, Impala, our cassava-
based beer, and Eagle were the main drivers
of growth. Our innovation pipeline delivered
double digit growth for our premium flavoured
beer Flying Fish, along with the successful
pan-African launch in the second half of the
year of our premium, single malt beer Carling
Blue Label. Soft drinks volumes increased by
8%, against a strong comparative. Traditional
beer volumes returned to growth in the
second half which resulted in growth of 1%
for the full year. Chibuku Super grew by
double digits driving its share of our traditional
beer volumes to 27%.
Our regional performance reflected our focus
on cost management, premiumisation and the
introduction of more affordable pack sizes.”
Mark Bowman
Managing Director,
SABMiller Africa
23SABMiller plc Annual Report 2016
STRATEGICREPORT
23SABMiller plc Annual Report 2016
Bringing Africans together
Castle Lager has been bringing Africans together for over 120 years, since the days of gold
prospecting in Johannesburg. Today Castle Lager is brewed in nine African countries and
exported to many more. This cross-continental success reflects our strategy of establishing
consistent regional brands across Africa. This has led us to align the brand’s recipe, packaging
and brand foundation, to launch a powerful African marketing campaign, ‘It all comes together
with a Castle’, and to sponsor the COSAFA Castle Football Cup in southern Africa for the
coming five years. During the year, Castle Lager achieved a 9% increase in volumes in South
Africa, and 8% growth on the rest of the continent.
EBITA grew by 11% on an organic, constant
currency basis (down 10% on a reported
basis), with EBITA margin expansion of
10 bps constrained by the performance of our
associates. The depreciation of key currencies
against the US dollar created significant
pressure on raw material input costs which
was only partially offset by efficiencies
achieved in manufacturing and distribution.
Our regional performance reflected our focus
on cost management, premiumisation and
the introduction of more affordable pack sizes.
On a reported basis, EBITA margin declined
by 40 bps primarily due to the depreciation of
the South African rand, Tanzanian shilling and
euro against the US dollar (the euro being
Castel’s functional currency).
In South Africa, group NPR grew by 10%
on an organic, constant currency basis,
supported by selective pricing and
premiumisation against a tough economic
backdrop in which consumers’ disposable
income continued to be under pressure.
Beverage volumes increased by 6% and lager
volumes grew by 2%, with share gains across
the beer and total alcohol markets. This was
driven by our premium brand volume growth
of 13%, led by Castle Lite and Castle Milk
Stout. Volumes of our mainstream lager
brands declined by 1% driven by Hansa
Pilsener, partially offset by the growth of
Castle Lager. In the flavoured beer segment
there were strong performances from Redd’s
and Brutal Fruit. Soft drinks volume growth
of 10% in an increasingly promotion-driven
trading environment was supported by robust
growth of 17% in the second half, which
benefited from hot weather over the peak
trading period. Our focus on manufacturing
and distribution efficiencies, together with
fixed cost productivity in the SAB beer
business, partially offset the impact of
adverse currency on raw materials and
resulted in double digit EBITA growth
on an organic, constant currency basis.
In Tanzania, group NPR grew 5% on a
constant currency basis with beverage
volume growth of 7%. Lager volumes grew
by 7% with strong growth in the affordable
segment led by Eagle, as well as the
expansion into draught and smaller pack
sizes of Balimi. Other alcoholic beverages
grew by 3%, spurred by the growth of
Chibuku Super, partially offset by a subdued
performance from wines and spirits.
Profitability was adversely impacted by
the growth of the affordable segment and
traditional beer, the decline in wines and
spirits, transactional foreign exchange
pressure on raw materials, and increased
employee costs.
In Mozambique, a 20% increase in group
NPR on a constant currency basis reflected
beverage volume growth of 12%, together
with positive pack and category mix. Lager
volume growth of 15% was led by the Impala
brand, together with strong growth of our
mainstream brand 2M, primarily in the can
format. Other alcoholic beverages declined by
29% due to competition from informal wines
and spirits. EBITA growth on an organic,
constant currency basis was driven by the
topline performance, while margins declined
driven by the adverse transactional foreign
exchange impact on the cost base.
In Zambia, group NPR grew by 23% on
a constant currency basis with beverage
volume growth of 10% driven by lager
volumes up 30%, against a soft comparative.
Lager volume growth benefited from price
reductions at the beginning of the financial
year in anticipation of the excise duty
decrease which became effective in January
2016, together with the strong performance of
Castle Lite in the premium segment and Eagle
in the affordable segment. Following pricing
taken earlier in the year, soft drinks volumes
returned to growth in the second half to end
the year with volume growth of 1%. Traditional
beer volumes grew by 5% driven by double
digit growth in Chibuku Super.
Group NPR in Nigeria grew by 31% on a
constant currency basis with volume growth
of 27%. Continued strong growth in our
mainstream lager brands, Hero and Trophy,
was underpinned by our expanded
distribution footprint, supported by increased
capacity and enhanced market execution.
Our non-alcoholic malt beverage category
also remained strong with double digit volume
growth driven by Beta Malt. On an organic,
The right ingredients for
affordable success
Our strategy of creating affordable beers
in Africa by using local crops has allowed
us to grow the beer category. It has also
supported thousands of subsistence
farmers, increased government excise
revenues and helped towards reducing
the consumption of harmful illicit alcohol.
In Uganda, our Eagle Extra lager uses
locally-grown sorghum rather than
imported malted barley. The brand is
a major part of the country’s affordable
segment and grew volumes by 15%
during the year. In Mozambique, our
cassava-based lager Impala has enjoyed
great success since its initial launch in
2011. During the year, its volumes
increased by 60%.
24 SABMiller plc Annual Report 2016
STRATEGIC REPORT |Operations review |Africa
From zero to Hero
The swift ascent of Hero in
Nigeria has delivered one of
our most successful launches
ever. Since it was introduced
in south-east Nigeria in 2012,
the lower mainstream brand
has outstripped competitor
brands to become the
regional market leader by
volume. This success
reflected our identification of
Hero’s characteristics – of
tenacity, strength and courage
– with those of the majority
Igbo people. In 2015 we took
Hero nationwide, with a brand
promise of inspiring and
recognising the hero in every
Nigerian. It has already
become one of the leading
national brands in Nigeria.
constant currency basis, EBITA growth
and robust EBITA margin expansion were
driven by the strong topline performance,
supported by marketing and fixed
cost productivity.
In Botswana, group NPR grew by 5%
on a constant currency basis supported by
moderate pricing and favourable category
mix. Beverage volumes were in line with the
prior year as volume growth in lager and soft
drinks of 11% and 6%, respectively, was
offset by a 16% decline in traditional beer
volumes due to the impact of water
shortages on production.
Group NPR in Ghana grew by 48% on
a constant currency basis, as moderate
pricing drove volume growth of 24%, and
the growth of non-alcoholic malt beverage
volumes, as opposed to water, led to
an improved soft drinks segment mix.
Non-alcoholic malt beverages delivered
robust growth as the capacity increase in
the prior year led to improved availability.
In Uganda, group NPR grew by 20% on
a constant currency basis, owing to volume
growth of 14%, supported by pricing. Lager
volume growth of 12% was driven by the
Eagle brand family in the affordable segment.
The continuing turmoil in South Sudan
and the acute shortage of access to foreign
exchange in the country has significantly
impacted our performance in the second
half of the year. As a result, we have closed
the brewery and are now operating as an
import business.
Our associate, Castel, delivered group
NPR growth of 6%. Beverage volumes were
down 1%, constrained by weak economic
fundamentals in Angola where the local
currency has devalued substantially and
there is limited access to foreign currency.
Beverage volumes in Angola were down
19%, driven by the 18% decline in lager
volumes, and contributed to a double digit
decline in EBITA. Castel has undertaken
an impairment review in Angola and has
scaled back activity significantly. The
resultant impairment of our investment in
BIH (Angola), together with our share of
Castel’s impairment of its operations in
Angola, has been treated as exceptional.
Excluding Angola, Castel’s volumes were
up mid single digits driven by double
digit growth in the Republic of Congo,
Madagascar, and Burkina Faso. During
the year, Castel increased its interest in its
Tunisian operation, gaining control of the
business and resulting in a reclassification
of the operation from an associate to a
subsidiary. We have treated our share
of the gain recognised on the change
of control as exceptional.
Accelerating growth and social development is one of our top
priorities in Africa. Through our Go Farming strategy, we are
working with smallholder farmers to source affordable crops
that can be used for brewing. This year we also rolled out a
retailer programme and to date have trained over 9,000 small
shopkeepers and bar owners across 13 African countries in
business management and responsible retailing.
Read more about how we are supporting retailers in Africa
at www.sabmiller.com/africaretailersupport
We aim to create a healthy and positive work environment.
Our African Wellness Development Programme focuses
on health issues such as HIV/Aids and malaria. We
train employees to educate their peers by promoting
prevention, testing and treatment and reducing stigma.
We provided free voluntary counselling and testing for
56% of employees in the last year in countries where
HIV/Aids has a high prevalence (defined as greater than
5% of the population).
Read more about regional and country sustainability
priorities and performance at www.sabmiller.com/sam
Tackling water scarcity
Across Africa, water scarcity limits growth and opportunities
for millions of people. A number of our breweries also face
material water supply challenges, ranging from availability to
quality. Almost all of our breweries have now assessed their
value at risk, determined the specific nature of water risks,
and developed action plans to address them, often through
partnerships. In South Africa, for example, drought is
placing even greater pressure on scarce water resources.
We play a leading role in the Strategic Water Partners
Network (SWPN), through which government and the
private sector are working together to address pressing
water challenges.
Read more about how we are partnering to tackle water
risk on page 50.
STRATEGICREPORT
25SABMiller plc Annual Report 2016
ASIA
PACIFIC
In India, we have
worked with more than
18,000 farmers beyond
our value chain to
reduce water use and
increase productivity.
Increased
productivity for
18,000
farmers
Where we operate
Significant business with production operations
Associates
Selling operations and major export markets
+3%
1
Group NPR
US$3,650m
+13%
1
EBITA
US$753m
Lager volumes
70.3m hl
-1%
Drive superior topline growth through our brands:
Australia: Premium lager volume growth of 16% was led by Great Northern, together
with the sustained double digit growth of Peroni and Yak brand families; and
China: Snow Brave the World continued to grow by double digits and now represents
over 20% of CR Snow’s total volume, and over 27% of NPR.
26 SABMiller plc Annual Report 2016
1
Constant currency basis.
26 SABMiller plc Annual Report 2016
STRATEGIC REPORT |Operations review
In Asia Pacific, group NPR grew by 3% on
a constant currency basis (down 6% on a
reported basis). The beverage volume decline
of 1% was offset by group NPR per hl growth
of 4% reflecting a combination of price
increases supported by positive mix.
EBITA grew by 13% on a constant currency
basis (down 2% on a reported basis). EBITA
margin expanded by 200 bps on a constant
currency basis, reflecting topline growth and
continued cost optimisation across the
region. On a reported basis, the EBITA margin
expansion was reduced to 70 bps owing to
the relative weighting of the Australian
operation to the regional results and reflecting
the depreciation of the Australian dollar
against the US dollar during the year.
In Australia, group NPR growth of 4% on
a constant currency basis was driven by
NPR per hl growth of 3% with price increases
complemented by premiumisation as a result
of the shift into premium and contemporary
brands. Volumes were marginally up on the
prior year, with improved momentum in the
second half, up 3%. This performance
was underpinned by improved customer
relationships, excellent execution as well
as product innovation. As a result, we
outperformed our key competitors in a
market where the rate of decline has been
more muted.
Financial summary
Reported
2015
Net
acquisitions
and disposals
Currency
translation
Organic
growth
Reported
2016
Organic,
constant
currency
growth
%
Reported
growth
%
Group NPR (including share of associates) (US$m) 3,867 – (328) 111 3,650 3 (6)
EBITA1
(US$m) 768 – (116) 101 753 13 (2)
EBITA margin (%) 19.9 20.6
Sales volumes (hl 000)
Lager 71,181 – (926) 70,255 (1) (1)
Other alcoholic beverages 93 – (5) 88 (6) (6)
Total beverages 71,274 – (931) 70,343 (1) (1)
1
In 2016 before net exceptional credits of US$29 million being integration and restructuring credits (2015: net exceptional charges of US$452 million being US$139 million of integration and
restructuring costs and impairments of US$313 million).
The beverage volume decline of 1% was offset
by group NPR per hl growth of 4% reflecting
a combination of price increases supported by
positive mix.”
Ari Mervis
Managing Director,
SABMiller Asia Pacific
27SABMiller plc Annual Report 2016
STRATEGICREPORT
27SABMiller plc Annual Report 2016
During the year we focused on rebalancing
the portfolio, leveraging the consumer switch
from classic to contemporary and premium
segments. Premium lager segment volume
growth of 16% was led by strong momentum
in Great Northern in our contemporary
portfolio, together with the sustained double
digit growth of the Peroni and Yak brand
families. The successful relaunch of our
premium brand Pure Blonde in June 2015
supported our expansion of the category. Our
classic mainstream brands Victoria Bitter and
Carlton Draught continued to decline, in line
with segment trends, although this was
partially mitigated by the strong performance
of Carlton Dry.
EBITA growth and EBITA margin expansion,
on a constant currency basis, reflected the
topline performance coupled with our
continued cost control discipline. The focus
on cost optimisation throughout the year
included improving production and logistic
efficiencies as well as the streamlining of back
office processes.
In China, on a constant currency and
underlying, like-for-like basis1
compared
with the prior year, group NPR grew by 4%
and group NPR per hl grew by 6%, which
reflected the continued roll out of one-way
packaging and the continuing focus on
premiumisation. Growth in group NPR
and group NPR per hl was 1% and 3%,
respectively, on a constant currency basis.
Volumes were down 2% primarily due
to tough industry and macroeconomic
headwinds, in a market that declined by mid
single digits for the second consecutive year.
In the full year, we recognised our share
of a nine month reclassification undertaken
by our associate, CR Snow, of certain
discounts from selling expenses to group
NPR in its results for the 12 months ended
31 December 2015, without a prior period
adjustment. The reclassification was within
the income statement and had no impact
on profits.
1
Excluding the reclassification undertaken by our associate
referred to above.
Building the world’s biggest beer
Just over two decades ago, Snow was a small
local brand in northern China; today it is the
world’s biggest selling beer. In building CR
Snow, our partnership of 22 years with China
Resources Beer (Holdings) Co Ltd, the joint
venture followed a clear, long-term strategy.
It initially focused on creating regional
strongholds, acquiring brewers and brands
in high growth areas. It then moved to
establishing Snow as a national mainstream
brand, becoming number one by sales volume
in China in 2005 and globally in 2008. On then
turning its ambitions to premium sales, its
extremely successful Snow premium variants
such as Snow Golden Draft and Snow Brave
The World have delivered strong growth and
now account for 23% of Snow’s total volumes.
Australia embraces the Great Northern taste
Our Australian brand Great Northern has built on its outstanding regional performance with
a successful national launch. Great Northern became the fourth biggest lager in Queensland
within five years of its 2010 state debut, taking significant share from the market leader. We have
successfully identified Great Northern with an authentic outdoor lifestyle that is ‘off the map, off
road and off shore’. Having developed the brand’s strong regional base and identity, in February
2015 we started the national rollout of Great Northern Super Crisp, a lower alcohol variant.
This year volumes of the Great Northern brand grew by 121%.
28 SABMiller plc Annual Report 2016
STRATEGIC REPORT |Operations review |Asia Pacific
CR Snow maintained national leadership
as a result of being well represented in
the growth segments of the on-premise
channel, with good penetration of night
outlets in targeted cities through a full
portfolio of premium brands, particularly
Snow Brave the World and Snow Draft.
CR Snow also grew strongly in the
off-premise channel with notable growth
in cans. Snow Brave the World, which was
launched in 2008, continued to grow by
double digits and now represents over
20% of CR Snow’s total volume, and over
27% of NPR. EBITA growth and margin
expansion were achieved through focused
management of sales costs together
with reduced overheads in the face of
the industry downturn.
In India, group NPR grew by 7% on a
constant currency basis driven by group
NPR per hl growth of 6% due to price
increases across several states along with
strong growth in the premium segment.
Commercial initiatives, including the
repositioning of core mainstream brands
and Foster’s, supported volume growth of
1%. Profitability improved with growth in the
topline supported by tight cost control and
improved efficiencies.
Reducing water risk
Managing water scarcity is a key priority across the region,
particularly in India where demand exceeds supply and
quality is declining. The root of the problem is in agricultural
water use, so, with partners, we have worked with more
than 18,000 farmers beyond our value chain to reduce water
use while increasing productivity and income. We aim to
demonstrate best farming and water management practices
that can be replicated and scaled by others, including
government, to make a meaningful impact on India’s water
scarcity challenge.
Read more about how we are tackling water risk in India at
www.sabmiller.com/indiawater
In India, more than 90% of our sales are in returnable glass
bottles. We previously used industry-standard bottles that
were shared with other brewers and returned through a highly
informal system. We have now introduced patented bottles
that we have the sole right to use. These are designed to use
fewer, lighter materials and to last longer, so have enabled us
to increase re-use rates by 10%, reduce carbon emissions,
and create new incomes for bottle collectors, many of whom
are women. At the same time, this has helped to save costs
and promote our brands.
Millions of consumers enjoy our beers, but a minority drink
irresponsibly, posing risks to themselves and others. In
Australia, we support DrinkWise, which aims to encourage
a healthy and safe drinking culture. In the year its ground-
breaking How to Drink Properly campaign, aimed at 18 to 24
year-olds, reached more than seven million people.
Find out more at www.howtodrinkproperly.com
Read more about regional and country sustainability
priorities and performance at www.sabmiller.com/sam
Lazy Yak wakes up the market
We have gained a larger slice of Australia’s expanding craft beer
segment with the successful launch of Lazy Yak, an easy drinking
variant of our primary Australian craft brand, Fat Yak. The July 2015
introduction of Lazy Yak reflects our strategy to drive innovation within
Australia’s craft beer segment. In its first six months, Lazy Yak exceeded
all expectations to become our most successful craft launch in Australia.
Its gains did not affect the performance of Fat Yak, which continued to
grow throughout the year in both the on- and off-premise channels, with
volumes up 21%.
STRATEGICREPORT
29SABMiller plc Annual Report 2016
EUROPE
Many of our markets
in Europe now produce
non-alcoholic beers
to offer consumers
an alternative to
alcoholic beer for
different occasions.
11
non-alcoholic
beer brands
+2%
Soft drinks
volume
15.8m hl
+2%
1
Group NPR
US$3,832m
Drive superior topline growth through our brands:
Subsidiary NPR and volumes both grew by 1% on an organic,
constant currency basis; and
Continued focus on expanding the beer category,
with innovations in brand variants driving growth in Birell, our
non-alcoholic lager in the Czech Republic.
Lager
volumes
43.1m hl
-1%
+5%
1
EBITA
US$636m
Significant business with
production operations
Associates
Selling operations and
major export markets
30 SABMiller plc Annual Report 2016
1
Organic, constant currency basis.
0%abv
Where we operate
30 SABMiller plc Annual Report 2016
STRATEGIC REPORT |Operations review
In Europe, group NPR grew by 2% on an
organic, constant currency basis (down by
13% on a reported basis). On both a reported
and an organic basis, beverage volumes were
in line with the prior year with a 1% decline in
lager volumes offset by growth of 2% in soft
drinks volumes.
Subsidiary NPR and volumes were both up
by 1% on an organic, constant currency
basis. Following a challenging first half
reflecting significant competitor activity in
Poland, subsidiary topline momentum
improved during the year with NPR and
volume up 6% in the second half, with volume
growth across all of our operations.
At a regional level, the improved volume
performance of our subsidiaries was held
back by the relatively weaker performance
in our associate, Anadolu Efes.
Reported EBITA declined by 9%, with
EBITA margin up 70 bps. On a constant
currency basis, EBITA was up by 5% and
EBITA margin increased by 60 bps. Our
subsidiaries increased EBITA by 6% on an
organic, constant currency basis, with the
topline performance supported by cost
reductions and efficiencies. Associates’ EBITA
was down by 3% on an organic, constant
currency basis driven by Anadolu Efes.
Financial summary
Reported
2015
Net
acquisitions
and disposals
Currency
translation
Organic
growth
Reported
2016
Organic,
constant
currency
growth
%
Reported
growth
%
Group NPR (including share of associates) (US$m) 4,398 17 (656) 73 3,832 2 (13)
EBITA1
(US$m) 700 4 (105) 37 636 5 (9)
EBITA margin (%) 15.9 16.6
Sales volumes (hl 000)
Lager 43,595 78 (526) 43,147 (1) (1)
Soft drinks 15,493 – 283 15,776 2 2
Total beverages 59,088 78 (243) 58,923 – –
1
In 2015 before an exceptional charge of US$63million being the group’s share of Anadolu Efes’ impairment charge relating to its beer businesses in Russia and Ukraine.
Sue Clark
Managing Director,
SABMiller Europe
Following a challenging first half reflecting
significant competitor activity in Poland,
subsidiary topline momentum improved
during the year with NPR and volume up
6% in the second half, with volume growth
across all of our operations.”
31SABMiller plc Annual Report 2016
STRATEGICREPORT
31SABMiller plc Annual Report 2016
Keepers of the craft
We have strengthened Pilsner Urquell’s
premium brand positioning by underpinning
its proud heritage with innovation. As demand
for craft beer grows, we have reinforced the
173-year-old brand’s status as the original
and authentic pilsner, brewed by Czech brew
masters in the time-honoured way with the
same recipe and quality ingredients. We
have also enhanced the way in which we
ship and serve the brand to ensure its unique
taste is preserved. Fresh, unpasteurised
Pilsner Urquell is now available in over 300
on-premise ‘Tankovnas’, with three-quarters
in the Czech Republic and the rest across
eight other European markets.
In the Czech Republic and Slovakia, group
NPR grew by 3% on a constant currency
basis with beverage volumes up by 1%.
The business grew through a continued
focus on sales execution and supported by
favourable weather throughout the year.
Growth in Pilsner Urquell offset the decline
of our mainstream brand Gambrinus 10. We
continued to focus on expanding the beer
category, with innovations in brand variants
driving growth in Birell, our non-alcoholic lager
which penetrates soft drinks occasions. In the
Czech Republic, our volume share of the beer
market increased by 10 bps. In Slovakia, we
lost 120 bps of share on the same basis.
In Poland, group NPR declined by 9% on
a constant currency basis. The beverage
volume decline of 5% reflected significant
competitor activity in the first half of the year.
Initiatives launched in the second quarter to
restore our competitive position, particularly
that of our lower mainstream brand Zubr, and
a strengthened sales model, supported lager
volume growth of 6% in the second half of the
year. Our volume share of the beer market
declined by 150 bps, although we achieved
sequential improvements in market share
during the second half. EBITA and EBITA
margin decreased significantly on a constant
currency basis, driven by the decline in the
topline which was only partially mitigated
by overhead cost reductions and the
optimisation of our distribution network.
In the United Kingdom, group NPR grew
by 5% on an organic, constant currency
basis. Beverage volumes were up by 3% on
an organic basis with favourable brand mix
resulting from the continued growth of Peroni
Nastro Azzurro which offset the planned
volume decline in both Miller Genuine Draft
and the Polish brand portfolio. In June, we
acquired the modern craft brewer Meantime
Brewing Company Ltd which delivered
double digit volume growth.
In Italy, group NPR was up by 7% on a
constant currency basis with lager volume
growth of 5%, driven by the Peroni and
Nastro Azzurro brands, and supported by
good weather relative to the prior year. Group
NPR per hl expansion benefited from price
increases in both the off- and on-premise
channels in what remains a relatively low
inflationary environment, coupled with
focused management of discounts.
In Romania, group NPR grew by 10% on
a constant currency basis driven by lager
volume growth of 7%, which outperformed
the beer market. We achieved growth
across all price segments as a result of our
enhanced revenue management capabilities
and supported by an exceptionally hot
summer and good weather in the second half
of the year. Volume growth was boosted by
growth in our economy brand Ciucas, due
to increased promotional activity and the
success of a new convenience pack size
driving favourable pack mix.
From the village to the world
We have transformed Kozel from a small
domestic brand to a major international
player. When we bought the Kozel brewery
in 1999, volumes were low and the brand
had no export market or presence in
the on-premise channel. We carefully
positioned Kozel as the epitome of village
values and traditional craftsmanship,
offering great taste at a fair price. We
then developed a quality on-premise
experience, built strong digital consumer
engagement, launched premium variant
Kozel 11 in the Czech Republic, and
successfully built Kozel Dark internationally.
Kozel is now sold in more than 40 countries
and – by volume – is the best-selling
Czech lager outside its home market,
and the largest mainstream brand
in the Czech Republic.
32 SABMiller plc Annual Report 2016
STRATEGIC REPORT |Operations review |Europe
Read more about Birell at www.sabmiller.com/birell
In Europe we continue to focus on improving efficiency in our
breweries and value chains. Our regional water and energy
reduction taskforce, which shares best practice and mentors
efficiency champions, played a key role in making Europe our
first region to achieve an average water efficiency of 3.0 hl of
water per 1 hl of beer.
Read more at www.sabmiller.com/nowaternobeer
By engaging with consumers on shared concerns we strive
to deliver societal benefits while driving topline growth.
In Italy, where unemployment reached 44% among 18-24
year olds in 2015, Nastro Azzurro’s Ti Porta Lontano (Takes
You Further) programme helps connect young entrepreneurs
with mentors, creating a network of peers and business
people to share knowledge and advice.
Read more about how we are engaging with consumers
on sustainability on page 50.
Read more about regional and country sustainability
priorities and performance at www.sabmiller.com/sam
Growing the non-alcoholic beer alternative
Many of our European markets now produce non-alcoholic
beer to offer consumers an alternative to alcoholic beer
for different occasions. In the Czech Republic, our Birell
brand has defined the category, and sales have more than
quadrupled between 2001 and 2015. The brewing process
is identical to that for lager, but with a yeast which does
not produce alcohol, which means that the taste appeals
to beer lovers. Birell has twice been judged the best
non-alcoholic beer in the Czech Beer Awards. We have
extended the Birell range with real fruit juice mixes, further
broadening the brand’s appeal.
In the Netherlands, group NPR increased
by 3% on a constant currency basis with
lager volume growth of 5%. Our performance
reflected improved execution in the off-
premise channel and was further boosted
by the success of Grolsch brand innovations
and extensions.
In Hungary, group NPR increased by 11%
on a constant currency basis with lager
volume growth of 6% and selective pricing
on premium and economy brands.
Our associate, Anadolu Efes, continued
to be affected by economic and political
instability in its key lager markets. Total
beverage volumes decreased by 3%, with
the volume decline in lager partly offset by
growth in soft drinks volumes. The lager
volume weakness was mainly driven by
continuing challenges in Ukraine, Russia,
and Turkey. Group NPR per hl improved as
a result of price increases and favourable mix.
EBITA was down by 9% owing to currency
headwinds driving up raw material input costs
and despite a continuous focus on cost
optimisation and improved efficiencies.
Delivering style and
substance
In the UK, we are making Peroni
Nastro Azzurro even more
desirable by inspiring consumers
to embrace Italian style. We
focus on delivering sustainable
long-term growth by building the
premium positioning of the brand,
which remains a genuine import
from Italy, with the highest quality
ingredients, craftsmanship and
superior taste. By evolving Peroni
Nastro Azzurro in an innovative
way we continue to perform
ahead of the UK beer market,
adding value to the category and
our customers. We work with
established and rising Italian
creative talents through The
House of Peroni platform to
create compelling content which
brings customers and consumers
closer to the brand.
STRATEGICREPORT
33SABMiller plc Annual Report 2016
34
Where we
operate
Lager volumes
38.0m hl
-1%
0%
Group NPR
US$4,675m
Drive superior topline growth through our brands:
Miller Lite growth momentum improved in the second half reflecting the
continuing emphasis on the brand’s authenticity and originality;
In the above premium segment, the Redd’s brand family grew volumes by
high single digits for the year; and
Both the Blue Moon brand family and the Leinenkugel’s portfolio grew
volumes by low single digits for the year.
+1%EBITA
US$865m
Zero
landfill
SABMiller plc Annual Report 2016
This year, MillerCoors
achieved landfill-free
operations at all major
breweries. Since 2009,
MillerCoors has reduced its
waste across the organisation
by 89%.
Significant business with production operations
Selling operations and major export markets
34 SABMiller plc Annual Report 2016
STRATEGIC REPORT |Operations review
35
The North America segment includes
our 58% share of MillerCoors and 100% of
Miller Brewing International and our North
American holding companies. On a reported
basis, total North America EBITA was up by
1% and EBITA margin increased 20 bps.
EBITA growth and EBITA margin expansion
of 80 bps in MillerCoors was offset by
increased marketing and fixed cost
investment to support the expansion of
our international operations in Brazil and
Canada, following changes to our route
to market in both countries.
MillerCoors
MillerCoors’ group NPR declined by 1% on
an organic basis as growth in group NPR
per hl of 1%, driven by net pricing and
supported by favourable sales mix, was offset
by lower volumes, with domestic sales to
wholesalers (STWs) down by 2%. Domestic
sales to retailers (STRs) were also down by
2%. EBITA increased by 3% on an organic
basis as improved group NPR per hl and
lower input costs more than offset higher
marketing investment and cost inflation.
EBITA growth and EBITA margin expansion
of 80 bps in MillerCoors was offset by
increased marketing and fixed cost investment
to support the expansion of our international
operations in Brazil and Canada.”
Financial summary
Reported
2015
Net
acquisitions
and disposals
Currency
translation
Organic
growth
Reported
2016
Organic,
constant
currency
growth
%
Reported
growth
%
Group NPR (including share of joint ventures) (US$m) 4,682 1 (1) (7) 4,675 – –
EBITA1
(US$m) 858 – 1 6 865 1 1
EBITA margin (%) 18.3 18.5
Sales volumes (hl 000)
Lager – excluding contract brewing 38,508 6 (554) 37,960 (1) (1)
Soft drinks 40 – (1) 39 (3) (3)
Total beverages 38,548 6 (555) 37,999 (1) (1)
MillerCoors’ volumes
Lager – excluding contract brewing 37,154 6 (781) 36,379 (2) (2)
Sales to retailers (STRs) 36,967 n/a n/a 36,217 n/a (2)
¹ In 2016 before exceptional charges of US$68 million, being the group’s share of MillerCoors’ restructuring costs.
Gavin Hattersley
Chief Executive Officer,
MillerCoors
SABMiller plc Annual Report 2016
STRATEGICREPORT
35SABMiller plc Annual Report 2016
Premium light STRs declined by low single
digits, although MillerCoors has gained share
of the segment for the last four consecutive
quarters. Miller Lite growth momentum
improved in the second half, to end the
full year in line with the prior year. This
performance reflected the continuing
emphasis on the brand’s authenticity and
originality, further evidenced through the
success of the limited edition release of the
Steinie bottle. Coors Light declined by low
single digits for the year, with improved
performance in the fourth quarter supported
by a new marketing campaign.
STRs in the above premium segment were
only marginally up, as the successful launch
of Henry’s Hard Soda in the fourth quarter
largely offset the double digit decline of Miller
Fortune, which has been deprioritised. The
Redd’s brand family increased by high single
digits although volumes declined by low
single digits in the fourth quarter as the brand
family is now cycling strong comparatives.
Both the Blue Moon brand family and the
Leinenkugel’s portfolio were up low single
digits for the year.
The below premium portfolio declined by
mid single digits with both Keystone Light and
Milwaukee’s Best down high single digits
and Miller High Life down by mid single digits.
This was partially offset by Steel Reserve
which grew by low single digits owing to the
continuing success of the Alloy Series, the
brand’s line of flavoured malt beverages.
Putting the fizz into FMBs
The impressive national launch of Henry’s
Hard Sodas has re-inforced MillerCoors’
lead in the fastest growing segment in the
US beer market – flavoured malt beverages
(FMBs). At the year-end, just three months
after their introduction, Henry’s Hard Sodas’
two launch flavours, Hard Ginger Ale and
Hard Orange Soda, already represented
more than 7% of the FMB market in the
USA. Steel Reserve Alloy Series, the
successful economy FMB brand, grew
volume sales by 60% during the year.
Redd’s also continued to grow strongly,
led by Redd’s Green Apple and the higher
alcohol Redd’s Wicked range.
Leinenkugel’s shandies continue to sparkle
Nine out of 10 US shandy-style beers sold are from MillerCoors’ Leinenkugel’s brand. ‘Leinie’
shandies continued to perform strongly in the USA in the year, with volumes growing by 16%.
The advance was led by the brand’s seasonal Summer Shandy, which was the summer’s
fastest-selling national craft brand. New Leinenkugel variants also had a significant impact,
particularly the autumn launch Harvest Patch Shandy which was the year’s second-fastest
selling seasonal craft brand in the USA. Grapefruit Shandy, which was the previous year’s most
successful craft launch, continued to sell so well it will now be available all year round.
36 SABMiller plc Annual Report 2016
STRATEGIC REPORT |Operations review |North America
Reducing waste
In the year MillerCoors achieved landfill-free operations
at all major breweries. Since 2009 MillerCoors has reduced
its waste across the organisation by 89%, equal to keeping
more than 4,000 tonnes of waste out of local landfills.
During the year MillerCoors also launched the largest solar
array installed at any US brewery. This generates enough
energy to brew approximately 600,000 hl of beer annually.
The lower cost of commodities and
production process efficiencies resulted in a
low single digit decrease in input costs per hl.
The business invested in additional marketing
activities, particularly media, to support the
growth of key brands and the launch of
Henry’s Hard Soda.
In September 2015, MillerCoors announced
plans to close the brewery in Eden, North
Carolina with an effective closure date of
September 2016. Restructuring costs,
including accelerated depreciation and
severance costs, will continue to be
recognised as exceptional.
MillerCoors defines sustainability as making a positive
and meaningful impact on the social, environmental, and
economic issues that affect its business, employees and
other stakeholders. MillerCoors has a 2020 goal to encourage
20 million consumers to make a pledge against drink driving,
and is actively encouraging people to take a safe ride home.
This includes a national partnership with the taxi app Uber,
which has provided almost 23,000 rides to purchasers of
MillerCoors’ beers.
Read more at www.greatbeergreatresponsibility.com
MillerCoors celebrates the diversity of its workforce and
remains dedicated to fostering a diverse and inclusive
workplace. One of MillerCoors’ 2020 goals is for women
to comprise 35% of management. In 2015, 99% of
MillerCoors’ leadership completed unconscious bias
training, a bespoke programme developed and provided
by the MillerCoors University – the educational arm
of the company.
Read more about regional and country sustainability
priorities and performance at www.sabmiller.com/sam
The authentic Miller Lite
Miller Lite stays true to itself – just like those who drink it. This
message of authenticity is core to the 40-year-old brand’s new US
advertising campaign, which centres on a ‘bodega’ or corner shop
and its distinctive Miller Lite customers. Authenticity was also central
to MillerCoors’ successful turnaround of the brand, the original US
light beer, after seven years of declining sales. MillerCoors introduced
a new Miller Lite visual identity inspired by its original packaging, put
product quality at the core of communication, and made each
consumer touchpoint, from packaging to sponsored concerts,
a means of engagement.
STRATEGICREPORT
37SABMiller plc Annual Report 2016
Finance review
Domenic De Lorenzo
Chief Financial Officer
Financial highlights
– The depreciation of key currencies against the US dollar had a
significant negative impact on the translation of reported results
– Group net producer revenue (NPR) declined 8% to US$24,149
million but increased by 5% on an organic, constant currency
basis; revenue down 10% to US$19,833 million
– Total volumes of 331 million hl grew by 2%, with subsidiaries
volumes up 5%
– EBITA of US$5,810 million, a decrease of 9% on the prior year,
up 8% on an organic, constant currency basis
– EBITA margin contracted marginally (down 10 bps) on the prior
year, up 60 bps on an organic, constant currency basis
– Exceptional charges amounted to US$721 million, principally
relating to the impairment of our investments in Angola and South
Sudan, together with costs associated with the AB InBev
transaction.
– Adjusted profit before tax of US$5,295 million, a decrease of 6%;
profit before tax of US$4,074 million, down 16% on the prior year
due to the adverse currency translational effect and higher
exceptional charges
– Adjusted EPS of 224.1 US cents, a 6% decrease; adjusted EPS
in constant currency grew by 12%; basic EPS of 167.8 US cents,
down 18%
– Total dividend for the year of 122 US cents per share, up 8%
– Free cash flow of US$2,969 million was US$264 million lower than
the prior year, mainly due to currency translation
– Net debt of US$9,638 million, a decrease of US$827 million from
the prior year; gearing down 300 bps to 40.0% and net debt to
adjusted EBITDA ratio in line with the prior year at 1.6x
The group’s financial goal is to deliver a higher return to our
shareholders than our peer group, with an aspiration to be in the top
quartile. We measure our performance against this goal by assessing
total shareholder return (TSR), through growth in adjusted EPS, on
both reported and constant currency bases, and free cash flow.
In the five years to 31 March 2016 we achieved a TSR of 115%,
compared with the median of the comparator group of 102%, as
measured in accordance with the terms of our value share awards.
The differential between the two of 13 percentage points is our TSR
key performance indicator as shown on page 15.
We disclose certain results on an organic, constant currency basis
to exclude the effects on our results of changes in exchange rates
on the translation of results into US dollars and of acquisitions net
Net debt of US$9,638 million,
a decrease of US$827 million
from the prior year; gearing down
300 bps to 40.0% and net debt
to adjusted EBITDA ratio in line
with the prior year at 1.6x.”
We achieved adjusted EPS growth in the year of 12% on a constant
currency basis, as a result of increased group NPR, efficiency savings
and lower finance costs. However, after reflecting the adverse
translational impact of foreign exchange rate movements, reported
adjusted EPS declined by 6%.”
38 SABMiller plc Annual Report 2016
STRATEGIC REPORT
of disposals. We consider that using this basis provides a better
relative measure of the underlying operating performance and trends,
and allows for greater comparability between operations, particularly
in times of significant volatility in foreign currency exchange rates as
experienced in the year.
We achieved adjusted EPS growth in the year of 12% on a constant
currency basis, as a result of increased group NPR, efficiency savings
and lower finance costs. However, after reflecting the adverse
translational impact of foreign exchange rate movements, reported
adjusted EPS declined by 6%. Adjusted EPS on a constant currency
basis and excluding the prior year net earnings impact of the disposal
of our investment in Tsogo Sun Holdings Ltd (Tsogo Sun) was also up
12% on the prior year. Free cash flow at US$2,969 million was robust
but was US$264 million lower than the prior year, mainly as a result of
the adverse currency translation impact.
Accounting policies
The principal accounting policies used by the group are shown
as note 1 to the consolidated financial statements. The accounting
policies followed are the same as those used in the prior year except
for the new IFRS interpretations and amendments adopted by the
group since 1 April 2015, which have had no material impact on the
consolidated results of operations or financial position of the group,
as detailed in note 1 to the consolidated financial statements.
In addition, note 1 to the consolidated financial statements details
the areas where a high degree of judgement has been applied in
the selection of a policy, an assumption or estimates used. We have
reconsidered the judgements and estimates applied, in particular
the determination of exceptional items and share-based compensation,
where we have not assumed the completion of the AB InBev
transaction. We have included an additional area of judgement
with regard to share-based compensation, particularly in relation
to judgements made about the extent and timing of the vesting of
awards. These areas of judgement are aligned with those considered
by the audit committee and which are reported within the audit
committee report on pages 70 to 73.
Key performance indicators (KPIs)
We use a range of KPIs to monitor progress against our strategy
and our financial goal, as noted on page 15. Our KPIs and other
performance indicators include non-GAAP performance measures
to assess underlying performance. These incorporate constant
exchange rates for measuring revenue and profit growth; organic
measures to exclude acquisition and divestment effects; adjusted
profit measures to exclude exceptional items and amortisation of
certain intangible assets; and adjusted EBITDA as a key cash flow
measure. Detailed definitions of these terms can be found on pages
192 and 193, and for certain items reconciliations to the nearest
equivalent GAAP measure are provided below or in the notes to the
consolidated financial statements.
Net producer revenue (NPR)
Group net producer revenue (NPR) was US$24,149 million (including
our share of associates’ and joint ventures’ NPR of US$9,254 million),
a decrease of 8%, as a result of the adverse impact of foreign
currency movements. However, on an organic, constant currency
basis, group NPR increased by 5% driven by the performance of our
subsidiaries with NPR growth of 8%, particularly in our developing
market operations in Latin America and Africa, with a more muted
performance in our associates and joint ventures. Group NPR on an
organic, constant currency basis grew in all regions except for North
America, which was marginally down.
Group net producer revenue US$m
Components of performance
2016
(reported)
Acquisitions2016
(organic)
CurrencyPrice/
mix
Volume20151
24,087 0.2% 24,149
(13.5)%3.4%
2.1%
26,176
1
Adjusted for disposals.
As shown in the chart above, volume growth contributed a 2%
improvement on the prior year group NPR. Price/mix gains added
a further 3% improvement with all divisions delivering gains, through
a combination of favourable brand mix, selective price increases and
improved price realisation. However, currency movements during
the year reduced reported group NPR by 13%, as a result of the
weakening of all our key currencies against the US dollar. The impact
of acquisitions was negligible on the prior year base as adjusted for
disposals, which principally related to the disposal of our investment
in Tsogo Sun.
Group revenue, which includes excise and our share of our associates’
and joint ventures’ revenue on the same basis, declined broadly in line
with group NPR (down 9%), while statutory revenue, which relates
only to the revenue of our subsidiaries, decreased by 10%, with the
declines driven by the adverse currency translation effect. Both
increased on an organic, constant currency basis.
Group NPR per hl decreased by 10% on a reported basis and
increased by 3% on an organic, constant currency basis, with the
primary reason for the difference being the impact of the depreciation
of our key currencies. On an organic, constant currency basis all
divisions recorded group NPR per hl growth as a result of favourable
brand mix, selective price increases and improved price realisation.
Volumes
Good volume performance was delivered particularly from our
developing market operations in Latin America and Africa, with growth
of 5% and 6% respectively on both reported and organic bases.
Volumes in Asia Pacific and North America were down 1% as a result
of tough industry and macro-economic headwinds in China and the
USA, while in Europe volumes were in line with the prior year. Total
volumes grew by 2% compared with the prior year on both organic
and reported bases. Lager volumes increased by 1% and soft drinks
volumes grew by 6% compared with the prior year, with similar rates
of growth on both organic and reported bases. On a subsidiaries
only basis, excluding our share of our associates’ and joint ventures’
volumes, total volumes grew by 5%. Total volumes in our associates
and joint ventures decreased by 2% with Anadolu Efes, Castel and
MillerCoors experiencing volume declines.
STRATEGICREPORT
39SABMiller plc Annual Report 2016
Reported Organic
2016
hl m
2015
hl m
%
change
%
change
Total volumes 331 324 2 2
Lager volumes 249 246 1 1
Soft drinks volumes 74 70 6 6
Subsidiaries’ volumes 197 188 5 5
Associates’ and joint ventures’
volumes
134 136 (2) (2)
The following chart shows organic growth in total beverage volumes
for each of the last five years.
Total beverages: organic volume growth %
20162015201420132012
2.1
1.41.6
3.5
3.7
Input costs
Costs of goods sold (including our share of MillerCoors’ costs of
goods sold) increased by approximately 2% on a constant currency
per hl basis. Raw material input costs increased by 1%. This reflected
the impact of transactional foreign exchange from the depreciation
of local currencies in Africa and Latin America, higher prices for
adjuncts and sugar, as well as adverse mix effects. These were
partially offset by benefits from our global procurement organisation
through commercial negotiations, alternative sourcing, and cross-
functional initiatives from our cost and efficiency programme, including
projects such as container light weighting and expanding the use of
recycled PET. Distribution costs remained below prior year levels due
to lower crude oil prices and further cost and efficiency benefits from
optimisation initiatives across our distribution network.
We expect raw material input costs to increase by mid single
digits on a constant currency per hl basis in the forthcoming financial
year. This will be driven principally by increased commodity costs,
as well as inflation-driven increases in packaging materials and
adverse foreign exchange impacts on imported goods. These will be
moderated by our forward cover positions and continuing efficiency
benefits from value engineering initiatives and contract negotiations.
EBITA
We report EBITA (earnings before interest, tax, amortisation (excluding
computer software) and exceptional items) as this is the key profit
metric by which the group is managed and operating performance
is evaluated internally. Segmental performance is reported after the
apportionment of attributable head office service costs.
We achieved EBITA growth of 8% on an organic, constant currency
basis, with all divisions delivering growth. Reported EBITA (including
the impact of acquisitions and disposals) declined by 9% compared
with the prior year, to US$5,810 million. The depreciation against the
US dollar of the key currencies in which we operate, and to a much
lesser extent the disposal of our Tsogo Sun investment in the prior
year, adversely impacted reported EBITA. The chart below shows
the increase in EBITA for each of the last five years with each year’s
growth shown in constant currency after excluding the impact of
acquisitions and disposals.
EBITA growth %
Organic, constant currency basis
The table below demonstrates our improving leverage through the
income statement, with 2% volume growth, leading to 12% constant
currency growth in adjusted EPS, through 5% growth in group NPR
and EBITA growth of 8%, both on an organic, constant currency basis.
Change compared with the prior year %
1
On a constant currency basis.
20162015201420132012
8
6
7
9
8
Adjusted EPSEBITAGroup NPRVolumes
2 2
(8)
5
(9)
8
(6)
121 Reported
Organic, constant
currency
40 SABMiller plc Annual Report 2016
STRATEGIC REPORT |Finance review continued
EBITA margin
EBITA margin at 24.1% was marginally down on the prior year. The
chart below shows EBITA margin by division, with Asia Pacific, Europe
and North America making particular progress with growth of 70, 70
and 20 bps respectively. However, the margins in Latin America and
Africa declined by 100 and 40 bps respectively as the margins in these
divisions were particularly impacted by the depreciation of our key
currencies against the US dollar.
Reported EBITA margin performance %
GroupSouth
Africa:
Hotels and
Gaming
Retained
operations
North
America
EuropeAsia
Pacific
AfricaLatin
America
38.6
+10-20 +200 +60 +20 +60 – +60
37.6
25.6 25.2
19.9 20.6
15.9 16.6
18.3 18.5
24.2 24.1
28.7
–
24.2 24.1
EBITA margin expansion1
bps
2015
2016
1
Organic, constant currency basis.
On an organic, constant currency basis, EBITA margin improved by
60 bps, with improvements in all divisions except Latin America, which
was down 20 bps compared with the prior year, as cost productivity
and improved efficiencies in manufacturing and distribution only partly
compensated for the currency pressure on imported raw materials.
All divisions delivered organic, constant currency margin progression
in excess of that on a reported basis, except for Europe, which was
as a result of the Meantime acquisition.
EBITDA
EBITDA, which comprises EBITA plus depreciation and amortisation
of computer software, including our share of associates’ and joint
ventures’ depreciation and amortisation of computer software,
amounted to US$7,097 million for the year, a 9% decrease on the prior
year due to currency translation effects. Associates and joint ventures
contributed 28% of our EBITDA.
Exceptional items
Items that are material either by size or nature are classified as
exceptional items. Further details of these items can be found
in note 4 to the consolidated financial statements.
Net exceptional charges of US$721 million before tax were reported
during the year (2015: US$153 million) including US$556 million (2015:
US$75 million) within operating costs, US$64 million (2015: US$15
million) within finance costs and US$101 million (2015: US$63 million)
related to our share of associates’ and joint ventures’ exceptional
charges. The net exceptional charges included:
– US$572 million of charges including impairments and related
charges in Angola and South Sudan in Africa. These costs,
including US$64 million within finance costs relating to foreign
exchange losses and loan guarantees, all result from the decisions
to scale back operations in both countries following the significant
devaluations of the local currencies in Angola and South Sudan
against the US dollar in the year and the lack of availability of
hard currency;
– US$160 million of costs associated with the AB InBev transaction,
including staff-related retention arrangements and advisers’ fees;
– US$36 million of charges related to the cost and efficiency
programme;
– US$29 million of credits related to integration and restructuring
in Australia;
– US$68 million share of MillerCoors’ restructuring costs relating
to the Eden brewery closure; and
– US$86 million share of the gain on the reclassification of Castel’s
Tunisian operations from associate to subsidiary following the
acquisition by Castel of additional shares.
Finance costs
Net finance costs were US$506 million, a 21% decrease on the prior
year’s US$637 million primarily as a result of the reduction in net debt
at the end of the prior financial year and during the year, partially offset
by foreign exchange losses. Net finance costs in the year included net
exceptional costs of US$64 million in Angola and South Sudan which
have been excluded from adjusted finance costs and adjusted EPS.
Adjusted net finance costs are reconciled to net finance costs in the
table below. They were 29% lower than the prior year. Interest cover,
on an adjusted basis, increased to 13.8 times from 10.7 times in the
prior year.
2016
US$m
2015
US$m
Net finance costs 506 637
Net exceptional finance costs (64) (15)
Adjusted finance costs 442 622
We expect finance costs in the 2017 financial year to be broadly similar
to those in 2016.
STRATEGICREPORT
41SABMiller plc Annual Report 2016
Tax
The effective rate of tax for the year (before amortisation of intangible
assets other than computer software, and exceptional items) was
26.3%, a marginal increase on the prior year.
In the medium term we continue with our expectation that the effective
tax rate will be between 27% and 29%. This is a level which we believe
is sustainable based upon the current structure of the group and
anticipated changes in the global tax environment.
The effective rate of tax is calculated as the ratio of adjusted tax
expense to adjusted profit before tax as shown below.
2016
US$m
2015
US$m
Taxation expense 1,152 1,273
Tax on amortisation 96 117
Tax on exceptional items 28 (83)
Share of associates’ and joint ventures’ taxation 114 157
Adjusted tax expense 1,390 1,464
Profit before tax 4,074 4,830
Exceptional items (excluding finance costs
exceptional items)
657 138
Exceptional finance costs 64 15
Amortisation 350 423
Share of associates’ and joint ventures’ tax and
non-controlling interests
150 236
Adjusted profit before tax 5,295 5,642
Effective tax rate 26.3% 26.0%
The reported corporate tax expense for the year was US$1,152 million,
a decrease of 10% compared with US$1,273 million in the prior year,
primarily as a result of the depreciation of our key operating currencies
against the US dollar.
Corporate income taxes paid can differ from the annual tax charge as
a result of the payment of a tax liability falling outside the financial year,
and because of deferred tax accounting treatment. Uncertainty of
interpretation and application of tax law in some jurisdictions also
contributes to differences between the amounts paid and those
charged to the income statement. The amount of tax paid in the year
decreased to US$1,315 million from US$1,439 million in the prior year.
The decrease was largely as a result of the depreciation of our key
operating currencies against the US dollar.
We are publishing an updated version of Our Approach to Tax report
for 2016 which provides details of how we manage our taxes. This
reflects our commitment to ensuring our reporting reflects best
practice and regulatory developments.
Read more about how we manage our taxes in Our Approach
to Tax report
Tax revenues play a key role in funding local public services and
supporting vibrant communities in which we operate. We pay a
significant amount of tax and in many countries we are one of the
largest contributors to government income. Through our business
activities, our tax contributions across the world help the development
of the many economies in which we operate.
In all our tax affairs, we continue to work proactively with the local tax
authorities to ensure that we comply with legislation and pay the right
amount of tax. Within this framework, we aim to adopt a balanced and
commercial position, making decisions as transparently as possible.
We recognise that tax policy and management are a significant part
of running a sustainable and responsible business.
Total taxes borne and collected by the group, including excise and
indirect taxes, and including those related to our MillerCoors joint
venture in the USA, amounted to US$9,507 million (2015: US$10,639
million) in the year, with the reduction due to the effects of currency
translation. The composition and divisional analysis respectively
are shown in the following charts.
Tax borne and collected by category
US$9,507m
Excise 58%
Other indirect taxes 20%
Taxes on profits 12%
Employment taxes 7%
Tax withheld at source 2%
Taxes on property 1%
Tax borne and collected by region
US$9,507m
Developing economies
(US$6,536m)
Latin America 35%
Africa 22%
Europe 7%
Asia Pacific 4%
Developed economies
(US$2,971m)
Asia Pacific 11%
Europe 11%
North America 10%
42 SABMiller plc Annual Report 2016
STRATEGIC REPORT |Finance review continued
Profit and earnings
Adjusted profit before tax declined by 6% compared with the prior
year to US$5,295 million, primarily as a result of the adverse impact
of currency depreciation more than offsetting higher volumes and
improved group NPR, cost efficiencies and lower finance costs. On
a statutory basis, profit before tax of US$4,074 million was 16% lower
than the prior year for the reasons given above together with an
increase in net exceptional charges. The table below reconciles EBITA
to adjusted profit before tax and to the statutory profit before tax.
2016
US$m
2015
US$m
%
change
EBITA 5,810 6,367 (9)
Adjusted finance costs (442) (622) 29
Share of associates’ and joint ventures’
finance costs
(73) (103) 29
Adjusted profit before tax 5,295 5,642 (6)
Exceptional items (657) (138) (377)
Exceptional finance costs (64) (15) (326)
Amortisation (350) (423) 17
Share of associates’ and joint ventures’
tax and non-controlling interests
(150) (236) 36
Profit before tax 4,074 4,830 (16)
Adjusted earnings decreased by 6% to US$3,604 million. With the
weighted average number of basic shares in issue for the year of 1,608
million, up slightly from the prior year’s 1,604 million, adjusted EPS
declined in our reporting currency of US dollars but increased in British
pounds and in South African rand as a result of the depreciation of the
currencies, as demonstrated in the table below.
2016 2015
%
change
US cents 224.1 239.1 (6)
UK pence 148.2 147.4 1
South African cents 3,088.8 2,649.7 17
On a constant currency basis, adjusted EPS improved by 12%
compared with the prior year, and by the same percentage excluding
the prior year net earnings impact of Tsogo Sun.
A reconciliation of the statutory measure of profit attributable
to equity shareholders with adjusted earnings is shown in note 8
to the consolidated financial statements. On a statutory basis, basic
earnings per share were 18% down on the prior year primarily as
a result of the adverse impact of the depreciation of our key currencies
against the dollar on the translation of our results, together with higher
exceptional charges.
Dividends
The board has proposed a final dividend of 93.75 US cents to make
a total of 122 US cents per share for the year – an increase of 8% over
the prior year. This represents dividend cover of 1.8 times based on
adjusted earnings per share (2015: 2.1 times). The full year and the final
dividend are permitted dividends within the terms of SABMiller and
AB InBev’s joint Rule 2.7 announcement on 11 November 2015. The
relationship between the growth in dividends per share and adjusted
earnings per share is demonstrated in the chart below.
Adjusted earnings per share (EPS) and dividend per share
US cents
50
100
150
200
250
20162015201420132012
Adjusted EPS
Dividend per share
Details of payment dates and related matters are disclosed in the
directors’ report.
Business combinations, disposals
and similar transactions
In June 2015 we acquired 100% of Meantime Brewing Co Ltd, a UK
modern craft brewer, as part of our strategy to drive superior topline
growth and to shape our global mix to drive a superior growth profile.
As noted in the Chief Executive’s review, the transaction with The
Coca-Cola Company and Coca-Cola Sabco to form Coca-Cola
Beverages Africa, which we announced in November 2014, received
approval, with agreed conditions, from the South Africa Competition
Tribunal on 10 May 2016. We expect the transaction to complete
in early July.
Our associate Castel increased its interests in its Tunisian operations
such that it obtained control of these operations. The accounting for
the transaction led to a non-cash gain, of which our share amounted
to US$86 million and which we have treated as an exceptional item.
STRATEGICREPORT
43SABMiller plc Annual Report 2016
Adjusted EBITDA
We use an adjusted EBITDA measure which comprises operating
profit before exceptional items, depreciation and amortisation, and
includes our share of MillerCoors’ EBITDA, in order to provide a useful
indication of cash generation. Adjusted EBITDA of US$6,114 million
was 8% lower than the prior year, primarily due to the adverse
currency translational impact. Adjusted EBITDA margin, including our
share of MillerCoors’ net producer revenue, contracted by 20 bps in
the year to 31.5%.
2016
US$m
2015
US$m
Subsidiaries’ EBITDA (see note 2) 5,105 5,690
Group’s share of MillerCoors’ EBITDA (see note 2) 1,009 987
Adjusted EBITDA 6,114 6,677
Net producer revenue (NPR) 14,895 16,534
Group’s share of MillerCoors’ NPR 4,504 4,543
19,399 21,077
Adjusted EBITDA margin 31.5% 31.7%
Cash flow and investment highlights
Net cash generated from operations before working capital
movements of US$5,055 million was 11% lower than the prior year,
primarily as a result of the depreciation of our key operating currencies
against the US dollar. This excludes cash contributions from joint
ventures but includes the effects of cash flows from exceptional items,
other than proceeds from the disposal of businesses and associates.
Cash flow from working capital was an inflow of US$61 million,
principally as a result of the revisions to supplier payment terms, partly
offset by an increase in receivables and inventories owing to growth
of the business. Cash generated from operations decreased by 12%
compared with the prior year, to US$5,116 million.
Tax paid in the year was down to US$1,315 million from US$1,439
million in the prior year. As described in the tax section, the decrease
arose mainly as a result of the translational impact of the depreciation
of our key currencies against the US dollar.
Net interest paid decreased compared with the prior year to US$386
million from US$651 million reflecting the reduction in gross debt at the
end of the prior financial year and during the year, together with the
early redemption payment in the prior year.
Capital expenditure on property, plant and equipment for the year
was US$1,210 million (2015: US$1,394 million), and US$1,313 million
(2015: US$1,572 million) including the purchase of intangible assets,
with the amount spent impacted by the translational impact of
currency depreciation against the US dollar. We have continued to
invest in brewing capacity and capability, principally in Africa and Latin
America, together with spend on the development of digital capability,
networks and communications. Capital expenditure in the next
financial year is expected to be similar to prior years.
Free cash flow was US$2,969 million, a decrease of US$264 million,
reflecting the translational impact of the depreciation of our key
currencies against the US dollar in the year. Free cash flow over the
last five years is shown in the chart below.
Free cash flow
US$m
20162015201420132012
2,969
3,233
2,563
3,230
3,048
Cost and efficiency programme
Our cost and efficiency programme, originally launched in May
2014, continues to drive additional operational efficiencies to
those delivered in the normal course of business, with the original
target having been replaced during the year with a new target
announced on 9 October 2015. The announcement is repeated
on the following page.
Savings arising from this programme in the year amounted to
US$326 million and cumulatively amount to US$547 million per
annum, and have exceeded the original target two years ahead of
schedule. Efficiencies and cost savings achieved in the year were
delivered through our end to end, integrated supply chain, in
manufacturing, distribution and procurement, the reach of the latter
covered 86% of spend under management for the year.
When the programme was originally announced in May 2014, upfront
restructuring costs of US$350 million were expected. US$36 million
of restructuring costs have been incurred in the year bringing the
cumulative costs to date to US$164 million. The announcement in
October 2015 of the revised target included an additional US$26
million of incremental non-recurring costs.
44 SABMiller plc Annual Report 2016
STRATEGIC REPORT |Finance review continued
“SABMiller announces that it has increased its target annual run rate
cost savings from its cost and efficiency programme, announced in
May 2014, from US$500 million by 31 March 2018 to at least
US$1,050 million by 31 March 2020.
“The cost and efficiency programme, which covers SABMiller’s
integrated supply chain comprising procurement, manufacturing
and distribution, delivered US$221 million of annualised savings in
its first year to 31 March 2015, and is expected to deliver in excess
of US$430 million of annualised savings in its second year to
31 March 2016. The original target issued in 2014 was
US$500 million annualised savings by 2018.
“The increase in annual run rate cost savings announced today,
of at least US$550 million, will further build on the initial success of
the 2014 programme and bring the aggregate annual run rate cost
savings for this programme to at least US$1,050 million by 2020.
This is across a total addressable cost base of approximately
US$10 billion.
“The additional savings will come from SABMiller’s integrated supply
chain, with approximately 70% of the additional savings announced
today coming from procurement and 30% from manufacturing and
distribution. The savings will mainly be realised by:
– increasing the spend centrally managed by SABMiller’s specialist
procurement team to at least 90%, from 46% in the year ended
31 March 2014 and 69% for the year ended 31 March 2015;
– completing the roll out of procurement operating models to
increase efficiency through greater transparency, cost
management, compliance and delivery of savings; and
– driving further efficiencies in manufacturing and distribution based
on best in class benchmarks and standardised processes.
“SABMiller expects to incur incremental non-recurring costs of
US$26 million in total by 2020 and no dis-benefits are expected
to arise from the programme.
“Bases of belief and sources of information
from the 9 October 2015 announcement:
“The cost and efficiency programme announced and launched in
2014 delivered cost savings of US$221 million by 31 March 2015
as disclosed in SABMiller’s Annual Report and Accounts by
reference to a total addressable cost base for the year ended
31 March 2014 of approximately US$10 billion.
“Total addressable cost base refers to all third party spend and
labour force and infrastructure costs in manufacturing and
distribution. The labour force costs in manufacturing include the
group’s share of relevant MillerCoors costs. The total addressable
cost base excludes capital expenditure and depreciation.
“The incremental cost savings estimates shown above are based
on savings compared to the group’s cost base for the year to
31 March 2015 which was not materially different from that for the
year to 31 March 2014.
“The estimated cost savings have been prepared based on
internal information on costs by function, type and country and
detailed analysis of the future operating model. The delivery of
historical cost reduction programmes has also been taken into
account in preparing these estimates. The estimates have been
prepared by functional and country teams, including senior
executives in the organisation. These programmes have been
developed over the past 6-12 months and have included input from
external consultants. In circumstances where data has been limited
for commercial or other reasons, estimates and assumptions
have been developed to support the analysis.
“In arriving at the Quantified Financial Benefits Statement, the
directors of SABMiller have assumed that:
– there will be no change in the ownership or control of SABMiller;
– there will be no material change to macroeconomic, political
or legal conditions in the markets or regions in which the
SABMiller group operates which will materially impact on the
implementation of or costs to achieve the proposed cost savings;
and
– there will be no material change in exchange rates or
commodity prices.”
Announcement regarding increase in target savings from the cost
and efficiency programme – 9 October 2015.
STRATEGICREPORT
45SABMiller plc Annual Report 2016
Total equity decreased from US$24,355 million at 31 March 2015 to
US$24,088 million at 31 March 2016. The decrease primarily reflected
adverse currency movements on the translation of local currency net
assets and dividend payments, partly offset by profit for the year and
share-based payment credits.
Financial structure and liquidity
Our strong financial structure gives us adequate resources to
facilitate our continuing business along with medium-term flexibility
to invest in appropriate growth opportunities and manage the
balance sheet.
We finance our operations through cash generated by the business
and a mixture of short and medium-term bank credit facilities, bank
loans, corporate bonds and commercial paper. In this way, we avoid
over-reliance on any particular liquidity source. We use cash in hand,
cash from operations and short-term borrowings to manage liquidity.
The following table summarises our funding structure
at 31 March 2016.
2016
US$m
2015
US$m
Overdrafts (159) (215)
Borrowings (11,520) (12,276)
Derivatives 672 1,114
Finance leases (61) (53)
Gross debt (11,068) (11,430)
Cash and cash equivalents 1,430 965
Net debt (9,638) (10,465)
Maturity of gross debt:
Within one year (2,801) (1,608)
Between one to two years (254) (2,169)
Between two and five years (3,504) (3,121)
Over five years (4,509) (4,532)
The average maturity of the gross committed debt portfolio is 7.0 years
(2015: 7.3 years).
On 15 June 2015 we repaid from existing resources our US$700
million 5.125% Notes due 2015.
On 7 August 2015 FBG Treasury (Aust) Pty Ltd issued AUD700 million
3.75% Notes due August 2020. The notes were issued under the
AUD3,000 million Guaranteed Medium Term Note Programme,
established on 21 July 2015 and guaranteed by SABMiller plc. The
proceeds from the bond were used to fund the repayment of
borrowings and for general corporate purposes.
Balance sheet
A significant proportion of the non-current assets on our balance
sheet reflect acquisitions since our listing on the London Stock
Exchange in March 1999. No goodwill or intangible assets are
recognised on the balance sheet in relation to businesses or brands
that have been developed organically or were acquired prior to 1998.
The same policy applies for our investments in associates and joint
ventures, including MillerCoors. Acquisitions post 1 April 1998 and
prior to the IFRS transition in 2005 were accounted for in accordance
with UK GAAP, with intangible assets, such as brands, not separately
recognised but instead forming part of the goodwill on the acquisition,
which was amortised over 20 years in most instances. On transition
to IFRS in 2005, we changed our policy and have recognised acquired
intangible assets, primarily brands, separately from goodwill on
acquisitions, with intangible assets subject to amortisation and with
no amortisation of goodwill. The goodwill and intangible assets relating
to investments in associates and joint ventures including MillerCoors
are subsumed within the investment total and not separately identified
on our balance sheet.
Total assets decreased to US$43,589 million from the prior year’s
US$44,911 million primarily as a result of the impact of currency
translation, partly offset by the profits earned and cash generated
in the year.
Goodwill decreased to US$14,268 million, a reduction of US$478
million compared with the prior year balance, mainly as a result of the
impact of foreign exchange rate changes on goodwill denominated in
currencies other than the US dollar, partly offset by the goodwill arising
on the acquisition of Meantime.
Intangible assets decreased to US$6,526 million, a reduction of
US$352 million compared with the prior year balance, primarily
reflecting foreign exchange movements and amortisation, partially
offset by additions mainly related to the Meantime brand and to the
development of digital capability, networks and communications.
Gross debt at 31 March 2016 decreased to US$11,068 million from
US$11,430 million at 31 March 2015 primarily as a result of the
repayment of outstanding commercial paper. Gross debt comprises
borrowings together with the fair value of financing derivative assets
or liabilities held to manage interest rate and foreign currency risk of
borrowings. Net debt (comprising gross debt net of cash and cash
equivalents) decreased to US$9,638 million from US$10,465 million
at 31 March 2015, reflecting positive free cash flow during the year.
As at 31 March 2016, we held cash and cash equivalent investments
of US$1,430 million (2015: US$965 million).
An analysis of net debt is provided in note 27c to the consolidated
financial statements. Our gearing (presented as a ratio of net debt
to equity) has decreased to 40.0% from 43.0% at 31 March 2015.
46 SABMiller plc Annual Report 2016
STRATEGIC REPORT |Finance review continued
Currency risk
Our debt profile by currency at 31 March 2016 (after taking account
of derivatives) is illustrated below.
Net debt profile
US$9,638m
US dollar 54%
Other 15%
Australian dollar 11%
Euro 10%
South African rand 6%
Colombian peso 4%
Interest rate risk
The weighted average interest rate for the total gross debt portfolio at
31 March 2016 decreased to 3.2% (2015: 3.5%) primarily reflecting the
repayment of some high interest rate debt during the year as well as
declines in interest rates in a number of key currencies.
Usage of derivative instruments
Our policy only allows the use of derivative instruments to manage
the currency, commodity and interest rate risks arising from our
operations and financing activities. Our policy does not allow trading
in financial instruments.
Currency
The exchange rates to the US dollar used in the preparation
of the consolidated financial statements are detailed in note 1 to the
consolidated financial statements. The weighted average rates, used
to translate the income statement and cash flow statement, of all
of the major currencies in which we operate depreciated against the
US dollar over the year. Whereas the closing rates for certain of the
major currencies in which we operate, including the Czech koruna,
the Polish zloty, the euro and the Australian dollar, appreciated against
the US dollar and the closing rates of the other major currencies
in which we operate depreciated against the US dollar.
Domenic De Lorenzo
Chief Financial Officer
10 June 2016
Our committed undrawn borrowing facilities decreased marginally
from US$3,644 million at 31 March 2015 to US$3,613 million at 31
March 2016. We have sufficient headroom to service our operating
activities and capital investment. Maturing debt in the next 24 months
includes US$300 million bonds due in June 2016, US$2,000 million
bonds due January 2017, ZAR1,000 million bonds due March 2018
and a number of local bank facilities. As at 31 March 2016 committed
headroom including committed undrawn borrowing facilities and cash
and cash equivalents was sufficient to cover all maturing facilities over
the next 24 months. We have continued to be able to access sufficient
and significant funding from a number of sources and expect to renew
maturing facilities as necessary.
Subsequent to the financial year end, the maturity dates of US$2,412
million of the US$2,500 million committed syndicated facility and
US$971 million of the SABMiller Holdings Inc US$1,000 million
committed syndicated facility were extended to May 2021. The
remaining portion of the two facilities continues with a maturity date
of May 2020.
Our credit rating from Moody’s Investors Service was lifted from Baa1
with a positive outlook to A3 with a stable outlook in June 2015. In
October 2015, the rating was placed on review with direction uncertain
by Moody’s Investors Service following the joint announcement that
AB InBev and SABMiller had reached an agreement in principle on
AB InBev’s intention to make an offer to acquire SABMiller. In June
2016 this was changed to a review for downgrade, following Moody’s
downgrade of AB InBev in May 2016, removing the potential for our
rating to be upgraded. Our credit rating from S&P Global Ratings
remains at A- with a stable outlook.
Currency, interest rate, commodity and credit
risk management
We manage the risks from foreign exchange, interest rates,
commodities and credit risk within a framework of policies approved
by the board and reviewed regularly. Exposures are managed within
target hedge levels and reported regularly to the treasury and audit
committees. Further details of the current individual risk management
policies are described in note 21 to the consolidated financial
statements. The impact of our key risk management policies is
detailed below.
STRATEGICREPORT
47SABMiller plc Annual Report 2016
Sustainable development
A thriving world A sociable world
Through Prosper and its five shared
imperatives we aim to tackle the issues that
are most material for our business at a local
and international level.
Shared opportunity We want a thriving world where incomes
and quality of life are growing
We want a sociable world where our beers
are developed, marketed, sold and
consumed responsibly
Shared imperative We will accelerate growth and social
development through our value chains
We will endeavour to make beer the
natural choice for the moderate and
responsible drinker
Our headline 2020 target is to Directly support more than half
a million small enterprises to
enhance their business growth
and family livelihoods
Aim to reach all of our beer consumers
with effective communication campaigns,
and partnerships to encourage moderate
and responsible beer consumption
Our sustainable development strategy, Prosper, is
embedded in our business strategy and will enable us to
secure growth that benefits us and local communities.
The year saw two ground-breaking global
agreements that will shape the development
agenda for years to come: the United Nations
launched 17 Sustainable Development
Goals (SDGs), and world leaders committed
to tackle climate change at COP21 in Paris.
Through Prosper, we can make a meaningful
contribution to these goals.
A thriving world
Businesses create jobs, develop markets,
and stimulate economic growth. Yet too many
people – especially women – are excluded
from the positive impact of economic growth.
The SDGs seek to tackle poverty, but also
broaden the concept of development to
encompass the provision of decent work,
enterprise development, women’s
empowerment, and reduced inequality.
One of the most powerful contributions
we make to these goals is through direct
and indirect employment, and through the
value we generate in our operations, our
value chain, and local economies. In the
year we generated US$21,640 million of
economic value through our business
activities, most of which was distributed
to employees, shareholders, governments,
and local communities.
Small- and medium-sized enterprises (SMEs)
account for nearly 70% of global employment1
.
The SDGs also emphasise the critical role that
these small businesses play in creating jobs
and economic growth, especially in areas
of high unemployment, poverty, and poor
social mobility.
SABMiller buys from or sells directly to
approximately 1.5 million small businesses
worldwide. Our business relies on the ability
of suppliers, farmers, distributors, and
retailers to survive, grow, and prosper with us.
That is why we have committed to support
over 500,000 of these small businesses to
enhance their growth and livelihoods. So far,
we have reached over 175,000.
1
International Trade Centre 2015.
Long-term commercial success demands
that we play a positive role in the communities
where we operate. This means supporting
jobs and stimulating growth, promoting
responsible alcohol consumption, and
stewarding water and other natural resources.
When our business prospers, communities
prosper. When communities prosper, so does
our business.
Through our five shared imperatives outlined
below, we aim to tackle the issues that are
most material for our business at a local and
global level. The imperatives give us global
focus and alignment, while allowing local
markets to respond to local needs. They are
‘shared’ because we can only tackle joint
risks in partnership with those who also face
them. By working together with local
communities, suppliers, governments,
consumers and beyond, we can create
value for all.
Our shared imperatives
48 SABMiller plc Annual Report 2016
STRATEGIC REPORT
A fair approach to taxation
Our fourth Our Approach to Tax report is
published alongside this Annual Report,
and shares information on our tax payments
and principles. The total taxes borne and
collected this year by the SABMiller group,
including our share of taxes paid by our US
joint venture amounted to US$9,507 million
(2015: US$10,639 million). These include
excise, corporate, and transactional taxes,
and taxes borne by employees. Of this total,
68% was paid in developing countries.
The corporate tax charge for the year was
US$1,152 million (2015: US$1,273 million),
and our effective tax rate was 26.3% (2015:
26.0%). We support moves towards greater
tax transparency and are actively working to
share more information with key stakeholders.
Read more on page 42
A sociable world
Harmful drinking is an issue of significant
concern – to governments, society, and
SABMiller. It is an issue that we are committed
to helping tackle. We support the aim of the
World Health Organization (WHO) to reduce
harmful alcohol consumption by 10% by
2025. This is also an area of focus for the
Sustainable Development Goals (SDGs).
We recognise too that consumer preferences
and values have been shifting to a greater
focus on health. Beer brings people together,
adding to the enjoyment of life, but we
must work proactively to meet all of
these expectations.
We are committed to addressing harmful
drinking through a mix of commercial and
programmatic interventions, coupled with
targeted regulatory interventions that we
will support or seek out as effective ways
to address particular types of irresponsible
and harmful drinking.
Our publicly available, comprehensive policies
help our employees and partners to meet our
demanding standards for producing and
marketing our products to encourage
responsible consumption.
Read more about our alcohol responsibility
policies at www.sabmiller.com/alcohol-
policy
Our Policy on Commercial Communication
(POCC) governs how and where we market
our brands. The POCC states that we will not
direct our marketing – including on social
media – to people under the legal drinking
age, or feature paid models below the age of
A resilient world A clean world A productive world
We want a resilient world where our
business, local communities and
ecosystems share uninterrupted access
to safe, clean water
We want a clean world where nothing
goes to waste and emissions are
dramatically lower
We want a productive world where land is
used responsibly, food supply is secure,
biodiversity is protected and brewing crops
can be accessed at reasonable prices
We will secure shared water
resources for our business and
local communities
We will create value through reducing
waste and carbon emissions
We will support responsible,
sustainable use of land for
brewing crops
Secure the water supplies we share with
local communities through partnerships
to tackle shared water risks
Reduce the carbon footprint per hectolitre
across our value chain by 25%1
, including
by 50% within our breweries, by 25%
across our packaging and by 25% across
our refrigeration carbon footprint
Ensure the sourcing of our crops
measurably improves both food
security and resource productivity
25 in any commercial communication. The
policy also incorporates the Beer, Wine and
Spirits Producers’ Commitments – a set of 10
commitments adopted by 12 global alcohol
companies to promote responsible practices.
All our operating companies, with very limited
exceptions in our smallest businesses, have a
sales and marketing compliance committee
(SMCC), which is mandated to ensure that any
proposed marketing materials comply with
the POCC, and with local laws and national
self-regulatory requirements. The SMCC has
the power to reject, or demand changes to,
any material that fails to comply. As at 31
March 2016, the SMCCs of almost three
quarters of our businesses involved non-
industry participation, including independent
chairs or independent audits of their work.
As at 31 March 2016, 70% of employees
worldwide had received alcohol responsibility
training within the past three years.
The root causes of harmful drinking are
complex and vary widely between countries
and cultures. More than 160 tailored local
programmes for reducing harmful alcohol use
bring to life our principles and comprehensive
policies. We believe in a multi-stakeholder
approach, and in almost every case we
collaborate with local partners, including
governments, non-governmental organisations,
civil society groups and public bodies such
as the police. We believe that by working
in partnership with other organisations
175,000+small businesses supported to
date across our value chain.
1
Against a 2010 base.
STRATEGICREPORT
49SABMiller plc Annual Report 2016
our approach and programmes are more
robust and credible, and more likely to
achieve change.
To find out more about SABMiller’s
alcohol responsibility programmes around
the world visit www.sabmiller.com/
responsibilityprogrammes
A resilient world
Water scarcity already affects more than
40% of the global population1
. This is a
serious issue that has major implications for
a global brewer: put simply, no water, no beer.
At the same time, water scarcity is holding
back economic and social development for
hundreds of millions of people around the
world. Tackling this successfully will release
untapped prosperity for everyone – from the
smallest farmers to global manufacturing
businesses and entire national economies.
20162015201420132012
3.223.3
3.5
3.7
4.0
Water to lager ratio hl water/hl lager
This year, we achieved a water efficiency
ratio of 3.2 hl/hl2
(2015: 3.3 hl/hl) and we are
on track to meet our target of 3.0 hl/hl by
2020. At 25 of our breweries, average
water efficiency is already below 3.0 hl/hl.
In absolute terms, we used 5972
million hl
of water to produce our lager (2015:
592 million hl).
3.2hl2
water to produce 1 hl lager, on
track to meet our target of 3.0 hl/
hl by 2020.
While water scarcity is a risk to our business
operations, it can also have severe human
and economic consequences for local
communities. Nearly all of our breweries have
now evaluated their exposure to water risk
using our bespoke water risk assessment
process. Each brewery has identified and
prioritised risks and developed action plans
in consultation with local stakeholders.
Our focus is now on implementing these
action plans – with the aim of effectively
mitigating the risks water scarcity poses
both to our sites and to local communities.
Tackling water scarcity and quality issues
requires collaboration between governments,
affected communities, businesses, and other
stakeholders. This year we formalised a new
global alliance with our longstanding partner,
World Wide Fund for Nature (WWF) to
support key priorities.
A clean world
Climate change has far-reaching
consequences for our business and the
communities where we operate, from water
scarcity and energy constraints, to reduced
food security and health risks. The Paris
climate talks in December 2015 marked
a turning point, as world leaders agreed
the first truly global commitment to act on
climate change.
We are on track to halve our on-site
greenhouse gas emissions per hectolitre of
lager between 2008 and 2020. In the year
ended 31 March 2016 fossil fuel emissions
per hl of lager produced fell by 5.4%, with total
CO2e emissions of 1.7 million tonnes (2015:
1.7 million tonnes), of which 0.8 million tonnes
were generated from our direct use of fuels
such as natural gas, coal and oil (scope
one) and 0.9 million tonnes were generated
indirectly from the production of electricity
and steam we purchase (scope two). Energy
savings have contributed the vast majority of
on-site emissions reductions.
20162015201420132012
8.929.4
10.3
11.1
12.4
CO2e emissions from fossil fuel energy
used on site kgCO2e/hl lager
However, reducing emissions from our
operations is just the first step. We have a
target to reduce our total carbon footprint per
hectolitre by 25% by 2020, from 2010 levels,
including a 25% reduction in both packaging
and refrigeration.
Prosper through our brands
We believe that by engaging with
consumers on shared concerns, our
brands can help to deliver societal benefits
while driving topline growth. Prosper
includes a target to build sustainable
development messages into the activations
of three brands in each market by 2020.
Across SABMiller, 44 brands have now
adopted sustainable development
activities. This includes Cusqueña in
Peru, which is supporting the livelihoods
of local weavers. As part of the support
programme, 50 Cusqueñan weavers
crafted a world first – a giant hand-woven
woollen billboard using more than one
million individual threads.
In Europe, where unemployment among
target consumers is a growing problem,
Excelent (Czech Republic and Slovakia),
Kornuit (Netherlands) and Nastro Azzurro
(Italy) are each supporting young
entrepreneurs to achieve their dreams.
Read more at www.sabmiller.com/
prosperandbrands
Prosper and the UN Sustainable
Development Goals (SDGs)
SABMiller is committed to rising to the
challenge of the SDGs, and helping to make
them a reality. Each of our shared imperatives
are already aligned to a number of SDGs.
Visit our website for more detailed information
on how we will play our part at www.
sabmiller.com/prosper-and-the-sdgs
50 SABMiller plc Annual Report 2016
STRATEGIC REPORT |Sustainable development continued
Returnable bottles and kegs are much
more carbon- and resource-efficient
throughout their lifecycle than cans, PET
bottles or non-returnable glass bottles. 51%
of our beer was sold in returnable bottles and
kegs (2015: 53%). We also work with suppliers
to reduce the weight and environmental
impact of all packaging in the relevant market.
SABMiller has a target to purchase 100%
HFC-free fridges by 2020, and we are
working hard to make this economically and
practically feasible for retailers. This year, 20%
of the fridges we purchased were HFC-free.
Through introducing more energy-efficient
fridges, we estimate an average annual saving
of US$106 per trade fridge for the retailer.
Around 97% of spent grain from our
breweries is reused typically by farmers for
animal feed or for renewable energy, creating
value as well as preventing waste from
being diverted to landfill. During the year our
breweries reused or recycled 89% of brewery
waste (2015: 90%).
SABMiller is an ‘A list’ performer in the CDP’s
Carbon Performance Leaders Index. Read our
CDP reports at www.cdp.net
A productive world
Around 1.3 billion people work in agriculture,
producing most of the world’s food but just
3% of global GDP3
. Agriculture also uses
one-third of the world’s land and accounts
for 70% of all fresh water withdrawals.1
As demand for food grows, there is a
pressing need to produce more with less,
to reduce crop losses, and to improve
agricultural livelihoods.
Quality malting barley is a key ingredient
of beer. SABMiller has identified priorities
in each of our barley sourcing regions, and
is working with farmers and, where relevant,
malt suppliers to ensure malting barley is
economically attractive to farmers, climate
resilient and resource efficient. Buying
locally-grown barley can reduce costs, create
jobs and increase incomes. However, it is
not suitable for all climates, making imports
necessary in some markets.
Incorporating local crops like cassava, maize,
rice, and sorghum into our beers supports
local farmers and helps us produce more
affordable beer. Our Africa Go Farming
strategy is doing just that. In multiple markets
we are working to source the most
appropriate crop in the local context to be
used for brewing (read more on page 7).
We have a target to source 100% of our
sugarcane from sustainable sources by 2020.
During the year, 15.3%2
of our global sugar
supply from sugarcane came from
sustainable sources (2015: 5.1%). This
represents all sugar sourced from our
Azunosa sugar mill in Honduras, which
became Bonsucro-certified in 2014. Based
on significant progress made towards
sustainable sugarcane with suppliers in
Latin America, South Africa and Australia
representing an additional 59% of our
supply, we are confident that we are on
track to meet our 2020 target.
15.3%2
of sugar sourced from sugarcane
meeting sustainable standards.
Embedding Prosper across
our business
To ensure that Prosper delivers its full
potential as a route to unlocking value for the
business and benefits for society, we have
focused during the year on further integrating
Prosper into the way we drive business
performance. All parts of our business, from
Australia to Zambia, and from procurement to
sales, have a role to play in delivering Prosper
as an integrated part of their strategy and day-
to-day activity.
As part of our business planning process,
in the year, each region and global function
completed a Prosper progress review, to
assess the fit of Prosper with core elements
of strategy, and to identify key challenges in
delivering our Prosper targets. Insights from
this process have been used to identify areas
requiring additional focus and resource.
Our Prosper performance is measured
through our bespoke management system,
the Sustainability Assessment Matrix (SAM)
and is overseen by the group corporate
accountability and risk assurance committee
(CARAC), a committee of the SABMiller plc
board. The CARAC is chaired by Dambisa
Moyo, a non-executive director of SABMiller
plc (see pages 54 and 55 for a full list of
members). Each region also has its own
CARAC, chaired by the regional managing
director, which meets twice a year to review
local Prosper performance and discuss
emerging issues.
1
United Nations, 2016.
2
Information for the year ended 31 March 2016 has been
subject to limited assurance by PricewaterhouseCoopers
LLP. For further details of the assurance provided see
the independent assurance report on pages 36 and 37
of the Sustainable Development Report 2016.
3
International Labor Organization, 2016 and
World Bank, 2014.
Transparency and ethics
Our Code of Business Conduct and Ethics
provides the overarching basis under which
our employees and officers are required to
uphold high standards of ethical conduct.
We have a long-standing commitment to
transparency, honesty, integrity and fairness,
and to a zero tolerance approach to bribery,
as we strongly believe this is a fundamentally
important tenet of doing business.
Our projects during this year have included a
review of our global procurement procedures
to enhance, clarify and streamline our
expectations of suppliers, including a review
of our due diligence approach and Code
of Conduct for Suppliers. We believe we
should actively drive social, economic and
environmental improvements in our supply
chain, ultimately helping to improve livelihoods
and build communities, and our Supplier
Code of Conduct details how we expect
SABMiller Procurement suppliers to act to
ensure that our high anti-corruption standards
are continually achieved.
Read more at
www.sabmiller.com/anti-corruption
Further reports
Find out more about our sustainable
development performance in our Sustainable
Development Report 2016 and our tax
payments and principles in Our Approach
to Tax report.
The Mackay Awards
Last year we launched The Mackay Awards
to recognise and reward the initiatives by
SABMiller teams around the world that
best contribute to delivering our shared
imperatives and 2020 targets. This year a
Prosper Pitch category was introduced for
employees to submit new ideas that would
help deliver the ambitions behind Prosper.
The winning entry will receive seed funding
and senior management support to put the
idea into action.
Sustainable
Development Report
2016
SABMiller plc
1
Our Approach to Tax
2016
SABMiller plc
STRATEGICREPORT
51SABMiller plc Annual Report 2016
Valuing and supporting our people
Our success is driven by the thousands of people that we employ,
and the millions in our value chains. Supporting people is at the
heart of our business, of Prosper and of all five shared imperatives.
Improving health and safety
We strive to reduce or eliminate risks of harm
to our employees, contractors, and all others
affected by our business. Our global health
and safety programme, Safety Around
Beverages, sets minimum standards for
all businesses. Our group-wide health and
safety governance system has standardised
reporting across the group, and enables us to
target improvements and share best practice.
During the year we recorded 8,357 days lost
through injury (2015: 13,028) and 142 major
injuries (2015: 490). Road traffic accidents
accounted for a significant proportion of
fatalities, and road safety remains a top
priority worldwide.
Our South African business has launched a
new campaign, called ACT10N, to reinforce
the 10 global safety standards in the Safety
Around Beverages programme in simple and
engaging ways. The campaign emphasises
personal responsibility, while making line
managers accountable for giving their teams
the knowledge and skills needed to behave
safely. Powerful docu-drama films and other
communications are capturing employees’
attention and making sure that the safety
message resonates.
Promoting wellbeing
We aim to create a healthy and positive
work environment for all our employees,
acknowledging the benefits this provides in
terms of productivity. In Africa, our Wellness
Development Programme focuses on HIV/
Aids, malaria, sexually transmitted infections,
hepatitis B and C, and tuberculosis. Our focus
is to train employees to educate their peers at
work, at home and in their wider communities,
by promoting prevention, testing and
treatment of these diseases. In countries
Supporting employees through change
Since the boards of SABMiller and AB InBev reached agreement in principle on the key
terms of a recommended offer, looking after our people has been a priority. We have created
a People Plan to keep all employees informed about the proposed transaction, and how they
might be affected. The plan is designed to treat and remunerate our people fairly, keep hold
of our best talent, and support our teams through the potential changes. It also aims to ensure
that our business keeps delivering results while making a smooth transition to a new company
where our people can continue to develop their careers.
We have kept our people informed through town-hall meetings, functional meetings, individual
meetings with managers, and regular communications. Employees have had their say through
focus groups and surveys conducted worldwide. Most of those participating have said that,
despite the potential changes, they feel empowered to make decisions, understand their goals,
feel positive about their line managers, and are learning useful skills for their careers.
Leadership skills become more critical than ever during periods of change. To support leaders
during the period, we developed a toolkit to provide further support and resources that address
some of the most common leadership challenges during transition. This includes a combination
of quick, easy to access resources such as top tips, along with short articles and videos to help
leaders with leading their teams in a period of uncertainty.
It is therefore with the deepest regret that we
report that 27 employees and contractors lost
their lives at work this year (2015: 29). Eight of
these fatalities resulted from accidents during
on-site maintenance or repairs, 10 from road
traffic accidents, and nine were the result of
robberies or assaults on employees during
sales or trade visits. Our businesses
investigated each case and, where applicable,
put in place measures to reduce the likelihood
of these incidents recurring.
52 SABMiller plc Annual Report 2016
STRATEGIC REPORT |People
Promoting human rights
in our supply chain
Tackling human rights risks in our supply
chain requires transparency about the
situation and collaboration to address any
issues. This has been a focus for SABMiller
Procurement since it was established in
2010. We welcome the focus the UK’s
Modern Slavery Act puts on this area of
human rights.
To understand the risks in our supply
chain we have implemented a supplier
accreditation programme including on-site
audits of high-risk suppliers. We understand
that audits have their limitations, but believe
that by helping suppliers to address gaps
in their risk management processes, and
by accelerating our support for Prosper,
we can reduce the risk of human rights
violations, including modern slavery, in our
supply chains. Our ambition is for 80% of
our spend to be with accredited suppliers
by 2020.
In Africa, we are working closely
with Partner Africa, a leading social
enterprise and pioneer in ethical and
socially responsible business practices,
to help suppliers in the region to meet
our global standards.
1
Defined as greater than 5% of the population.
2
13,896 women and 54,321 men as at 31 March 2016.
3
Information for the year ended 31 March 2016 has been
subject to limited assurance by PricewaterhouseCoopers
LLP. For further details of the assurance provided see the
independent assurance report on pages 36 and 37 of the
Sustainable Development Report 2016.
4
2,855 women and 6,715 men as at 31 March 2016.
5
As at 31 March 2016, 64 women and 360 men were
directors of subsidiary companies included within the
consolidated financial statements.
6
Professional Boards Forum, BoardWatch, 2016.
Recognising performance
Our performance management system
provides a framework for employees to set
themselves stretching individual goals and
ensures that we recognise and reward strong
performance. These goals are linked to
business objectives. Bonus payments and
salary increases are linked to performance
against these goals, and calculated against
a combination of individual achievement and
overall company performance.
Respecting human rights
SABMiller is committed to respecting
internationally recognised human rights as
set out in the International Bill of Human
Rights. We are a signatory of the UN Global
Compact. We have developed an approach
which helps our local businesses to identify
and mitigate human rights risks within their
operations and value chains, in line with the
UN Guiding Principles on Business and
Human Rights. During the year, we updated
our human rights policy to clarify our position
on areas such as land rights and grievance
mechanisms. We held workshops in London,
Bangalore, Johannesburg, and Miami to
review this and work out how best to address
human rights risks in different local contexts.
We respect the right to union representation
and 44.1% of employees are union members
or covered by collective bargaining
agreements (2015: 42.8%).
Modern slavery
Modern slavery includes slavery, servitude,
forced labour, and human trafficking. Modern
slavery can be difficult to identify in supply
chains due to a shared interest in hiding it
among organisations exploiting workers, and
also among workers who fear losing their jobs
or even deportation. While modern slavery is
a global problem, there is a greater risk that
it may be present in the agriculture and
manufacturing sectors. Our Human Rights
Policy and Supplier Code of Conduct prohibit
all forms of modern slavery. We take a
risk-based approach to seek to understand
and address the risk of modern slavery,
through robust due diligence and
engagement with suppliers and other key
local stakeholders.
Read SABMiller’s UK Modern Slavery Act
statement at www.sabmiller.com/
modernslaveryact
where HIV/Aids has a high prevalence1
, we
provided free voluntary counselling and
testing for 56% of employees in the last year.
Valuing diversity and equality
Women’s empowerment and gender diversity
are central themes of the UN Sustainable
Development Goals (SDGs) and a business
imperative. Women are a vital source of talent
in an increasingly competitive employment
market, play a central role in our value chain,
and represent a huge potential market.
In an industry still seen as male dominated,
we are determined to improve gender
diversity, particularly among our leadership.
Women represent 20.4% of our global
workforce2
(2015: 20.6%) and 29.8%3
of
executives and managers4
(2015: 29.6%)5
.
Our ten-strong executive committee includes
one woman. 20% of SABMiller’s plc board is
female – below the FTSE 100 average of
25.9%6
, although women hold three of our
seven independent non-executive director
posts (43%).
29.8%3
Female managers and executives
We have clear policies and processes for
recruiting and treating people fairly and on
merit, regardless of age, gender, sexual
orientation, religion, disability, or ethnic origin.
However, we know we can do more to attract
female employees. In Africa, we launched
Plus One – an initiative that aims to increase
the percentage of females across our African
businesses at the management and executive
level. In Australia, we established a local
Diversity Forum in the year, which is chaired
by the regional managing director. The forum
is examining ways to ensure the business
attracts, retains, and develops high-
performing women.
We continue to support South Africa’s
Broad-Based Black Economic Empowerment
(BBBEE) initiatives for growing the economy
by including and empowering previously
disadvantaged citizens. 81% of The South
African Breweries (Pty) Ltd (SAB) workforce
is from previously disadvantaged groups
and 63% of its employees are black. SAB
achieved 78.54 (2015: 79.24) in the last annual
BBBEE verification, making it a level 5
contributor under the new BBBEE code
of good practice.
STRATEGICREPORT
53SABMiller plc Annual Report 2016
GOVERNANCE
Board of directors
Development for Europe and the Americas,
Director of the global corporate finance
and development team, Director, Group
Strategy & Corporate Development. He
has an in-depth understanding of the
group and of the global brewing industry
and has led many of the group’s major
M&A transactions.
Current appointments: He does not
have any external appointments.
Previous appointments: Prior to his
appointment as Chief Financial Officer, he
held the position of Acting Chief Financial
Officer, and prior to that, he led the group’s
corporate finance and development and
strategy team.
Member of: Executive committee (excom)
4. Guy Elliott – Deputy Chairman and
Senior Independent Director
Appointed to the board: 1 July 2013
Skills and experience: Guy has extensive
experience of operating in both developed
and developing markets, having previously
held a variety of finance, marketing,
strategy and general management
positions throughout his career.
Current appointments: He is a
non-executive director of Royal Dutch Shell
plc. He is a member of the UK Takeover
Panel and chairman of the Panel’s Code
Committee.
Previous appointments: He was
previously Chief Financial Officer of Rio
Tinto plc and Rio Tinto Limited and also
a non-executive director of Cadbury plc,
serving as chairman of its audit committee
and as Senior Independent Director.
Member of: Audit committee
Remuneration committee
Nomination committee
5. Mark Armour – Non-executive
director
Appointed to the board: 1 May 2010
Skills and experience: Mark brings
strategic and financial expertise to the
board and has significant experience
of managing an international group.
Company transaction. He is also a member
of the advisory board of Metalmark
Capital LLC.
Previous appointments: He is the former
chairman and CEO of the Philip Morris
group of companies, the former chairman
of Altria and Kraft Foods Inc. and a past
non-executive director of News
Corporation Ltd, the New York Stock
Exchange and BSkyB plc.
Member of: Corporate accountability and
risk assurance committee (CARAC)
Nomination committee
8. Dinyar Devitre – Non-executive
director
Appointed to the board: 16 May 2007
Skills and experience: Dinny brings both
financial expertise and strategic counsel to
the group. He has extensive experience of
managing global fast-moving consumer
goods corporations.
Current appointments: A nominee of
Altria, he is a member of the board of Altria,
a special adviser at General Atlantic LLC,
and a director and chairman of the audit
and risk committee of Markit Group Ltd. He
is also the Executive Chairman of Pratham
USA, serves as a trustee of the Brooklyn
Academy of Music and is a trustee
emeritus of the Asia Society.
Previous appointments: His career
with the Altria group of companies spans
a 36 year period in which he served in
a variety of senior positions. Before his
retirement in 2008, he served as the Senior
Vice President and Chief Financial Officer
of Altria. He was also a director and
chairman of the Corporate Governance
and Public Policy Committee at Western
Union Company.
Member of: Audit committee
9. Javier Ferrán – Non-executive
director
Appointed to the board: 23 July 2015
Javier will be stepping down from the board
at the conclusion of the 2016 annual
general meeting.
Skills and experience: Javier has
in-depth knowledge of consumer brands
on an international basis and of international
financing. He brings extensive experience
Current appointments: He is a
non-executive director of Tesco plc, and a
director of the Financial Reporting Council,
the UK’s independent regulator responsible
for promoting high quality corporate
governance.
Previous appointments: He was
previously Chief Financial Officer of Reed
Elsevier (now RELX). Prior to joining Reed
Elsevier in 1995 he was a partner of Price
Waterhouse in London.
Member of: Audit committee (Chairman)
Remuneration committee
6. Dave Beran – Non-executive
director
Appointed to the board: 23 July 2015
Skills and experience: Dave has
considerable global business experience
and an extensive knowledge of the fast
moving consumer goods industry.
Current appointments: He is a nominee
of Altria. He serves on the board of trustees
for the Richmond Ballet.
Previous appointments: He was, until
his retirement in March 2015, the President
and Chief Operating Officer of Altria and
was responsible for overseeing Philip
Morris USA, U.S. Smokeless Tobacco
Company, John Middleton, Nu Mark,
Altria Group Distribution Company and
Ste. Michelle Wine Estates. He joined the
Altria family of companies in 1976. His
previous positions at the company include
Vice Chairman for Altria Group; Executive
Vice President and Chief Financial Officer
for Altria; Executive Vice President and
Chief Financial Officer for Philip Morris
USA; and Executive Vice President of
Finance, Planning & Information for Philip
Morris USA.
7. Geoffrey Bible – Non-executive
director
Appointed to the board: 1 August 2002
Skills and experience: Geoff has held
senior roles in a number of multinational
companies and has a wealth of experience
of global consumer products businesses.
Current appointments: He is a nominee
of Altria and was appointed to the board
following completion of the Miller Brewing
1. Jan du Plessis – Chairman
Appointed to the board:
1 September 2014
Skills and experience: Jan has an
excellent record as a chairman of major
international groups with developing market
footprints and a wealth of experience of
international consumer businesses.
Current appointments: He is chairman
of Rio Tinto plc and Rio Tinto Limited.
Previous appointments: In his earlier
career he was Group Finance Director
of Compagnie Financière Richemont, the
Swiss luxury goods group. He has also
served as a non-executive director and
subsequently chairman of British American
Tobacco plc, as a non-executive director
and chairman of the audit committee of
Lloyds Banking Group plc and as a
non-executive director and senior
independent director of Marks and
Spencer Group plc.
Member of: Corporate accountability and
risk assurance committee (CARAC)
Nomination committee (Chairman)
2. Alan Clark – Chief Executive
Appointed to the board: 26 July 2012
Skills and experience: Alan has an
extensive knowledge of the global
beverage industry, having held a number of
management roles with the group, both in
beer and soft drinks. He became Managing
Director, SABMiller Europe, in 2003 and
was appointed as an executive director and
Chief Operating Officer of SABMiller plc in
2012, before becoming Chief Executive in
April 2013.
Current appointments: He does not
have any external appointments.
Member of: Corporate accountability and
risk assurance committee (CARAC)
Executive committee (excom)
3. Domenic De Lorenzo – Chief
Financial Officer
Appointed to the board: 23 July 2015
Skills and experience: A chartered
accountant, Domenic has held a number of
senior positions in the group, including that
of Director, Corporate Finance and
3.
16.
5.
11. 7.
15.
2.
6.
54 SABMiller plc Annual Report 2016
11. Trevor Manuel – Non-executive
director
Appointed to the board:
1 March 2015
Skills and experience: Trevor is a former
minister in the South African Government.
He brings a wealth of experience in
advising multilateral organisations on
emerging market development and
sustainability.
Current appointments: He is Deputy
Chairman of Rothschild South Africa,
serves on the International Advisory Board
of the Rothschild Group and is a director
of Swiss Re AG and Old Mutual plc.
Previous appointments: He was a
minister in the South African Government
for more than 20 years, 13 of which he
served as Finance Minister. During his
ministerial career he assumed a number of
ex officio positions at international bodies,
including the United Nations Commission
for Trade and Development (UNCTAD), the
World Bank, the International Monetary
Fund, the G20, the African Development
Bank and the Southern African
Development Community.
Member of: Corporate accountability
and risk assurance committee (CARAC)
12. Dambisa Moyo – Non-executive
director
Appointed to the board:
1 June 2009
Skills and experience: Dambisa is a
global economist and commentator on the
macro-economy and global affairs. She
has wide-ranging expertise in economic
and business trends on the African
continent, with a particular focus on
socially responsible business.
Current appointments: She is a
non-executive director of Barclays PLC,
Barrick Gold Corporation and Seagate
Technology plc.
Previous appointments: She was an
economist at Goldman Sachs, where she
worked for nearly a decade, and was a
consultant to the World Bank in
Washington, D.C.
of the global alcohol beverage industry and
experience of operating in both mature and
emerging markets.
Current appointments: He is a
non-executive director of Associated British
Foods plc, and a member of its nomination
and remuneration committees. He is a
partner in Lion Capital LLP, a consumer
focused private equity firm, where he is
a member of its investment committee.
He is also a director of Coca-Cola
European Partners.
Previous appointments: He completed
a 20 year career with the Bacardi Group in
2004, serving in a variety of key executive
positions, including President and Chief
Executive Officer. After leaving Bacardi he
was appointed director and subsequently
vice chairman of William Grant & Sons,
a position he held until April 2014.
Member of: Remuneration committee
10. Lesley Knox – Non-executive
director
Appointed to the board: 19 May 2011
Skills and experience: Lesley brings a
wealth of strategic and financial experience
across a range of businesses and is an
experienced remuneration committee
chairman. She qualified as a solicitor
in the UK and as an attorney in the USA.
Current appointments: She is a
non-executive director of Centrica plc
where she chairs the remuneration
committee, a non-executive director of
Legal & General Group Plc and Thomas
Cook Group plc and is a trustee of the
Grosvenor Estates and chairman of
Grosvenor Group Limited. She is involved
with a number of arts and charitable
organisations.
Previous appointments: She was
previously with British Linen Bank,
becoming governor in 1999 and was
subsequently a founder director of British
Linen Advisers. She was chairman of
Alliance Trust plc, senior non-executive
director of Hays Plc and spent 15 years
with Kleinwort Benson, first in corporate
finance and then as chief executive of the
institutional asset management business.
Member of: Audit committee
Remuneration committee (Chairman)
Nomination committee
Member of: Corporate accountability
and risk assurance committee (CARAC)
(Chairman)
13. Carlos Pérez Dávila –
Non-executive director
Appointed to the board: 9 November
2005
Skills and experience: Carlos has
extensive experience of the global
beverage industry and of operating in the
Latin America region.
Current appointments: He is a nominee
of the Santo Domingo Group and was
appointed to the board following
completion of the Bavaria transaction. He is
Managing Director at Quadrant Capital
Advisors, Inc., chairman of the board of
Caracol TV S.A. and serves on the board
and executive committee of Valorem S.A.
He is also a director of Comunican S.A.,
Cine Colombia S.A. and the Queen Sofia
Spanish Institute.
Previous appointments: He began his
career in investment banking at Goldman,
Sachs & Company, subsequently working
for SG Warburg & Co., where he served as
the Director of Overseas Advisory Division
and Violy, Byorum & Partners, where he
was Senior Managing Director.
14. Alejandro Santo Domingo Dávila
– Non-executive director
Appointed to the board: 9 November
2005
Skills and experience: Alejandro has a
deep knowledge of the global beverage
industry and of the Latin America region.
Current appointments: He is a nominee
of the Santo Domingo Group, appointed to
the board following completion of the
Bavaria transaction. He is Managing
Director at Quadrant Capital Advisors, Inc.,
and serves on the boards of Valorem S.A.,
Comunican S.A., Caracol Television S.A.,
Millicom International Cellular S.A. and D.E
Master Blenders B.V. He is the treasurer of
Aid for AIDS charity, a member of the board
of trustees of The Metropolitan Museum of
Art and is also a member of the board
of the US-based DKMS Americas
Foundation, WNET (Channel Thirteen)
and the Wildlife Conservation Society.
Previous appointments: He was
employed at Violy, Byorum & Partners,
Investment Bankers where he was
focused on mergers and acquisitions
in telecommunications, media and
consumer goods.
Member of: Nomination committee
15. Helen Weir – Non-executive
director
Appointed to the board: 19 May 2011
Skills and experience: Helen has
extensive financial and retail expertise,
with senior management experience in a
number of UK and international companies.
Current appointments: She is the Chief
Finance Officer of Marks and Spencer
Group plc, a trustee of Marie Curie and an
independent non-executive director of the
Rugby Football Union, the national body for
rugby in England.
Previous appointments: She was
Group Finance Director of the John Lewis
Partnership and has previously held a
number of senior positions at the Lloyds
Banking Group and Kingfisher plc. She is
also a former member of the Accounting
Standards Board. She spent her early
career at Unilever and McKinsey & Co.
Member of: Audit committee
Corporate accountability and risk
assurance committee (CARAC)
Nomination committee
16. Stephen Shapiro – Group
Company Secretary and Deputy
General Counsel
Appointed as Group Company
Secretary: 1 November 2014
Stephen joined SABMiller in 2002 and was
appointed Group Company Secretary in
November 2014. He is also Deputy General
Counsel, with responsibility for managing
the internal commercial legal function,
managing material legal risk, and
developing group policy in key areas.
He is a member of the Council of the
International Chamber of Commerce UK.
8.
1.
12.
10.4. 13. 9.
14.
GOVERNANCE
55SABMiller plc Annual Report 2016
GOVERNANCE
Executive committee
3.
9.
4.
2.
8.
3.
9.
4.
2.
8.
The executive committee (excom) is
appointed by the Chief Executive after
consultation with the board. It comprises
the Chief Executive, the Chief Financial
Officer, regional managing directors and
directors of group functions. Its purpose is
to support the Chief Executive in carrying
out the duties delegated to him by the board.
In that context, excom executes the strategy
and budget approved by the board. It also
ensures that regular management reports
are presented to the board, that effective
internal controls are in place and
functioning, and that there is an effective
risk management process in operation
throughout the group.
1. Mark Bowman – Managing Director,
SABMiller Africa
Appointed to the executive committee:
1 October 2007
Mark was appointed Managing Director
of SABMiller Africa in 2007 and has been
instrumental in developing SABMiller’s beer
and soft drinks operations on the African
continent. Following the consolidation of
SABMiller’s South Africa beverage
business and Africa division into one region
for management purposes, he became
Managing Director of the enlarged
SABMiller Africa region on 1 July 2014.
He joined The South African Breweries
Limited (SAB Ltd) in 1993 and has held
various senior positions in the group
including Managing Director of Kompania
Piwowarska S.A., Managing Director of ABI
(the soft drinks division of SAB Ltd) and
Chairman of Appletiser.
He is an independent non-executive
director of Tiger Brands Limited.
2. Alan Clark – Chief Executive
Appointed to the executive committee:
1 October 2000
Alan’s biography can be found on page 54.
3. Sue Clark – Managing Director,
SABMiller Europe
Appointed to the executive committee:
10 February 2003
Sue was appointed Managing Director,
SABMiller Europe in June 2012. She joined
SABMiller in 2003 as Corporate Affairs
Director. Before this, she held a number
of senior roles in UK companies, including
that of Director of Corporate Affairs for
Railtrack Group and Scottish Power plc.
She is an independent non-executive
director of Britvic plc.
56 SABMiller plc Annual Report 2016
10.
7.
6.
1.
5.
4. John Davidson – General Counsel
and Corporate Affairs Director,
SABMiller plc
Appointed to the executive committee:
1 August 2006
John joined the group as General Counsel
and Group Company Secretary in 2006. In
November 2014 he assumed responsibility
for regulatory affairs, communications and
sustainable development, and is now
General Counsel and Corporate Affairs
Director. Before joining SABMiller, he spent
his entire legal career at Lovells, a leading
international law firm, where he was a
partner from 1991, specialising in
international corporate finance, cross
border mergers and acquisitions, and
corporate governance advisory work.
He was the Chairman of the GC100 group
(the association of general counsel and
company secretaries of companies in the
FTSE 100) for 2010 and 2011.
5. Domenic De Lorenzo – Chief
Financial Officer, SABMiller plc
Appointed to the executive committee:
1 July 2011
Domenic’s biography can be found on
page 54.
6. Nick Fell – Marketing Director,
SABMiller plc
Appointed to the executive committee:
1 August 2006
Nick was appointed Marketing Director,
SABMiller plc in 2006. He has extensive
experience in developing global
commercial strategy and previously held
senior roles in Cadbury Schweppes Plc
and Diageo plc.
7. Tony van Kralingen – Group
Director: Integrated Supply,
SABMiller plc
Appointed to the executive committee:
1 February 2003
Tony was appointed Director: Integrated
Supply & Human Resources, SABMiller plc
in October 2008. He joined SAB Ltd in
1982 and has held a number of senior
positions in the group, including that of
Chairman and Chief Executive Officer,
Plze ský Prazdroj a.s. and, most recently,
Chairman and Managing Director: SAB Ltd.
He relinquished responsibility for human
resources in September 2015 and remains
accountable for group procurement,
technical, planning and distribution
and R&D.
8. Karl Lippert – President, SABMiller
Latin America
Appointed to the executive committee:
1 January 2011
Karl was appointed President, SABMiller
Latin America in 2011. He joined the group
in 1992 and has extensive experience in the
global brewing industry. He has held a
number of senior positions in the group
including that of President of Bavaria S.A.
and Managing Director of Kompania
Piwowarska S.A.
9. Ari Mervis – Managing Director,
SABMiller Asia Pacific and Chief
Executive Officer, Carlton & United
Breweries
Appointed to the executive committee:
1 October 2007
Ari was appointed Managing Director,
Asia Pacific and Chief Executive Officer
of Carlton & United Breweries in 2011. He
joined ABI, the soft drinks division of SAB
Ltd, in 1989 and has held various senior
positions in sales, marketing, finance and
general management. He has held the
position of Managing Director, SABMiller
Asia, Managing Director of Appletiser and
Managing Director of SABMiller operations
in Russia and Australia.
He is a director of the Melbourne Business
School, and Chairman of China Resources
Snow Breweries.
10. Johann Nel – Group Human
Resources Director, SABMiller plc
Appointed to the executive committee:
14 September 2015
Johann was appointed Group Human
Resources Director, SABMiller plc in
September 2015. He originally joined
SAB Ltd in 1997 as Human Resources
Director and was Group Human Resources
Director for SABMiller plc and a member
of the executive committee from 2002
until his retirement from the group in
2008. After retiring from SABMiller in
2008, Johann continued consulting and
lecturing in the areas of human resources,
change management, global strategy
and leadership in collaboration with
a wide variety of organisations and
academic institutions.
10.
7.
6.
1.
5.
j g p
his entire legal career at Lovells, a leading
international law firm, where he was a
partner from 1991, specialising in
international corporate finance, cross
border mergers and acquisitions, and
corporate governance advisory work.
He was the Chairman of the GC100 group
(the association of general counsel and
company secretaries of companies in the
FTSFTSE 1E 100)00) fofor 2r 2010010 anand 2d 2011011.
5. Domenic De Lorenzo – Chief
Financial Officer, SABMiller plc
Appointed to the executive committee:
1 July 2011
Domenic’s biography can be found on
page 54.
Director: Integrated Supply,
SABMiller plc
Appointed to the executive committee:
1 February 2003
Tony was appointed Director: Integrated
Supply & Human Resources, SABMiller plc
in October 2008. He joined SAB Ltd in
1982 and has held a number of senior
positions in the group, including that of
ChChaiirman dand ChChi fief EExecutitiv Oe Offifficer,
Plze ský Prazdroj a.s. and, most recently,
Chairman and Managing Director: SAB Ltd.
He relinquished responsibility for human
resources in September 2015 and remains
accountable for group procurement,
technical, planning and distribution
and R&D.
9. Ari Mervis – Managing Director,
SABMiller Asia Pacific and Chief
Executive Officer, Carlton & United
Breweries
Appointed to the executive committee:
1 October 2007
Ari was appointed Managing Director,
Asia Pacific and Chief Executive Officer
fof CCarltlto &n & UUnitited Bd Brew ieries iin 20120111. HHe
joined ABI, the soft drinks division of SAB
Ltd, in 1989 and has held various senior
positions in sales, marketing, finance and
general management. He has held the
position of Managing Director, SABMiller
Asia, Managing Director of Appletiser and
Managing Director of SABMiller operations
in Russia and Australia.
Director and was Grou
Director for SABMiller
of the executive comm
until his retirement from
2008. After retiring fro
2008, Johann continu
lecturing in the areas o
change management,
and leadership in colla
a wide varietyy of orggan
academic institutions.
GOVERNANCE
57SABMiller plc Annual Report 2016
GOVERNANCE
Corporate governance
Dear Shareholder
This report describes how our board applies the UK Corporate
Governance Code (the Code) and its general approach to corporate
governance. The role of the board is to oversee the governance
of the company, and to ensure that the principles on matters such
as leadership, board effectiveness, financial accountability and risk
management are rigorously applied.
The most important task for the board in the year was our
consideration and recommendation of the takeover offer from
AB InBev. The board’s initial rejection of terms that it considered
did not adequately value SABMiller resulted ultimately in significantly
improved offer terms, and an agreement between SABMiller and
AB InBev pursuant to which AB InBev has agreed to use its best
efforts to secure the regulatory clearances and authorisations
necessary to satisfy the pre-conditions and regulatory conditions
to the transaction, with a break fee of US$3 billion payable if these
clearances are not achieved. Both parties have agreed to certain
undertakings to cooperate and provide each other with reasonable
information, assistance and access in relation to the filings,
submissions and notifications to be made in relation to those
regulatory clearances and authorisations.
Nevertheless, the board remains focused on the need for our business
to continue to perform strongly and to pursue its strategic objectives
until the transaction is completed. Until that time, the board’s duties in
relation to governance and leadership are unaffected.
In the year the board, with the help of the audit committee, reviewed
the risk management activities of the group to ensure that they were
aligned with the revised Code, which requires that directors confirm
that they have made a robust assessment of the principal risks facing
the company and monitor the company’s risk management systems
and controls. The company has a thorough biannual risk assessment
process and actively monitors the effectiveness of the risk mitigations
and controls. Our audit committee has overseen the risk management
processes implemented by management and the board has
conducted a robust assessment of the principal risks facing the group.
Our effectiveness review has confirmed that the board and its
committees are operating effectively and fulfilling their respective
mandates, and that board members are performing satisfactorily.
I am also pleased to confirm that notwithstanding the distraction of
the AB InBev offer, good progress has been made in addressing each
of the focus areas identified in the prior year’s effectiveness review.
In July 2015 the board took the important step of appointing a new
CFO. Following a selection process involving internal and external
candidates, we were pleased to appoint Domenic De Lorenzo as a
director and as our Chief Financial Officer following the conclusion
of the 2015 annual general meeting. We also welcomed Dave Beran
to the board, who was nominated by Altria to replace Howard Willard.
The renewal of the board continued, with the appointment of
Javier Ferrán as a non-executive director at our last annual general
meeting. We are pleased to offer our congratulations to Javier on his
appointment as non-executive director and chairman-designate of
Diageo, though since Diageo is a competitor he will step down from
our board at our upcoming annual general meeting, before taking up
this appointment. We wish him well.
Jan du Plessis
Chairman
10 June 2016
Jan du Plessis
Chairman
The most important task for
the board in the year was our
consideration and recommendation
of the takeover offer from
AB InBev. Nevertheless, the board
remains focused on the need
for our business to continue to
perform strongly and to pursue
its strategic objectives until the
transaction is completed. Until
that time, the board’s duties in
relation to governance and
leadership are unaffected.”
58 SABMiller plc Annual Report 2016
Leadership
Board of directors
We currently have 15 directors: our Chairman (Jan du Plessis); seven independent non-executive directors; five non-executive directors whom
we do not consider to be independent; and two executive directors (Alan Clark, the Chief Executive and Domenic De Lorenzo, the Chief
Financial Officer). The independent non-executive directors include Guy Elliott, who is our Deputy Chairman and Senior Independent Director.
Short biographies of each of the directors are on pages 54 and 55.
Our governance framework
The size and certain aspects of the composition of our board and our audit, nomination and corporate accountability and risk assurance
committees continue to be determined in part by the terms of our relationship agreements with our two largest shareholders, Altria Group, Inc.
(Altria) and BevCo Ltd (a holding company of the Santo Domingo Group). Both agreements have been approved by SABMiller’s shareholders.
Our agreement with Altria limits the size of the board to a maximum of 15 directors, of whom no more than two are to be executive directors,
up to three are to be non-executive directors nominated by Altria, up to two are to be non-executive directors nominated by BevCo, and
up to eight (including the chairman) are to be non-executive directors nominated by the board. Our agreement with BevCo allows it to nominate
up to two non-executive directors for appointment to the board.
Altria and BevCo have each exercised their right under their respective agreements to nominate one director for appointment to the nomination
committee, being Geoff Bible and Alejandro Santo Domingo respectively. Both Altria and BevCo have the right to nominate directors for
appointment to the corporate accountability and risk assurance committee (CARAC), which Altria has exercised (nominating Geoff Bible)
but BevCo has not. Altria has also exercised its right to nominate one director (Dinyar Devitre) for appointment to the audit committee.
Board of directors
Board Committees
Remuneration committee
Members: Four independent
non-executive directors
Role: Determines the reward strategy
for the executive directors and senior
management, to align their interests
with those of the shareholders
Audit committee
Members: Four independent non-executive
directors and one non-executive director
nominated by Altria
Role: Monitors the integrity of the group’s
financial statements and the effectiveness
of the external and internal auditors
Nomination committee
Members: The Chairman and five non-
executive directors, three independent and
one each nominated by Altria and BevCo
Role: Ensures the board and senior
management team have the appropriate
skills, knowledge and experience to operate
effectively, and to develop and deliver the
group’s strategy
Corporate accountability and risk assurance committee
Members: The Chairman, Chief Executive and four non-executive
directors
Role: Assists the board in the discharge of its responsibilities in relation
to corporate accountability, including sustainable development,
corporate social responsibility and corporate social investment.
Disclosure committee
Members: The Chairman, Deputy Chairman, Chief Executive,
Chief Financial Officer, one other non-executive director, and the General
Counsel, or the Group Company Secretary
Role: Assists the board in ensuring compliance with the Disclosure and
Transparency Rules and the Listing Rules
Management committee
Executive committee
Members: Chief Executive, Chief Financial Officer, four regional managing directors and four directors of key group functions
Role: Assists the Chief Executive with the development and implementation of the group’s strategy, the management of the business
and the discharge of responsibilities delegated by the board
Chairman
Responsible for leadership
of the board and presiding
over its meetings
Chief Executive
Responsible for the day to day
management of the business in
accordance with the strategy
approved by the board
Chief Financial Officer
Responsible for managing all
aspects of the finance function,
providing strategic input to the
board and executive committee,
and supporting the Chief
Executive in the delivery of the
group’s strategy
Seven independent
non-executive directors
Five other non-executive
directors
Nominated by our two
major shareholders
GOVERNANCEGOVERNANCE
59SABMiller plc Annual Report 2016
GOVERNANCE |Corporate governance continued
Our application of the UK Corporate Governance Code
The board applied all of the main principles and provisions of the Code throughout the year ended 31 March 2016, except in the
following respects:
i. Our audit committee did not consist solely of independent directors. Under our relationship agreement with Altria, as approved by the
shareholders in 2002 and 2005, Altria has the right to nominate a director to the audit committee, and has nominated Dinyar Devitre, who
the board does not consider to be an independent director for the purposes of the Code. The board nevertheless considers that the
composition of the audit committee remains appropriate, given Altria’s interest as the company’s largest shareholder. Dinyar Devitre is a
former Chief Financial Officer of Altria and the board considers that his experience and background in financial matters and his independence
from management mean that the effectiveness of our audit committee in discharging its functions is considerably enhanced and not
compromised by his membership.
ii. The Code recommends that the performance evaluation of the boards of FTSE 350 companies should be externally facilitated at least every
three years. In our 2015 annual report, we communicated that an externally facilitated performance evaluation would be undertaken early in
the tenure of our new Chairman, Jan du Plessis. In light of the expected transaction timetable for the takeover offer by AB InBev, the board
considered that it would have limited time to benefit from the findings of an externally facilitated effectiveness evaluation during its tenure. In
addition, an extensive external evaluation would have absorbed time and significant resources at precisely the time that the board needed to
focus its attention on the demands of the takeover offer. After careful consideration, the board took the decision not to conduct an external
effectiveness evaluation in the year under review, and instead to conduct such an evaluation internally. If for any reason the takeover offer does
not proceed to completion, the board intends then to undertake an externally facilitated effectiveness evaluation. A report on the assessment
of the effectiveness of the board and its committees led by our Deputy Chairman Guy Elliott is set out on page 66 of this report.
iii. Under the Code, the company is required to put its external audit contract out to tender at least every 10 years. The company has not
tendered its external audit contract within the last 10 years. In the ordinary course, we would have conducted an audit tender during the
2016 calendar year as communicated in our 2015 annual report. In light of the exceptional circumstances of the takeover offer by AB InBev,
the audit committee decided to defer the audit tender. The audit committee noted that an audit tender during the offer period would be
inappropriate. If for any reason the takeover offer were not to proceed to completion, the audit committee intends then to conduct a
tender process.
iv. The Code recommends that a majority of members of the nomination committee should be independent non-executive directors. Following
his appointment as Chairman of the company in July, Jan du Plessis, a member of the nomination committee and an independent non-
executive director on his appointment to the board on 1 September 2014, was required to be disregarded in the determination of whether
the majority of members of the committee were independent. Between 23 July 2015 and 24 September 2015 the nomination committee
comprised Jan du Plessis, two non-executives directors considered to be independent and two non-executives not considered to be
independent, and was therefore not compliant (although the committee did not meet during this period). On 24 September 2015 Lesley Knox,
an independent non-executive director, was appointed to the committee, at which point the committee met the membership
recommendations of the Code.
v. One director, Mark Armour, was unable to attend the 2015 annual general meeting as he was attending a family funeral.
60 SABMiller plc Annual Report 2016
Board meetings and attendance
Board and committee meetings are held in an atmosphere of direct, robust and constructive challenge and debate among board and
committee members. During the year we held seven regularly scheduled board meetings, as well as five specially convened meetings held on
short notice to consider AB InBev’s proposals which led to the announcement on 11 November of the recommendation of AB InBev’s offer for
SABMiller. Individual directors’ attendance at board and committee meetings and at the annual general meeting is set out in the table below.
In the few instances when directors could not attend a board or committee meeting, any comments which they had on the matters to be
considered were given in advance to the chairman of the meeting, to the General Counsel, or to the Group Company Secretary.
Directors’ attendance (1 April 2015 to 31 March 2016)
Board Audit Remuneration CARAC
Independent Attended Possible Attended Possible Attended Possible Attended Possible
Attended
AGM
P J Manser N/A 3 3 1 1 Y
J P Du Plessis N/A 12 12 1 1 Y
A J Clark N/A 12 12 2 2 Y
D De Lorenzo N/A 10 10 N/A
M H Armour Yes 11 12 4 4 4 4 N
D R Beran No 10 10 Y
G C Bible No 11 12 2 2 Y
D S Devitre No 10 12 4 4 Y
G R Elliott Yes 12 12 4 4 4 4 Y
J F Ferrán Yes 10 10 3 3 Y
L M S Knox Yes 12 12 4 4 4 4 Y
T A Manuel Yes 11 12 1 1 Y
J A Manzoni Yes 2 3 1 1 1 1 Y
D F Moyo Yes 11 12 2 2 Y
C A Pérez Dávila No 11 12 Y
A Santo Domingo Dávila No 12 12 Y
H A Weir Yes 12 12 4 4 2 2 Y
H A Willard No 3 3 Y
– The nomination committee did not meet during the year under review.
– Mark Armour was unable to attend the July 2015 annual general meeting and associated board meeting as he was attending a family funeral.
– Geoff Bible, Dinyar Devitre, John Manzoni and Carlos Pérez were unable to attend the board meeting in June, which was called at short notice to consider a possible transaction.
– Trevor Manuel and Dambisa Moyo were each unable to attend one board meeting in October, which was called at short notice to consider the AB InBev transaction.
– Dinny Devitre was unable to attend the board meeting in January due to a pre-existing business commitment.
– Domenic De Lorenzo was appointed as a director after the conclusion of the annual general meeting.
GOVERNANCEGOVERNANCE
61SABMiller plc Annual Report 2016
GOVERNANCE |Corporate governance continued
The work of the board
The board brings leadership to the group and sets strategic objectives,
determines investment policies, agrees on performance criteria, and
delegates to management the detailed planning and implementation
of those objectives and policies in accordance with appropriate risk
parameters determined by the board. The board monitors
achievement against objectives and compliance with policies by
holding management accountable for its activities through monthly
and quarterly performance reporting and budget updates. The board
receives regular briefings from the Chief Executive, the Chief Financial
Officer, the General Counsel and Corporate Affairs Director, and from
the Group Company Secretary on legal, regulatory and corporate
governance matters. Other members of our executive committee
make regular presentations to the board, enabling directors to explore
and interrogate specific issues and developments in greater detail. In
the ordinary course, the board also schedules visits to our regions,
normally holding two meetings a year outside the UK, allowing
directors the opportunity to meet in-country management. The
demands of the AB InBev takeover offer were such that it was
necessary to defer executive committee member presentations and
that it was not feasible or appropriate to undertake scheduled regional
visits to Europe and Africa in September and January, respectively. At
the end of each board meeting, the non-executive directors meet
without management present.
Matters reserved for the board
There is a schedule of matters which are dealt with exclusively
by the board. These include approval of financial statements; the
group’s business strategy; the annual capital expenditure plan;
major capital projects; significant changes to the group’s management
and control structure; material investments or disposals; risk
management strategy; sustainability and environmental policies;
and treasury policies.
Each standing board committee has specific written terms of
reference issued by the board and adopted in committee. The terms
of reference of the audit, remuneration and nomination committees are
available on our website. All committee chairmen report orally on the
proceedings of their committees at the next meeting of the board,
and the minutes of all board committee meetings are circulated to all
board members.
The membership and work of these committees are described on the
following pages. From time to time other ad hoc committees may be
constituted for specific projects or tasks.
Conflicts of interest
Our directors are required to avoid situations where they have, or can
have, a direct or indirect interest that conflicts, or may conflict, with the
company’s interests. As permitted by the Companies Act 2006, the
articles of association of the company allow the board to authorise
potential conflicts of interest that may arise and to impose such limits
or conditions as it thinks fit. Procedures are in place for the disclosure
by directors of any potential conflicts and for the appropriate
authorisation to be sought if a conflict arises.
We are confident that our procedures concerning actual and potential
conflicts of interest continue to operate effectively.
From press speculation to a recommended offer
The work of the SABMiller board
Following press speculation, on 16 September 2015 SABMiller
announced that it had been informed by AB InBev that it intended to
make a proposal to acquire SABMiller. At that time no proposal had
been received and the board of SABMiller had no further details about
the terms of any such proposal.
Under the UK Takeover Code that announcement triggered a 28 day
‘put up or shut up’ (PUSU) deadline for AB InBev to announce a firm
intention to make an offer for SABMiller or to announce that it would
not be making an offer, and started an intense period of work for the
SABMiller board.
As a result of the approach and the PUSU deadline, the board
rescheduled planned strategy meetings and a market visit in order to
focus on the possible transaction. The PUSU deadline was extended
three times prior to the announcement of a recommended acquisition
on 11 November 2015. During the eight week period from the first
announcement on 16 September and 11 November:
– the board received detailed briefings on Takeover Code issues and
directors’ responsibilities;
– five board meetings were held, with near 100% attendance at
meetings by directors;
– the scheduled SABMiller trading update in October was brought
forward by 10 days;
– new efficiency and cost savings targets were announced and
reported on;
– the board received and debated rigorous and detailed presentations
on the stand-alone value and prospects of SABMiller;
– a large number of board, shareholder, analyst, management and
adviser calls and briefings were held; and
– the recommended offer was negotiated with AB InBev and
approved by the board, after AB InBev raised its initial cash offer of
£38 per share six times to the final offer of £44 per share. The
agreed terms which were recommended by the board included an
undertaking by AB InBev to use its best efforts to secure regulatory
clearances, and a break fee of US$3 billion payable to the company
in certain circumstances.
Throughout the period the board was advised by the General Counsel
and by the Group Company Secretary, and by experienced external
investment banking and legal advisers.
62 SABMiller plc Annual Report 2016
The board’s committees and the executive committee
The board currently operates five committees. The composition of
each of the audit and disclosure committees is set out below, as is
that of the executive committee. The composition and work of the
nomination, remuneration and corporate accountability and risk
assurance committees are described on pages 64 and 65, and the
work of the audit committee is fully described on pages 70 to 73.
The audit committee
During the year under review the audit committee was chaired by
Mark Armour, who first joined the committee on 1 May 2010 and
has been its chairman since 6 June 2013.
Dinyar Devitre, Guy Elliott, Lesley Knox and Helen Weir also served on
the committee throughout the year. Dinyar Devitre has been a member
of the committee since 16 May 2007, Guy Elliott since 25 July 2013
and Lesley Knox and Helen Weir since 19 May 2011. The board is
satisfied that Mark Armour, Dinyar Devitre, Guy Elliott, Lesley Knox
and Helen Weir all have recent and relevant financial experience.
Biographical information concerning Mark Armour and the other
members of the committee is set out on pages 54 and 55.
Further details of the work and responsibilities of the audit committee
are included in the audit committee report on pages 70 to 73.
The disclosure committee
The disclosure committee consists of the Chairman, the Deputy
Chairman, the Chief Executive, the Chief Financial Officer, any one
other non-executive director, the General Counsel or the Group
Company Secretary. The function of the disclosure committee is to
meet as and when required to assist the board in ensuring compliance
with the company’s obligations under the UK’s Disclosure and
Transparency Rules and the Listing Rules, as guided by the General
Counsel and by the Group Company Secretary. It also aims to ensure
that the channels of communication between executive committee
members, the disclosure committee, the Group Company Secretary’s
office and the investor relations team are clear, and can enable any
decision regarding potential inside information to be escalated rapidly
to the disclosure committee, key advisers and the board.
The executive committee (excom)
The board delegates responsibility for proposing and implementing
the group’s strategy and for managing the group to the Chief
Executive, Alan Clark, who is supported by excom, which he chairs.
Excom members are appointed by Alan Clark, after consultation
with the board. The other members of excom are the Chief Financial
Officer, regional managing directors and directors of key group
functions (legal and corporate affairs, marketing, integrated supply,
and human resources). Excom’s purpose is to support the Chief
Executive in carrying out the duties delegated to him by the board
and, in that context, it executes the strategy and budget approved by
the board and, through the Chief Executive and the Chief Financial
Officer, reports on these matters to the board.
The excom also ensures that effective internal controls are in place
and functioning, and that there is an effective risk management
process in operation throughout the group. The audit committee
reviews the risk management processes put in place by excom and
the board reviews the group’s significant risks, following excom’s
review of those risks.
Roles and responsibilities
Roles of the Chairman, Chief Executive, Deputy Chairman
and Senior Independent Director
The Chairman and Chief Executive have separate roles and the
division of responsibilities between them is set out in a written
statement of responsibilities approved by the board.
The Senior Independent Director serves as an additional contact
point for shareholders. He is also available to fellow non-executive
directors, either individually or collectively, to discuss any matters
of concern in a forum that does not include the Chairman, the
executive directors or other members of the management team.
The statement of responsibilities of the Deputy Chairman and Senior
Independent Director was last revised following Guy Elliott’s
appointment and was approved by the board in its meeting in March
2014. Our Chairman and Deputy Chairman are both available to
consult with shareholders throughout the year. The board is kept
informed of the views of shareholders through regular updates from
the Chairman, the Deputy Chairman, the Chief Executive, the Chief
Financial Officer, the General Counsel and Corporate Affairs Director,
and the Group Company Secretary, as well as through regular
circulation to the board and the inclusion in the board papers of
reports on comments from, and exchanges with, shareholders,
investor bodies and analysts.
The roles of executive and non-executive directors
Our executive directors are responsible for proposing strategy and
for making and implementing operational and strategic decisions.
Our non-executive directors complement the skills and experience
of the executive directors. They bring independent judgement and
constructive challenge to the boardroom and contribute to the
formulation of strategy, policy and decision-making through their
collective wealth of knowledge and experience of other businesses
and sectors.
The Group Company Secretary
The Group Company Secretary acts as secretary to the board and
its committees and attended all meetings during the year under
review. The current Group Company Secretary, Stephen Shapiro,
was appointed in November 2014, having served as Deputy
Company Secretary from 2002. He is also Deputy General Counsel.
GOVERNANCEGOVERNANCE
63SABMiller plc Annual Report 2016
Jan du Plessis
Chairman of the nomination committee
Nomination committee report
For the first part of the year, the nomination committee was
chaired by John Manser until he retired as chairman and as a
member of the nomination committee on 23 July 2015, and
Jan du Plessis was appointed as chairman of the committee.
Jan du Plessis, Geoff Bible, Guy Elliott, Alejandro Santo Domingo
and Helen Weir served as members throughout the year. John
Manzoni served on the committee until his retirement from the
board on 23 July 2015. Lesley Knox was appointed to the
committee on 24 September 2015. The committee considers the
composition of the board and its committees, and the retirement,
appointment and replacement of directors, and makes appropriate
recommendations to the board. In doing so it considers diversity
in terms of age, experience, gender and balance of skills on the
board. Currently three out of seven of the company’s independent
non-executive directors are women, and the board comprises
members from diverse backgrounds and nationalities.
The nomination and appointment of Trevor Manuel, and the
nomination of Javier Ferrán for appointment at the annual general
meeting in July 2015, were concluded in the last quarter of the
prior year and were overseen by the nomination committee.
These two appointments concluded a sustained period of
progressive renewal, with longer-standing directors standing
down and new directors being appointed. The longest-serving
independent director immediately following the annual general
meeting in July 2015 had six years’ service.
The board and the nomination committee are satisfied that the
board is well balanced and that the nomination committee has
effectively discharged its mandate in this regard.
The process of selecting a new chief financial officer, resulting
in the appointment of Domenic De Lorenzo, was managed
directly by the board.
Where vacancies arise, the committee prepares a description
of the role and capabilities required for the appointment.
Appropriate succession plans for the non-executive directors,
executive directors, and senior management are also kept
under close review.
Where non-executive vacancies arise, the committee may
use external consultants to identify suitable candidates for the
board to consider. A rigorous selection process, led by search
consultants JCA Associates under the guidance of the nomination
committee, led to the appointment of Javier Ferrán, and an
internal and external search, also assisted by JCA Associates,
resulted in the appointment of Domenic De Lorenzo as Chief
Financial Officer. JCA Associates has no other connection
with the company.
Chairman 1
Executive directors 2
Independent non-executives 7
Nominated non-executives 5
0–2 years 5
2–4 years 2
4–6 years 3
6+ years 5
Tenure of the board as at 31 March 2016
Balance of the board as at 31 March 2016
GOVERNANCE |Corporate governance continued
64 SABMiller plc Annual Report 2016
The remuneration committee The corporate accountability and risk assurance
committee (CARAC)
Lesley Knox
Chairman of the remuneration committee
Dambisa Moyo
Chairman of CARAC
During the year, the remuneration committee consisted entirely
of independent directors: Lesley Knox (chairman), Mark Armour,
Guy Elliott and Javier Ferrán (replacing John Manzoni, who retired
from the board in July 2015). The committee is responsible for the
assessment and approval of remuneration strategy for the group,
for the operation of the company’s share-based incentive plans and
for reviewing and approving short-term and long-term remuneration
for executive directors and executive committee members.
The remuneration committee has implemented a strategy of
ensuring that employees and executives are rewarded for their
contribution to the group’s operating and financial performance
at levels which take account of industry, market and country
benchmarks. To ensure that executive and company goals are
aligned, share incentives are considered critical elements of
executive incentive pay. During the year, the committee was
advised by Kepler Associates, which since June 2015 has been
part of the Mercer group, which also consults to the group on
pensions matters. Kepler Associates has no other connection
with the company, as consultants. Details of the company’s
remuneration policy and the work of the remuneration committee
during the year, are in the directors’ remuneration report on pages
74 to 92.
Dambisa Moyo chaired the committee throughout the year.
Geoff Bible, Alan Clark and Helen Weir served as members
for the entire period. John Manser and John Manzoni retired from
the committee on 23 July 2015, and Jan du Plessis and Trevor
Manuel joined the committee on 24 September 2015.
The committee’s objective is to assist the board in the discharge
of its responsibilities in relation to the corporate accountability,
including sustainable development, corporate social responsibility
and corporate social investment. More details of the committee’s
activities are in the sustainable development section of this report
and in our separate sustainable development summary report,
which is available on our website.
The CARAC met twice in the year, in May 2015 and again in March
2016 (this meeting had been scheduled for November 2015, but
had to be postponed due to the AB InBev transaction).
GOVERNANCEGOVERNANCE
65SABMiller plc Annual Report 2016
Effectiveness
Composition of the board
The board continues to believe that its overall composition remains
appropriate, particularly in regard to the independence of character
and integrity of all our directors, and the experience and skills they
bring to their duties. It also believes that there is an appropriate
balance of skills, collective experience, independence, background,
knowledge and gender among our non-executive directors to enable
them to discharge their duties and responsibilities effectively.
Independence
The board considers seven directors – Mark Armour, Guy Elliott,
Javier Ferrán, Lesley Knox, Trevor Manuel, Dambisa Moyo and Helen
Weir – to be independent for the purposes of the Code. The board
considers five non-executive directors not to be independent for the
purposes of the Code: Geoff Bible, Dinyar Devitre and Dave Beran,
as they are nominees of Altria, the company’s largest shareholder;
and Alejandro Santo Domingo and Carlos Pérez, as they are
nominees of Bevco, the company’s second largest shareholder.
Under the Code, a chairman is not considered to be an independent
director but is required to be independent upon appointment. Jan du
Plessis was appointed as an independent non-executive director in
September 2014 before he became Chairman in July 2015.
Board, committee and director performance evaluation
Performance evaluations are carried out each year and are reported in
the subsequent annual report. The board had previously intended to
conduct an externally facilitated performance evaluation early in the
tenure of our new Chairman, Jan du Plessis. However, as reported
above, an extensive evaluation process would have absorbed
significant board time and resources precisely when the board and
management needed to focus all of their time and resources on the
AB InBev takeover offer, and the takeover offer would have meant that
the board would have had limited time to benefit from the findings of
an external evaluation. We have therefore conducted an internal
assessment of the board and its committees, led by our Deputy
Chairman Guy Elliott, and report more fully on this evaluation below.
If for any reason the takeover offer does not proceed to completion,
the board intends then to conduct an externally facilitated evaluation.
Effectiveness assessments were conducted in respect of the board
and the audit and remuneration committees, and the CARAC, and
the performance of the Chairman, individual directors and the Group
Company Secretary was also evaluated. For the board and relevant
committees, questionnaires were prepared by the Group Company
Secretary, and were considered by the respective board and
committee members. The views of the members of the respective
bodies were canvassed in full and frank discussion. The Chairman
and Deputy Chairman considered and reviewed the performance
of individual directors and of the Group Company Secretary, while
the board, led by the Deputy Chairman (the Chairman having recused
himself), reviewed the performance of the Chairman. The effectiveness
assessments concluded that the board and its committees were
operating effectively, and that the performance of the Chairman,
individual directors and the Group Company Secretary was in each
case satisfactory.
The most important task of the board in the year under review was
its consideration of the AB InBev offer. The Chairman’s leadership
of the board throughout the negotiation of the offer, in particular, was
considered by the board (in his absence) to have been exemplary.
Notwithstanding the intense focus required on the offer from AB InBev,
good progress was made in addressing each of the areas identified in
the prior year review that could benefit from particular focus. Board
agendas were further refined to facilitate focus on these matters, the
incoming Chief Financial Officer introduced enhanced reporting on
financial, operational and brand performance and the CARAC has
enhanced its systematic oversight of the group’s strategic focus on
key licence to trade risks faced by the company.
Information and training
Our Group Company Secretary is responsible for advising the board,
through the Chairman, on matters of corporate governance. The
board and its committees are provided with full and timely information,
including detailed financial information, to enable directors to
discharge their responsibilities, and for the committees to undertake
their duties. All directors have access to the advice of the Group
Company Secretary. Independent professional advice is also available
to directors in appropriate circumstances, at the company’s expense.
During the year ended 31 March 2016 none of the directors sought
independent external advice through the company.
When directors join the board, tailored induction programmes are
arranged which involve industry specific training and include visits
to the group’s businesses and, as appropriate, meetings with senior
management. New directors are also briefed on their duties to the
company and their obligations as directors of a listed company,
on risk management activities at head office and on relevant company
policies and governance related matters. The planned induction
of new directors Javier Ferrán, Dave Beran, and Domenic De Lorenzo
was tailored appropriately to take account of the AB InBev offer.
The company is committed to the continuing development of directors
to help them build on their expertise and develop an ever deeper
understanding of the business, and of the markets in which group
companies operate. Members of board committees are encouraged
to attend internal and external briefings and courses on aspects of
their respective committee specialisms. Regular updates on relevant
legal, regulatory, corporate governance and technical developments
are presented to committee members at each meeting and, as
appropriate, to the full board. The Chairman considers the training
and development needs of the board and discusses these with the
respective directors as necessary.
Outside appointments
Non-executive directors, including the Chairman, may serve on other
boards provided that they continue to demonstrate the requisite
commitment to discharge their duties effectively to SABMiller. The
nomination committee keeps under review the extent of directors’
other interests to ensure that their external commitments do not
compromise the effectiveness of the board and do not give rise to
conflicts of interest. The board is satisfied that the Chairman and all
of the non-executive directors commit sufficient time to their duties
as directors of the company. The Chairman and the non-executive
directors standing for re-election have confirmed that they have
sufficient time to fulfil their respective obligations to the company.
The board firmly believes in the benefit to the group of our executive
directors and members of the executive committee accepting
non-executive directorships of other companies to widen their
experience and knowledge. Accordingly, subject to the agreement of
the board, executive directors and executive committee members are
permitted to accept external non-executive board appointments and
to retain any fees from those appointments.
GOVERNANCE |Corporate governance continued
66 SABMiller plc Annual Report 2016
During the year under review none of the executive directors held any
such appointment. Sue Clark, an executive committee member, was
appointed on 29 February 2016 as a non-executive director of Britvic
plc, a company listed on the London Stock Exchange. Of the other
executive committee members, Mark Bowman is a non-executive
director of Tiger Brands Limited, a company listed on the
Johannesburg Stock Exchange, and Ari Mervis is a director of the
Melbourne Business School.
Retirement of directors
The company’s articles of association require that new directors are
subject to election at the first annual general meeting following their
appointment, and that directors are subject to retirement and
re-election by shareholders every three years. The re-appointment
of non-executive directors is not automatic. However, the board has
determined that all directors will stand for re-election annually.
Independent non-executive directors who have served for nine years
may be asked to stand for re-election but only if the board remains
satisfied both with their performance and that nine years’ continuous
service has not compromised their continuing independence.
Accountability
Risk and the board of directors
The directors are ultimately responsible for corporate reporting,
risk management and internal control and for reviewing effectiveness.
There is a regular schedule for the board to consider and carry out
a robust assessment of the group’s principal risks including those
which would threaten its business model, future performance,
solvency or liquidity and to review how these risks are being
managed together with the mitigating actions. The principal risks
and uncertainties facing the group are set out on pages 16 and 17.
These are regularly reviewed by the board, and the principal risks
facing the group have been robustly assessed by the board.
The risk management system is designed to manage, rather than
eliminate, the risk of failure to achieve business objectives. There is
a continuous process in place for identifying, assessing, managing,
monitoring and reporting on the significant risks faced by individual
group companies and by the group as a whole. This process has
been in place for the year under review and up to the approval of the
annual report and accounts.
The Financial Reporting Council updated the provisions of the Code
on risk management and internal control in 2014. The revised Code,
and new guidance under it apply to SABMiller in respect of the year
under review and the group’s risk management systems has been
reviewed to ensure compliance with the revised Code and guidance.
The group’s systems of risk management comply with the revised
Code and guidance.
Audit committee
A description of the composition of the audit committee during
the year is included in the section dealing with the board and its
committees. Information on the responsibilities and work of the audit
committee is set out in the audit committee report on pages 70 to 73
and includes its role in overseeing the risk management process
implemented by management and advising the board in this regard.
Executive committee
Excom has specific responsibility for implementing the group’s
system of risk management and views the careful and appropriate
management of risk as a key management role. Excom reviews our
significant risks and subsequently reports to the board on material
changes and the associated mitigating actions. Reviews of the
effectiveness of the risk management system, and of the group’s
principal risks, were carried out by excom in October and December
2015 and in March 2016 and the summary outputs were reported to
the audit committee and board respectively.
Enterprise-wide risk management
Managing business risk to deliver opportunities is a key element of all
our business activities, and is undertaken using a practical and flexible
framework which provides a consistent and sustained approach to
risk evaluation. Business risks, which may be strategic, operational,
financial or environmental, or concern the group’s reputation, are
understood and visible. The business context determines in each
situation the level of acceptable risk and controls.
Key features of the group’s system of risk
management remain:
– group statements on strategic priorities, ethics, purpose
and values;
– clear business objectives and business principles;
– an established risk policy;
– a continuous process for identification and evaluation of
significant risks to the achievement of business objectives;
– management processes to mitigate significant risks to an
acceptable level;
– continuing monitoring of significant risks and internal and
external environmental factors that may change our risk profile;
and
– a regular review of both the type and amount of external
insurance purchased, bearing in mind the availability of cover,
its cost and the likelihood and magnitude of the risks involved.
In addition to excom’s regular reports to the board on key risks,
there is a process of regular reporting to the board through the audit
committee on the status of the risk management process. Strategic
planning, internal audit and other risk control specialist processes
are integrated into line management’s risk processes and simplified
risk reporting.
Key reports include those that identify, assess and monitor strategic,
financial, reputational and operational risks in each country, division,
group function and on a group basis.
Internal control
The FRC Guidance recommends internal control practices for UK
listed companies to assist them in assessing the application of the
Code’s principles and compliance with the Code’s provisions with
regard to internal control.
Our systems of internal control are designed and operated to support
the identification, evaluation and management of risks affecting the
group. These include controls in relation to the financial reporting
process and the preparation of consolidated accounts, and extend
across all areas of operations. They are subject to continuous review
as circumstances change and new risks emerge.
GOVERNANCEGOVERNANCE
67SABMiller plc Annual Report 2016
Key features of the systems of internal control are:
– the risk management system described on page 67;
– written policies and procedures within our businesses;
– clearly defined lines of accountability and delegations of authority;
– management of operating risk by using appropriate infrastructure
(including regional hubs and specialist group functions), controls,
systems and codified ways of working (including standard
project methodology) and codified people management routines
throughout the business;
– business continuity planning, including preventative and
contingency measures, back-up capabilities and the purchase
of insurance;
– maintenance of a state of preparedness towards compliance
with the requirements of Section 404 of the US Sarbanes-Oxley
Act through the identification and testing of key financial controls
under our Internal Financial Control (IFC) programme. This is a
voluntary initiative, which strengthens internal control systems
and processes within the group;
– risk management policies and procedures including segregation
of duties, transaction authorisation, monitoring, financial and
managerial review and comprehensive reporting and analysis
against approved standards and budgets;
– a treasury operating framework and group treasury team,
accountable for all treasury activities, which establishes policies
and manages liquidity and financial risks, including foreign
exchange, interest rate and counterparty exposures, and
incorporates group and regional treasury committees that
monitor these activities and compliance with the policies.
Treasury policies, risk limits and monitoring procedures are
reviewed regularly by the audit committee on behalf of the board;
– a group tax policy and tax operating framework which forms the
basis of tax governance across the group and is managed by
our group tax function which monitors tax risk and implements
strategies and procedures to control it, and which is also
reviewed regularly by the audit committee on behalf of the board.
Assurance on systems of internal control and their
effectiveness is obtained through:
– an established, regular routine of management reviews and
performance reviews by the Chief Executive and excom, with
half-yearly reporting to the board;
– reviews and testing of key financial controls;
– internal audit reviews including programme assurance for large
change projects;
– testing of certain aspects of the internal financial control systems
by the external auditors during the course of their statutory
examinations and regular reports to the audit committee by the
internal and external auditors;
– our regional and group function finance, control and assurance
committees consider the results of these reviews within each
region and group function twice a year, together with feedback
from country audit committees, to confirm that controls are
functioning and to ensure that any material breakdowns and
remedial actions have been reported to the appropriate boards
of directors; and
– in relation to our associated undertakings and joint ventures,
these matters are reviewed at the level of the associates’ or joint
ventures’ boards or equivalent governing committees.
At the half year and at the year end the members of regional and
country business executive committees, each of our functional
directors (legal and corporate affairs; marketing; integrated supply;
and human resources), each of the direct reports to the Chief Financial
Officer (finance and control; internal audit; corporate finance and
strategy; tax; treasury; and investor relations), and the head of our
procurement and global business services units (including information
technology) are required to submit to the Group Company Secretary
on behalf of the board formal letters of representation on compliance
with internal controls and key policies, including the group’s Code of
Business Conduct and Ethics and Anti-Bribery Policy. These bi-annual
letters also require the notification of continuing or potential significant
financial, regulatory, environmental or other exposures.
These letters form the subject of reports to the audit committee, and
cover all subsidiary companies, as well as MillerCoors LLC. Certain of
our executive directors and executive committee members sit on the
boards of MillerCoors LLC and of relevant holding companies within
major associates such as CR Snow, Anadolu Efes and Castel.
Directors and members of the executive committee also make annual
written declarations of interests and are obliged to report without delay
any potential or actual conflicts of interest which may arise.
Taking account of the information on principal risks and uncertainties
provided on pages 16 and 17, and the ongoing work of the audit
committee in monitoring the risk management and internal control
systems on behalf of the board for whom the committee provides
regular updates as noted on page 67, the board:
– is satisfied that it has carried out a robust assessment of the
principal risks facing the company including those which would
threaten its business model, future performance, solvency and
liquidity; and
– has reviewed the effectiveness of the risk management and internal
control systems including all material financial, operational and
compliance controls (including those relating to the financial
reporting process) and no significant failings or weaknesses were
identified in the context of the group as a whole.
In the review of the effectiveness of the risk management and internal
control systems the board also took into account:
– the bi-annual review of significant risks, including of key mitigating
actions;
– regular business reviews completed through the year;
– matters arising from its oversight of tax and treasury matters;
– its review and assessment of the activities of internal audit and the
update of items arising from the previous external assessment of its
effectiveness;
– the outcome of the regional finance and control assurance meetings
and the IFC programme;
– the outcome of the bi-annual letters of representation process; and
– the observations of the external auditors.
GOVERNANCE |Corporate governance continued
68 SABMiller plc Annual Report 2016
Internal audit
Our global internal audit function consists of the group internal
audit team, led by the Chief Internal Auditor, plus regional and country
audit functions that operate in each of the group’s principal areas
of business. The regional and country functions are centrally directed
by the group internal audit team. The country internal audit functions
are jointly accountable to local senior finance management and
regional heads of internal audit. They also have direct access and
accountability to local audit committees and the Chief Internal Auditor.
Internal audit reviews, all of which are risk-based and include
provision of assurance over financial, operational, IT and
transformation programme activities, are performed by teams of
appropriately qualified and experienced employees. Third parties may
be engaged to support audit work as appropriate. The Chief Internal
Auditor, who reports jointly to the audit committee and the Chief
Financial Officer, has direct right of access to, and regular meetings
with, the audit committee chairman and prepares formal reports for
each audit committee meeting on the consolidated activities and key
findings of the global internal audit function. The audit committee also
has unrestricted access to all internal audit reports, should it wish
to review them.
Our global internal audit function uses a standardised group-wide
internal audit methodology which is in compliance with the
International Standards for the Professional Practice of Internal
Auditing of the Institute of Internal Auditors. The function operates
a formal global quality assurance and effectiveness programme.
An annual process gathers feedback against specific performance
criteria from a broad range of executive management at the group,
regional and country levels and from certain board members. This
process, supplemented by results from the function’s own quality
assurance reviews, provides a basis for the annual review of the
effectiveness of the global internal audit function (coordinated by
the Group Company Secretary) and results in a report to the audit
committee to support the committee’s formal annual assessment
of the effectiveness of internal audit. In addition, a periodic review
of internal audit is undertaken, most recently in 2014, by an
independent external consultant in accordance with the guidelines
of the Institute of Internal Auditors. The audit committee has
satisfied itself that adequate, objective internal audit assurance
standards and procedures exist within the group.
The internal audit function is responsible for facilitating the risk
management and reporting processes across the group. It also
provides assurance on the effectiveness of the process to excom,
the audit committee and the board.
Whistleblowing measures
The group whistleblowing arrangements provide global coverage
for employees and others wishing to raise concerns freely, in local
languages. All our employees have the opportunity to make
confidential disclosures about suspected impropriety or wrongdoing.
No action or retaliation is permitted against any employee making a
good faith report about an actual or suspected violation of SABMiller
policy. Country or regional ethics committees, the Group Company
Secretary, or the General Counsel and Corporate Affairs Director, in
consultation with the Chief Internal Auditor if appropriate, decide on
the method and level of investigation. The audit committee reviews the
group’s whistleblowing arrangements each year to assess whether
they remain effective, is notified of all material disclosures made and
receives reports on the results of investigations and actions taken.
The audit committee has the power to request further information,
conduct its own inquiries or order additional action.
Relations with shareholders
All shareholders were encouraged to attend our annual general
meeting held in July 2015, which provided the opportunity to ask
questions of the board and chairmen of all board committees. At the
meeting, all resolutions were put to a vote on a poll, with the results
being published on the company’s website, and on the London and
Johannesburg stock exchange news services. As the geographic
spread of shareholders inevitably means that they cannot all attend a
meeting in the UK, a film and a full transcript of meeting proceedings
were published on the company’s website. Similar arrangements are
planned for the 2016 annual general meeting.
We maintain a dedicated investor relations function which reports
to the Chief Financial Officer. The investor relations team builds and
maintains long-term relationships with institutional investors and
analysts and, in partnership with our corporate and divisional
management teams and within the scope of regulation, gives
presentations on group performance and regional businesses and
strives to ensure that these are understood across the global equity
markets, including in one-to-one meetings with investors. Dialogue on
sustainable development and socially responsible investment matters
is primarily led by the General Counsel and Corporate Affairs Director
and by the Director of Sustainable Development, who have focused
on meetings with interested investors and stakeholders.
During June 2015, our 20 largest shareholders (in addition to those
represented on the board), and a number of other shareholders within
our 50 largest shareholders who had expressed a wish to engage
with the Chairman-elect, were invited to meet the Chairman-elect
and Group Company Secretary to discuss any governance or other
issues which they wished to raise, and the invitations were taken up
by many of them. These meetings were intended to provide our
major shareholders with the opportunity to meet and get to know
our incoming Chairman, and vice versa, and to discuss matters
relating to the group.
Following the announcement of AB InBev’s intention to make an
offer for SABMiller, we engaged with a large number of our major
shareholders to ascertain their perspectives on an offer and the
proposed terms, including the price and structure of the offer.
Lastly, institutional and shareholder comments on the annual report
are conveyed by the Group Company Secretary to the full board.
Stephen Shapiro
Group Company Secretary
For and on behalf of the board of SABMiller plc
10 June 2016
GOVERNANCEGOVERNANCE
69SABMiller plc Annual Report 2016
Audit committee report
GOVERNANCE |Audit committee report
Responsibilities
The committee’s main role and responsibilities are to assist the board
in fulfilling its responsibilities regarding:
– the integrity of SABMiller’s interim and full year financial statements
and reporting, including the appropriateness and consistent
application of accounting policies, the adequacy of related
disclosures, and compliance with relevant statutory and listing
requirements;
– risk management and internal controls, related compliance activities
and reporting, and the effectiveness of the internal audit function
and whistleblowing arrangements; and
– the scope, resources, performance and effectiveness of the
external auditors, including monitoring their independence
and objectivity.
The audit committee assists the board in fulfilling its oversight
responsibilities regarding in particular the company’s financial
and corporate reporting, risk management and internal controls,
and the independence and effectiveness of the external auditors.
This report sets out how it has discharged its responsibilities during
the year and, in relation to the financial statements, the significant
issues it considered and how these were addressed. The board is
required to ensure that the annual report is fair, balanced and
understandable, and the audit committee assists the board by
considering this. Following recent revisions to the UK Corporate
Governance Code, the board has included in the annual report a
statement on the group’s longer-term viability, and the committee
has supported the board by considering assumptions and
sensitivities in relation to it.
The work of the committee is far-ranging. Without attempting
to summarise it here, I would draw attention to the following:
In considering the integrity of financial reporting, we considered
three particularly significant areas of judgement in detail: the carrying
value of goodwill and investments in associates, provisioning for
uncertain tax positions, and items excluded from adjusted earnings.
In addition to the regular financial reporting of the company, we
focused on other financial information issued in relation to the
recommended offer for the company.
In risk management and internal controls, we noted the additional
emphasis on these matters in the recently revised UK Corporate
Governance Code and put additional focus on the processes that
support the board’s assessment of risk, the mitigating controls, and
the effectiveness of their operation. We also focused among other
matters on IT network and data security, anti-bribery and corruption
policies and compliance, fraud, whistleblowing arrangements, and
the cost and efficiency programme, and we reviewed the group’s
tax policies.
In relation to the external audit, the committee has agreed with our
external auditors to continue the tenure of the lead audit partner
for the current financial year ending 31 March 2017, which is one
year beyond the normal five year rotation period, in view of the
recommended offer for the company, the significant deal-related
activity and additional workloads and pressures on management.
This continuity, the committee believes, will best serve audit quality
and reduce risk. Also in view of the recommended offer, the
committee will not now hold the audit tender that was planned for
later this year for appointment for the financial year commencing
1 April 2017.
At the request of the board, the committee considers whether the
annual report is fair, balanced and understandable and whether it
provides the information necessary for shareholders to assess the
group’s position and performance, business model and strategy.
The committee has also supported the board by considering
assumptions and sensitivities in relation to the board’s statement
in the annual report on the group’s longer-term viability.
The committee reports to the board on its activities, identifying any
matters in respect of which it considers that action or improvement
is needed and making recommendations as to the steps to be taken.
Committee members, their relevant financial experience and the
attendance record are set out in the corporate governance report
on pages 61 and 63.
The committee’s terms of reference are reviewed annually and
are available on our website, www.sabmiller.com.
Mark Armour
Chairman of the audit committee
70 SABMiller plc Annual Report 2016
Committee meetings
The committee meets four times in the year. Meetings are attended
by the committee members and typically, by invitation, the Chairman,
Chief Executive, Chief Financial Officer, senior members of the group
finance team, General Counsel, Group Company Secretary, and Chief
Internal Auditor. Other non-executive directors have a standing
invitation to attend as observers. Other members of management are
invited to attend certain meetings in order to provide the committee
with greater insight into specific issues and developments. The audit
partners and senior members of the group audit team from our
external auditors, PwC, attend each meeting.
The committee receives and discusses regular written and oral reports
from the Chief Financial Officer, the Chief Internal Auditor, the General
Counsel, and the external auditors relating to matters falling within the
committee’s terms of reference. Reports are also received from time to
time by other members of management and other external assurance
providers in relation to specific topics addressed by the committee.
The committee meets separately at least twice each year with the
external auditors without management present and likewise at least
annually with the Chief Internal Auditor. The committee chairman has
separate meetings at least four times a year with the Chief Financial
Officer, the Chief Internal Auditor, and with the external auditors. He
also meets separately with the General Counsel, and with the Group
Company Secretary. The Chief Internal Auditor, the external auditors,
the General Counsel, and the Group Company Secretary have direct
access to the committee, primarily through the chairman, on any
matter that they regard as relevant to the fulfilment of the committee’s
responsibilities.
New members of the committee are briefed on matters relevant
to the responsibilities of the committee and meet a range of finance
management as part of their induction. Training is provided to
committee members on financial, regulatory and other compliance
matters through briefings presented by the external auditors, the
Group Company Secretary and/or the General Counsel.
Committee members have a standing invitation to attend the bi-annual
finance, control and assurance meetings for each of the group’s
regions, and do so on occasion. The committee also has a rotational
programme for committee members to receive presentations from,
and hold discussions with, the group’s regional finance directors.
These focus on the regional finance organisation and succession
plans, priorities for the finance teams, implementation within the region
of the group’s global systems template and the cost and efficiency
programme, and risk management and internal controls. The
meetings provide greater insight on these matters to members of the
committee and also reinforce the culture of integrity and accountability
within the group.
The committee chairman briefs the board on the matters discussed
at each committee meeting and the minutes of each meeting are
circulated to all board members.
The committee’s effectiveness was reviewed as part of the
effectiveness review of the board and its committees carried out
in May 2016. This concluded that the committee was operating
satisfactorily and was effective in fulfilling its mandate.
Financial and corporate reporting
In discharging its responsibilities in relation to the integrity of the
interim and full year financial statements and reporting, before their
submission to the board for approval, the committee reviewed
reports from management and from the external auditors, and
discussed with them:
– the appropriateness and consistency of application of the
accounting policies, their compliance with applicable accounting
standards, and the implementation of changes in international
financial reporting standards;
– the critical accounting judgements and estimations made in the
preparation of the financial statements and those matters where
there have been substantive discussions between management
and the external auditors;
– the contingent liabilities and judgements made in respect of
significant legal matters, on which the committee receives regular
reports from the General Counsel;
– the adequacy and clarity of reporting disclosures and compliance
with applicable financial and other reporting requirements, including
the treatment of exceptional and other items excluded from
adjusted earnings used by management as an additional
performance measure;
– the appropriateness of the going concern basis of accounting
and the newly required statement on the group’s longer-term
viability, with reference to budgeted and projected future cash flows,
debt maturities, cash resources and committed financing facilities,
key credit ratios and sensitivity analyses; and
– whether the annual report, taken as a whole, is fair, balanced
and understandable and provides the information necessary for
shareholders to assess the group’s position and performance,
business model and strategy.
Additionally, the committee reviewed, and discussed with
management and the external auditors, other financial information
issued in relation to the recommended offer for the company.
Critical judgements and key sources of uncertainty in the accounts
are set out in note 1 to the consolidated financial statements and
these were reviewed by the committee. Of particular significance
in the financial statements were the judgements made in respect
of the carrying values of goodwill and investments in associates,
the provisioning for uncertain tax positions, and the treatment of
exceptional and other adjusting items in presenting underlying financial
performance. These were addressed by the committee as follows:
Carrying values of goodwill and investments in associates
The judgements in respect of the carrying values of goodwill and
investments in associates and potential asset impairment relate to the
assumptions underlying the value in use and fair value less costs of
disposal calculations and include the robustness of business plans,
long-term growth assumptions and discount rates. The committee
received and discussed reports from the Chief Financial Officer on the
impairment methodologies applied, the bases for the key assumptions
used, a range of sensitivity analyses, and the related disclosures. The
committee sought additional information from management on the
plans and growth expectations in Australia where carrying values are
significant and market conditions are challenging. In the case of South
Sudan and the investment in our Angolan associate, impairment had
been identified and a charge recognised for the impairment of
property, plant and equipment and the carrying value of the
investment in the associate.
GOVERNANCEGOVERNANCE
71SABMiller plc Annual Report 2016
GOVERNANCE |Audit committee report continued
Uncertain tax positions
The judgements in respect of provisioning for uncertain tax positions
relate to the inherent uncertainties in the application of tax law and
practice, the assumptions underlying deferred tax asset recognition,
and the complexity of assessing potential liabilities across numerous
jurisdictions. The committee received and discussed a report from
the Chief Financial Officer on the potential liabilities identified and
estimates applied and on assumptions used in respect of deferred tax
asset recognition.
Exceptional and adjusting items
The judgements in relation to exceptional and other adjusting items
relate to whether they are appropriate to exclude in presenting
underlying financial performance in the group’s key performance
indicators of EBITA and adjusted EPS. The committee received and
discussed reports from the Chief Financial Officer on each exceptional
and adjusting item to determine whether they were appropriate, and
in accordance with the group’s established policy on these matters,
consistently applied. The committee discussed in particular the
adjustment for the impairments and related losses in South Sudan and
Angola, the costs arising as a result of the AB InBev bid proposals and
recommended offer, including whether or not accelerated recognition
of share-based charges would be appropriate as a result of the offer,
and the costs incurred in relation to the planned brewery closure in
MillerCoors. The committee also monitored conformity with the
agreed policy approach in relation to the exceptional and business
as usual costs of the cost and efficiency programme, and considered
the assurance provided on the allocation of costs and the reporting
of benefits.
The committee received reports from the external auditors on each
of these matters and discussed with them the judgements made.
The committee was satisfied with the explanations provided and
conclusions reached.
The committee reviewed and discussed with management the
processes undertaken to ensure that the annual report was fair,
balanced and understandable and reviewed drafts of the annual
report to consider whether, based on the knowledge and
understanding of committee members, it appeared to be so. The
committee received reports from the Chief Internal Auditor and the
external auditors on whether or not, having reviewed the document,
the results of their respective reviews and other work would suggest
otherwise. The General Counsel reported on the steps taken to verify
the accuracy of statements in the annual report, and on compliance
with legal disclosure requirements. Based on this, the committee
recommended the annual report to the board as fair, balanced and
understandable, and as providing the information necessary for
shareholders to assess the group’s position and performance,
business model and strategy.
Risk management and internal controls
With respect to its oversight of risk management and internal controls,
the committee reviewed and discussed a wide range of matters with
management, and with the internal auditors and external auditors as
appropriate. These included the process changes appropriate to
ensure that the risk management and internal control activities of the
group aligned fully with the requirements of the recently revised UK
Corporate Governance Code. It also included discussion of risks
arising as a consequence of the recommended offer and how these
would be mitigated during the period to completion of the transaction.
The committee:
– reviewed the processes for the identification, management and
monitoring of material risks across the group, and discussed
changes to the principal risks and risk profiles during the year;
– discussed the principal risks identified by the risk management
processes, the mitigating actions, the monitoring of their
effectiveness, residual risk and risk appetite. These were also
discussed by the board. As part of its review of the annual report,
the committee reviewed disclosures with respect to principal risks
and mitigating factors;
– received and discussed regular reports from the Chief Internal
Auditor on the progress of internal audit work against the agreed
annual plan, the principal findings of the internal audit work
undertaken, actions agreed with management, and the progress
on implementation of prior recommendations. The reports also
provided further detail on assurance activities in respect of major
change projects under way in the group, including the findings of
any third party firms appointed to provide related assurance
services, and addressed any identified frauds of significance. Areas
of assurance focus during the year included: management of the
rollout of the global template; implementation of the cost and
efficiency programme; IT network and data security; implementation
of and compliance with anti-bribery and corruption policies; and
progress towards voluntary compliance with the requirements
of Section 404 of the Sarbanes-Oxley Act relating to the
documentation and testing of internal controls over financial
reporting;
– reviewed and approved the annual internal audit plan and resource
requirements;
– reviewed the effectiveness of the internal audit function, including
consideration of its scope as set out in the terms of reference, the
adequacy of resources, including skills and expertise, the relevance
of its findings and quality of reporting, and the impact of its
recommendations. The committee reviewed a report on the
implementation of the recommendations arising from the previous
external review of the effectiveness of internal audit and noted
progress, particularly in relation to the more extensive use of
data analytics;
– received and discussed regular reports from the General Counsel
on compliance matters, including the operation of the group’s code
of business conduct and ethics and related training programmes,
the adequacy of the group’s anti-bribery and corruption framework
and the implementation of its policies, and whistleblowing
arrangements. In relation to the group’s whistleblowing
arrangements the committee received reports from the General
Counsel on concerns raised through these arrangements, both to
assess whether these suggested any need for the enhancement
of internal controls, and to assess whether the whistleblowing
arrangements appear to be functioning effectively, with
proportionate and independent investigation of reported matters,
appropriate protection for whistleblowers, and suitable follow-up
action. The General Counsel also reports to the committee on the
bi-annual letters of representation received from the group’s
businesses on compliance matters and on management actions
taken on any issues identified;
– received and discussed a presentation from the Chief Information
Officer on cyber security, including a progress report on the
programmes being implemented to protect the group against this
evolving risk;
– reviewed with the Chief Financial Officer and the Director of Group
Tax the group’s tax policies and operating frameworks, revisions
proposed to take account of evolving best practice and experience,
and the annual Our Approach to Tax report. After discussion,
amendments updating the policies were agreed by the committee
for endorsement by the board;
72 SABMiller plc Annual Report 2016
– received reports at each meeting of the committee on compliance
with treasury policies, including commodity hedging and
counterparty credit limits;
– received updates on the group’s global insurance arrangements,
and on the operation and funding of the group’s defined benefit
post-retirement plans; and
– received regular updates from the Chief Financial Officer on
developments within the finance function.
As part of the year-end procedures, and based on the activities
described above, the audit committee reviewed the effectiveness
of the systems of internal control and risk management during the
financial year. The objective of these systems is to manage, rather than
eliminate, the risk of failure to achieve business objectives. Accordingly,
they can only provide reasonable, but not absolute, assurance against
material misstatement or loss. The committee reported to the board
on this basis.
External audit independence and effectiveness
SABMiller has a well-established policy on the independence of the
external auditors and management of the company’s relationship with
them. This sets out: the committee’s responsibilities in the selection of
auditors to be proposed for appointment or reappointment and for
agreement on the terms of their engagement, audit scope and
remuneration; the auditor independence requirements and the policy
on the provision of non-audit services and the rotation of audit
partners and staff; and the conduct of the relationship between the
auditors and the committee.
The auditors are precluded from engaging in non-audit services that
would compromise their independence or violate any professional
requirements or regulations affecting their appointment as auditors.
The auditors may, however, provide non-audit services which do
not interfere with their independence, and where their skills and
experience make them a logical supplier, subject to pre-approval by
the committee. The policy stipulates the types of work that are not
permitted to be performed by the auditors and those which may be
permitted in appropriate circumstances. The group’s procedures
require that any non-audit services proposed to be provided by the
auditors be supported by justification as to why the appointment of the
external auditors to provide the services is in the best interests of the
group, and how auditor independence would be safeguarded in the
specific context of the proposed services. The committee has, at each
meeting, reviewed and agreed the non-audit services provided in the
year and the related fees, which are summarised in note 3 to the
consolidated financial statements. SABMiller does not indemnify its
external auditors and there are no contractual obligations restricting
the choice of external auditors.
The external auditors, PricewaterhouseCoopers, later becoming
PricewaterhouseCoopers LLP (PwC) in 2003, were appointed
as the company’s auditors in 1999 when the company moved
its headquarters from Johannesburg to London and listed on the
London Stock Exchange.
PwC has confirmed to the committee its continuing independence
and compliance with the SABMiller policy on auditor independence.
The external auditors are required to rotate the lead audit partner
responsible for the audit engagement every five years, unless there
are unusual extenuating circumstances when a further year may be
considered. The lead audit engagement partner, Richard Hughes,
has now completed five years.
In view of the recommended offer for the company, the significant
deal-related activity and additional workloads and pressures on
management, the committee has agreed with PwC that Richard
Hughes should continue as the lead audit partner for the current
financial year ending 31 March 2017, which is one year beyond the
normal five year term. The committee believes that continuity at this
time will best serve audit quality and reduce risk. To address any
possible independence concerns arising from this extension of term,
PwC has arranged to appoint an independent partner to monitor the
execution of the audit. This is additional to the oversight of the audit
by the engagement quality review partner assigned to our audit. This
latter role is not part of an audit team per se but provides an internally
independent view within an audit firm on the conduct of the audit and
the audit judgements made.
The committee conducted its annual review of the performance
of the external auditors and the effectiveness of the external audit
process for the year ended 31 March 2016. The review was based
on a survey of key stakeholders across the group, consideration
of public regulatory reports on PwC member firms, and the quality
of the auditors’ reporting to and interaction with the committee.
Based on this review, the committee was satisfied with the
performance of the auditors, their objectivity and the effectiveness
of the audit process. In the light of this and their continued
independence, the committee has recommended to the board
that a resolution for the reappointment of PwC as the external
auditors for the financial year ending 31 March 2017 be proposed
at the annual general meeting.
The European Union has directed member states to adopt legislation
by 2016 requiring that companies change their external auditors at
least every 10 years, or every 20 years if an audit tender is held after
10 years, subject to transitional rules, and restricting further the
non-audit services that may be provided. Under the transitional rules
of the new EU regulations, mandatory auditor rotation would require
that new auditors for the company be appointed for the year ending
31 March 2024 at the latest. The Competition and Markets Authority
Statutory Audit Services Order 2014 is consistent with these
requirements on audit tendering. The UK Corporate Governance
Code requires, on a comply or explain basis, that the audit is put
out to tender at least every 10 years, subject to transitional guidance
that, when a tender has not been held in the past 10 years, it would
be appropriate to coincide a tender with the next rotation of the lead
audit engagement partner.
In view of the recommended offer, the committee will not now hold
the audit tender that was planned for later this year for appointment
for the financial year commencing 1 April 2017. The committee
believes avoiding the distraction of a tender during the period
preceding a conclusion of the recommended offer to be in the best
interests of shareholders. Should a transaction not be completed,
it is the committee’s intention that an audit tender process be initiated
as soon as practicable thereafter for appointment for the following
year, which in these circumstances would likely be the financial
statements for the year ending 31 March 2018.
The Competition and Markets Authority Statutory Audit Services Order
2014 sets out certain regulations in respect of audit tendering and
appointments and related audit committee responsibilities which came
into effect for financial years commencing on or after 1 January 2015.
The company has complied with the provisions of the Order for the
financial year ended 31 March 2016.
GOVERNANCEGOVERNANCE
73SABMiller plc Annual Report 2016
GOVERNANCE
Directors’ remuneration report
Annual statement by the chairman of the remuneration committee
Dear shareholder
On behalf of the board, I am pleased to present the remuneration
committee’s report for 2016. I summarise the group’s performance
and the resulting pay outcomes for the year ended 31 March 2016,
and highlight some of the key issues that the remuneration committee
considered during the year.
Performance and outcome
The strategy to strengthen core brands, expand the beer category to
reach more consumers on more occasions, and place an emphasis
on premiumisation, created superior underlying revenue, EBITA and
adjusted EPS growth for the year ended 31 March 2016. Group net
producer revenue was up 5% with group EBITA growth of 8% on an
organic, constant currency basis. Adjusted EPS increased by 12% on
the same basis over the year.
It is a reflection of the dedication and focus of management and
employees that this performance has been achieved in spite of the
distraction of the recommended AB InBev offer.
In terms of TSR, we remain ahead of our competitors, with growth
of 115% over the five years to 31 March 2016. £100 invested in
SABMiller five years ago was worth £215 on 31 March 2016, compared
with £202 if invested in the median of our peer group, or only £126
if invested in the FTSE 100 index. Furthermore, £100 invested
in SABMiller upon our listing in London in 1999 would have been
worth £1,477 on 31 March 2016.
Underlying revenue, EBITA and adjusted EPS growth resulted in above
target bonuses for the year. However, the translational impact of
currency depreciation against the US dollar caused some long-term
incentive awards with three to five-year performance periods to lapse
with a nil payout. Adjusted EPS increased by 9% per annum over the
last three years, on a constant currency basis, but the continued
strengthening of the US dollar (being the currency in which we report
our group results) eroded those figures to show a decline in reported
adjusted EPS of 2% per annum, which is below the threshold
performance levels necessary for share options and performance
shares to vest. TSR out-performed, and therefore the value shares
with three to five-year performance periods ended in the year to
31 March 2016 have partially vested.
Further details of the performance measures and resulting outcomes
are shown on page 83 for the annual bonus plan, and on page 85 for
the long-term incentives.
Executive director changes
Domenic De Lorenzo was appointed Chief Financial Officer and
an executive director on 23 July 2015, having been the acting
Chief Financial Officer since February 2015. Domenic was previously
Director of Group Strategy and Corporate Development and a
member of SABMiller’s executive committee. Therefore this was
an internal appointment and the committee reviewed his pay
Lesley Knox
Chairman of the remuneration committee
It is the remuneration committee’s responsibility to ensure
that payments to executives are appropriate and aligned
with shareholder interests.”
1 Apr
2011
31 Mar
2012
31 Mar
2013
31 Mar
2014
31 Mar
2015
31 Mar
2016
80
100
120
140
160
180
200
220
240
Value of £100 invested 5 years ago
(1 April 2011)
SABMiller £215
Peer median £202
FTSE 100 £126
26 Feb
1999
31 Mar
2016
80
280
480
680
880
1080
1280
1480
1680
Value of £100 invested upon
London listing (1999)
SABMiller £1,477
Peer median £495
FTSE 100 £179
74 SABMiller plc Annual Report 2016
arrangements in accordance with the recruitment policy for internal
appointments as shown on page 78. Recognising that Domenic was
new to the role, his base pay was set at £680,000 per annum, at the
lower end of the market range and below the £762,200 per annum
paid to the previous incumbent. This pay level was set in anticipation
that future pay increases would enable his base pay to increase to
around median over time, subject to performance. For the year
commencing 1 April 2016, his base pay has been increased by 5.1%
to £715,000. In accordance with the recruitment policy for internal
appointments, Domenic’s long-term incentive awards that had not
vested at the time of his appointment as an executive director would
remain subject to their original performance conditions and vesting
timescale. No sign-on or other similar compensation was paid,
or is payable.
Impact of change of control
Following the approach by AB InBev, the committee met in October
2015 and again in November 2015 to consider the impact and
determine the treatment of remuneration upon a change of control.
The committee considered the remuneration policy and rules of the
remuneration plans. The circumstances and likely timeline to a change
of control were also considered. The following key principles and
resulting treatment were determined in accordance with the
remuneration policy and rules of the remuneration plans:
– For the period before change of control – business continues
as normal, and the treatment of remuneration also continues
as normal. This includes pay reviews, annual bonus outcomes,
vesting and grant of long-term incentive awards determined
in the normal way.
– Upon change of control – executive remuneration plans that are
part-way through their performance periods will be brought to a
close upon change of control, with the annual bonus opportunity
pro-rated for the period to change of control. In accordance with
the plan rules, unvested long-term incentives granted more than
12 months before change of control will vest in full where an EPS
performance condition applies (the committee having considered
financial forecasts and likelihood of vesting), and those with a TSR
performance condition will be determined by TSR performance to
change of control. Any long-term incentive awards granted within
12 months of change of control will be pro-rated for the period to
change of control.
The agreement reached with AB InBev, as part of the recommended
offer, provides that certain employees (but not executive directors or
executive committee members) may receive retention payments of up
to a maximum of 100% of annual base pay, payable over a period of
up to 24 months. Additional retention, transaction and integration
bonus arrangements may also be put in place, as outlined in the joint
announcement on 11 November 2015, available on our website.
These additional arrangements do not form part of the group’s
remuneration policy and do not apply to executive directors.
If, as a result of change of control, an executive director’s employment
is terminated, they will be entitled to receive a payment in lieu of
their notice period (not exceeding 12 months) comprising base pay,
retirement benefits and other benefits, plus any local or statutory
redundancy entitlement, but no compensation is payable for annual
bonus or long-term incentive opportunities forgone in respect of that
notice period.
Committee changes
Javier Ferrán joined the board and the committee on 23 July 2015
and I am grateful for his contribution. I also thank the other
committee members for their dedicated service to the company
and this committee.
It is the remuneration committee’s responsibility to ensure that
payments to executives are appropriate and aligned with shareholder
interests. Payments for the year ended 31 March 2016, the setting
of new executive director pay, the treatment of remuneration upon
change of control with the exclusion of executive directors from any
retention, transaction and integration bonus arrangements, have
maintained this principle.
Yours sincerely,
Lesley Knox
Chairman of the remuneration committee
10 June 2016
Remuneration at a glance
The table below summarises the pay of the executive directors in respect of the year ended 31 March 2016. Further details are contained in
pages 81 to 85 of this report.
Name
Base pay
Retirement
and other
benefits Annual bonus Long-term incentives2
Total remuneration
£’000 £’000 £’000
% of
maximum £’000
% of
maximum
2016
£’000
2015
£’000 % change
Alan Clark
(Chief Executive) 1,167 593 1,709 84% 2,404 23% 5,873 7,072 -17%
Domenic De Lorenzo
(Chief Financial Officer)1
471 159 462 82% 992 41% 2,084 – n/a
Fixed pay Short-term incentives Long-term incentives
1
Domenic De Lorenzo was appointed a director on 23 July 2015 and this table shows his remuneration from that date.
2
The value of long-term incentives includes those granted to executive directors in respect of their prior service as employees, rather than only those granted to them as, or in contemplation of
their appointment as, executive directors.
GOVERNANCEGOVERNANCE
75SABMiller plc Annual Report 2016
Fixed pay Short-term incentives
Base pay Retirement benefits Other benefits Annual bonus plan
Purpose
and link to
strategy
Provides a fixed level of
earnings, appropriate to
the market and
requirements of the role.
Provides a basis for
savings to provide an
income in retirement.
Provides benefits and
allowances appropriate
to the market, and to assist
executives in efficiently
carrying out their duties.
Incentivises and rewards the achievement of annual financial
performance balanced with the delivery of the company’s
strategic priorities.
With base pay set at around median, the annual bonus plan
ensures that above-market pay cannot be achieved unless
challenging performance targets are met.
Operation Base pay is reviewed
annually with effect from
the start of each financial
year.
There is no obligation to
increase base pay upon
any such review.
SABMiller does not provide
guaranteed retirement
income (defined benefit
pension), but makes defined
contributions towards
pension savings.
In the UK, amounts up
to the annual and lifetime
allowances are generally
contributed to the SABMiller
plc UK Staff Pension
Scheme (a registered defined
contribution pension scheme
in which all UK employees
are eligible to participate).
Any amounts in excess of
these limits are notionally
credited to the company’s
unfunded retirement benefits
scheme, or paid in lieu as a
taxable cash amount.
Benefits and allowances may
include a company car or car
allowance, fuel card, family
medical and dental insurance,
long-term disability insurance,
life insurance, accompanied
travel, occasional overnight
accommodation, legal and
professional fees relevant
to duties, club subscriptions,
and a beer allowance.
In addition, executive
directors may also participate
in employee discount
programmes and
all-employee share plans
on the same basis as other
employees. Executive
directors also have access
to the same facilities as other
UK employees, including
access to on-site staff car
parking at certain locations
and a company bar.
The total bonus opportunity is split:
– minimum of 60% annual financial performance; and
– maximum of 40% individual strategic objectives.
This balance, with a significant proportion of the annual bonus
opportunity based on longer term and sustainability metrics
ensures that the achievement of short-term financial
performance is not at the expense of enabling future shareholder
value creation.
If overall business performance is not satisfactory, or if there is
required to be a material restatement of financial results (other
than due to a change in accounting policy), misconduct, or other
action causing harm to the reputation of the company, all or part
of any annual bonus not already paid may be forfeited, and any
annual bonus already paid may be clawed-back.
Opportunity
and maxima
Around median for
the relevant market
(generally the FTSE-30
for UK-based executive
directors), while
recognising experience
and responsibilities.
Any increases will be
in the context of overall
business performance,
with reference to the
market median and any
further increases will
not exceed the average
annual increase awarded
to other UK-based
employees.
Pension contributions for
executive directors are fixed
at 30% of base pay.
Company car allowance is
fixed at £17,150 per annum.
The maximum amount paid
for other benefits will be the
actual cost of providing those
benefits which, particularly in
the case of insured benefits,
may vary from year to year,
although the committee is
mindful of achieving the best
value from benefit providers.
The policy maximum bonus opportunities for executive directors
at each performance level are:
– Maximum: 200% of base pay.
– Target: 100% of base pay.
– Threshold: 50% of base pay.
The current bonus opportunities are:
Chief Executive: up to a maximum of 175% of base pay, with
87.5% of base pay at target, and 43.75% of base pay at threshold.
Other executive directors: up to a maximum of 120% of base pay,
with 60% of base pay at target, and 30% of base pay at threshold.
Performance
measures
Not applicable. Not applicable. Not applicable. The annual financial performance measures and weightings are
reviewed each year, and may be changed to ensure that they
continue to align with the company’s key strategic priorities.
The range of performance measures will typically be selected
from revenue, market share, volume, cost savings, profit, return
on capital, cash, working capital, margin growth, EPS and
sustainability metrics including water usage, reductions in fossil
fuel emissions, and health and safety measures.
Remuneration policy
GOVERNANCE |Directors’ remuneration report continued
Remuneration policy notes
1
The committee reserves the right to make any remuneration payment, notwithstanding
the policy set out in this report, where the terms of the payment were determined before
the policy came into effect, or if the individual was not an executive director at the date
the remuneration was determined (unless that remuneration was set in consideration
or in anticipation of becoming an executive director). The committee may make minor
amendments to the policy (for regulatory, exchange control, or administrative purposes,
or to take account of a change in other legislation) without obtaining shareholder approval
for that minor amendment.
2
The remuneration policy for other UK employees is similar to that for executive directors
in accordance with our philosophy that remuneration should be appropriate to the local
competitive market. Certain components of remuneration (for example, car allowance and
long-term incentives) are paid only to certain levels of employees. There are other variances
depending on geographic location and local market practice, but the general approach is
consistent across the group.
This report covers the year from 1 April 2015 to 31 March 2016, and complies with the requirements of the Large and Medium-sized Companies
and Groups (Accounts and Reports) Regulations 2008 (as amended) (‘the regulations’) and the provisions of the UK Corporate Governance
Code relating to remuneration. The format and content take into account the Directors’ Remuneration Reporting Guidance of the GC100 and
Investor Group, together with other guidance issued by institutional investor and governance bodies.
It is intended that the remuneration policy will be put to a shareholder vote every three years (unless an earlier change of policy is proposed)
and will apply from the date of the relevant general meeting. The policy described in the 2014 report took effect from 24 July 2014, following
shareholder approval at the 2014 annual general meeting. No changes have been made to the policy and accordingly the policy is not being
76 SABMiller plc Annual Report 2016
Long-term incentives
Share option plan Share award plan Shareholding
requirement
Non-executive
directors’ fees
Provides a direct and transparent link between
executive pay and value creation for
shareholders.
Share options may be structured as stock
appreciation rights (SARs), which are
economically equivalent to share options but
result in less dilution of share capital.
The combination of a share option plan and share award plan enables
executives to be incentivised and rewarded for achieving a broader
range of performance measures, in addition to share price increase.
Provides alignment with
shareholder returns by
ensuring a reduction in
executive directors’ own
wealth if there is a
reduction in SABMiller’s
share price.
Compensates
non-executive directors
for their responsibilities
and time commitment.
Share options reward executive directors only if
there is an absolute increase in the share price.
Furthermore, to ensure that any share price
increase is supported by a sustainable
improvement in the group’s underlying financial
performance, additional performance conditions
are applied before vesting of:
– two-thirds of the share options after three
years; and
– one-third of the share options after five years.
Vesting at threshold cannot be greater than 65%
of the maximum award for the Chief Executive
and 80% of the maximum award for other
executive directors (but see note 4 below). If
these performance conditions are not met, the
appropriate proportion of share options will
lapse, and there is no opportunity for retesting.
If there is required to be a material restatement
of financial results (other than due to a change in
accounting policy), misconduct, or other action
causing harm to the reputation of the company,
all or part of any share award not yet vested may
be forfeited, and any share award already vested
may be clawed-back.
Share awards comprise performance shares and value shares.
Performance shares vest in a single tranche on the third anniversary
of the grant date, subject to achieving the performance conditions.
25% of the shares vest at threshold, with 100% vesting at maximum.
Value shares vest only if SABMiller’s TSR out-performs the median of
a comparator group. No shares vest for median performance or below,
but for every £10 million of additional shareholder value created (being
the percentage out-performance multiplied by the company’s market
capitalisation at the commencement of the performance period), a
fixed number of shares will vest. Value shares vest one-third on each
of the third, fourth and fifth anniversaries of the grant date, based on
performance to these fixed dates.
If the performance conditions are not achieved by the relevant dates,
the appropriate proportion of the share awards will lapse, and there
is no opportunity for retesting.
If there is required to be a material restatement of financial results (other
than due to a change in accounting policy), misconduct, or other action
causing harm to the company, all or part of any share award not yet
vested may be forfeited, and any share award already vested may be
clawed-back.
Any shares arising from
the exercise of share
options or vesting of
share awards must be
retained (except those
shares sold to pay the
exercise price and any
tax upon exercise or
vesting of any such
award) until the relevant
shareholding requirement
is met, unless the
committee determines
otherwise in exceptional
circumstances.
Fees are reviewed
annually by the board,
and the Chairman’s fee
is determined annually
by the committee.
Fees are paid in cash,
but may be paid in shares
having the equivalent
value at the request of the
non-executive director.
Non-executive directors
are not eligible to
participate in any of the
company’s incentive
plans, and receive no
benefits other than a beer
allowance which is
at the same level as for
UK-based employees.
Grants are made annually at the discretion
of the committee.
Chief Executive: share options with a face value
at grant up to a maximum of 500% of base pay.
Other executive directors: share options with a
face value at grant up to a maximum of 400%
of base pay.
Grants are made annually at the discretion of the committee.
Chief Executive: performance shares with a face value at grant up to a
maximum of 250% of base pay, plus value shares up to a maximum of
125 shares for every £10 million of additional shareholder value created.
Other executive directors: performance shares with a face value at
grant of up to a maximum of 200% of base pay, plus value shares
up to a maximum of 100 shares for every £10 million of additional
shareholder value created.
Shares owned outright
equivalent to:
Chief Executive: 300%
of base pay.
Other executive directors:
200% of base pay.
Fees are set at around
median for the FTSE-30.
Any increases will be
in the context of overall
business performance,
and with reference to
the market median.
A core financial performance measure (being
EPS growth over periods of three and five years).
A core financial performance measure for performance shares (being
EPS growth over three years).
An external relative performance measure for value shares (being TSR
out-performance of the median of a comparator group over three, four
and five years).
Not applicable. Not applicable.
3
The specific financial performance measures applicable to short-term and long-term
incentive plans may be varied to align with the company’s key strategic priorities. The targets
for each performance measure are set to be stretching, based on a number of reference
points including company targets, analyst forecasts, and shareholder expectations.
4
The approved policy allows for threshold vesting of share options at up to 65% of maximum
for the Chief Executive and up to 80% of maximum for other executive directors. However,
the remuneration committee has confirmed that in applying the policy for share options
granted from 2015, the percentage of any award capable of vesting at threshold
performance will not exceed 25% of maximum.
put to a shareholder vote this year. A full copy of the remuneration policy approved by shareholders is included in the 2014 annual report.
Key aspects of the remuneration policy are reproduced in this year’s report for ease of reference.
Remuneration policy table
The table below sets out the remuneration policy that applies to executive directors from 24 July 2014, approved by shareholders at the
2014 annual general meeting.
GOVERNANCEGOVERNANCE
77SABMiller plc Annual Report 2016
Remuneration policy continued
GOVERNANCE |Directors’ remuneration report continued
Service contracts and notice periods
It is the policy that executive directors have service contracts with the company which may be terminated with not less than 12 months’ notice
given by the company or by the executive. The committee retains the discretion to appoint a new executive director on a notice period of up to
24 months reducing to 12 months during the first year, such that after 12 months’ service the notice period would have reverted to the standard
12 months. Non-executive directors do not have service contracts, but serve the company under letters of appointment which may be
terminated without liability for compensation.
Date first appointed
to the board
Date of current
service contract
or letter of
appointment
Date next
due for
election or
re-election
Non-executive chairman
Jan du Plessis 1 September 2014 23 July 2015 2016 AGM
Executive directors
Alan Clark 26 July 2012 23 May 2013 2016 AGM
Domenic De Lorenzo 23 July 2015 23 July 2015 2016 AGM
Non-executive directors
Mark Armour 1 May 2010 14 April 2010 2016 AGM
Dave Beran1
23 July 2015 12 October 2005 2016 AGM
Geoffrey Bible 1 August 2002 27 September 2002 2016 AGM
Dinyar Devitre 16 May 2007 16 May 2007 2016 AGM
Guy Elliott 1 July 2013 4 April 2013 2016 AGM
Javier Ferrán2
23 July 2015 23 July 2015 n/a
Lesley Knox 19 May 2011 17 May 2011 2016 AGM
Trevor Manuel 1 March 2015 27 January 2015 2016 AGM
Dambisa Moyo 1 June 2009 26 May 2009 2016 AGM
Carlos Pérez Dávila 9 November 2005 12 October 2005 2016 AGM
Alejandro Santo Domingo Dávila 9 November 2005 12 October 2005 2016 AGM
Helen Weir 19 May 2011 17 May 2011 2016 AGM
1
Dave Beran was appointed to the board on 23 July 2015 under the company’s existing agreement with Altria Group, Inc (Altria) dated 12 October 2005. He has no separate letter of
appointment.
2
Javier Ferrán will step down from the board at the annual general meeting on 21 July 2016.
Copies of the relevant service contracts or letters of appointment can be viewed at the company’s registered office, or in the case of service
contracts, on the company’s website at www.sabmiller.com.
Recruitment policy
The committee will pay no more than it considers necessary to attract appropriate candidates, and it is not contemplated that remuneration
will need to be different from the structure or exceed the limits set out in the remuneration policy table. The maximum variable remuneration will
be in line with that set out in the policy table on pages 76 and 77. For internal appointments, the committee may allow any unvested long-term
incentive awards upon appointment to remain subject to the original performance conditions and vesting timescale applicable to those awards.
For external appointments, where a newly appointed executive director forgoes a bonus or long-term incentive award (or similar) upon leaving
a previous employer, the committee will determine the expected value of the amounts forgone (taking into account any performance conditions
and duration until vesting), and may pay compensation in cash, in SABMiller shares, or an award of long-term incentives, but, in any event, the
total compensation amount will not exceed the expected value of the amounts forgone. Furthermore, any such compensation will be subject
to forfeiture and clawback if the executive leaves the company voluntarily within a fixed time period determined by the committee, being not less
than two years. Compensation for amounts forgone upon recruitment is not payable to non-executive directors.
78 SABMiller plc Annual Report 2016
Termination policy
The committee’s approach, when considering payments in the event of termination, is to take account of the individual circumstances including
the reason for termination, any contractual or other legal obligations, and the relevant share plan and pension scheme rules. The overriding
principle is that there should be no reward for failure. While the treatment applied is at the discretion of the committee, in normal circumstances
the application is tabulated below.
Reason Fixed pay Short-term incentives Long-term incentives
Voluntary termination,
giving notice to company.
Nil after notice period has been completed,
with provision for pay in lieu of notice,
comprising base pay and benefits only.
Forfeited. Any unvested share options, share awards
and deferred shares are forfeited.
Any vested but unexercised share options must
be exercised before the date of termination.
Retirement, injury, disability,
or ill-health.
Nil after leaving date.
Long-term disability insurance may
become payable.
Not contractual, but normal practice
is to pro-rate the annual bonus for the
year in which the employee departs,
subject to performance.
Not contractual, but normal practice is that
unvested share options and share awards are
pro-rated for time served, with vesting subject
to applicable performance conditions.
Any vested but unexercised share options must
be exercised within 12 months of termination.
Redundancy, or other
termination.
Fixed pay in lieu for the remainder of the
notice period, less any deduction considered
appropriate and reasonable taking into account
any accelerated receipt of payment and the
employee’s duty to mitigate any loss, subject
to any statutory minimum entitlements which
may apply.
Death in service. Fixed pay will cease at the end of the month
in which death occurs. Life insurance and
dependant pension (if any) may become
payable.
Subject to the absolute discretion of the
committee. Any unvested share options and
share awards may vest in full, or in part or may
lapse completely depending on the specific
circumstances and business performance to
the date of death.
Policy on external appointments
Each executive director is permitted to accept a non-executive directorship in another company, subject to the prior approval of the board.
This will normally be limited to one appointment. Fees received in respect of external appointments may be retained by the individual. Currently,
no executive director has non-executive directorships in external companies.
Pay and employment conditions across the group
The company operates in a number of different locations with employees paid by reference to applicable market rates, and base pay reviewed
annually. The ratio between fixed and variable pay for employees differs by level, geographic location and business unit. Variable performance-
related pay and share plans operate across the group but may differ in terms of structure, award levels and performance measures. Long-term
incentives on similar terms to executive directors are cascaded to the other executive committee members, and to around 1,700 other
employees in the group. Employment conditions and benefits are determined according to the local market to enable high standards of health
and safety and employee wellbeing.
The company does not consult directly with employees when determining directors’ remuneration, but undertakes regular employee
engagement surveys which provide a mechanism for feedback on a number of issues, including remuneration. Furthermore, many employees
are also shareholders in SABMiller, and are able to participate in the votes on directors’ remuneration.
Remuneration comparison measurements are not used routinely, because of the inconsistencies in comparing pay levels across different
geographies and workforce profiles.
Discretion and judgement
Discretion is necessary to ensure that outcomes remain appropriate in all the circumstances, including those not anticipated by the
remuneration policy. Mechanistic or formulaic remuneration outcomes are not always appropriate in context, and the committee may exercise
discretion to adjust a payment, performance metric or targets in exceptional circumstances. Judgement is applied by the committee in setting
performance targets to ensure they are sufficiently stretching, and to alter performance metrics and targets if they are no longer a fair measure
of performance (providing any new metrics and targets are not materially less challenging than the originals).
The committee has discretion to interpret the rules of any remuneration plan, and to determine the participation and level of the awards including
the extent of vesting of awards under certain leaver situations. The committee also maintains discretion to adjust share awards in the event of
a variation of capital, and to determine the treatment in the event of a corporate transaction, including whether incentives vest in full, or in part,
or lapse completely, or are rolled over into replacement awards, and how any special dividend might be treated.
If there is required to be a material restatement of financial results (other than due to a change in accounting policy), misconduct or other action
causing harm to the reputation of the company, the committee has the discretion to adjust, forfeit or clawback payments and awards in respect
of a participant, a group of participants, or all participants.
GOVERNANCEGOVERNANCE
79SABMiller plc Annual Report 2016
GOVERNANCE |Directors’ remuneration report continued
Annual report on remuneration
During the year ended 31 March 2016 and to the date of this report, committee members’ attendance at meetings and details of the core
agenda items discussed are shown below:
Meeting Core agenda items Members eligible to attend Attended
May 2015 – Determine base pay of executive directors and executive committee members
for the year commencing 1 April 2015.
– Consider and approve short-term incentive payments for the year ended
31 March 2015.
– Consider and approve long-term incentive awards vesting in respect of the
performance periods ended 31 March 2015.
– Determine short-term incentive and long-term incentive performance measures
and targets, and consider total remuneration for various performance outcomes
for awards to be made during the year commencing 1 April 2015.
– Approve long-term incentive awards to be granted in 2015.
Lesley Knox (chairman)
Mark Armour
Guy Elliott
John Manzoni
July 2015 – Determine remuneration for the Chief Financial Officer. Lesley Knox (chairman)
Mark Armour
Guy Elliott
Javier Ferrán
October 2015 – Consider impact on remuneration plans upon a change of control. Lesley Knox (chairman)
Mark Armour
Guy Elliott
Javier Ferrán
November 2015 – Approve (off-cycle) long-term incentive awards to selected employees joining
or promoted during the year.
– Confirm treatment of remuneration plans upon a change of control.
Lesley Knox (chairman)
Mark Armour
Guy Elliott
Javier Ferrán
March 2016 – Monitor and assess the progress towards performance goals. Lesley Knox (chairman)
Mark Armour
Guy Elliott
Javier Ferrán
May 2016 – Determine base pay of executive directors and executive committee members
for the year commencing 1 April 2016.
– Consider and approve short-term incentive payments for the year ended
31 March 2016.
– Consider and approve long-term incentive awards vesting in respect of the
performance periods ended 31 March 2016.
– Determine short-term incentive and long-term incentive performance measures
and targets, and consider total remuneration for various performance outcomes
for awards to be made during the year commencing 1 April 2016.
– Approve long-term incentive awards to be granted in 2016.
Lesley Knox (chairman)
Mark Armour
Guy Elliott
Javier Ferrán
During the year, John Manser, Jan du Plessis, Alejandro Santo Domingo, Howard Willard, and Dave Beran attended some committee meetings
as observers. Also present, at the invitation of the committee, were Alan Clark (Chief Executive), Stephen Shapiro (Group Company Secretary),
John Davidson (General Counsel), Johann Nel (Group Human Resources Director), and Roger Fairhead (Group Compensation & Benefits
Director), although none was present when their own remuneration was discussed.
Advisers to the remuneration committee
External advisers Kepler Associates is appointed by the committee, following a competitive tender, to provide independent advice on
remuneration matters including current market practices, incentive design, performance measures, and independent
monitoring of TSR. During the year Kepler Associates became a brand of Mercer. Both Kepler Associates and Mercer are
founding members and signatories of the Code of Conduct for Remuneration Consultants. The committee reviews the
advice provided by Kepler Associates to satisfy itself that it is independent. Kepler Associates does not provide any other
advice to the group, and fees are charged on a time basis. Total fees for support to the committee during the year ended
31 March 2016 were £102,150.
Market data is sourced by the group compensation & benefits function from a number of consultancies, including Towers
Watson, Mercer and Hay Group to provide context for the committee. Other than Kepler Associates, the provision of
information to the committee by other providers is incidental to their main function of advising the group compensation
& benefits function on the remuneration of employees outside the scope of this report.
Internal advisers The committee considers the views of the Chairman and the Chief Executive on the remuneration and performance of other
members of the executive committee. The Group Company Secretary, the General Counsel, the Group Human Resources
Director, and the Group Compensation & Benefits Director also provide information and advice to the committee on legal,
regulatory and governance issues, and on the pay and conditions for employees throughout the group.
80 SABMiller plc Annual Report 2016
Executive directors’ emoluments for the year ended 31 March 2016 (audited)
£’000 Base pay
Retirement
benefits2
Other benefits3
Total fixed pay
Annual bonus
(see page 83)
Long-term incentives
(including the effect
of share price growth)4
(see page 85) Total
2016 2015 2016 2015 2016 2015 2016 2015 2016 2015 2016 2015 2016 2015
Alan Clark 1,167 1,133 350 340 243 59 1,760 1,532 1,709 1,098 2,404 4,442 5,873 7,072
Domenic
De Lorenzo1
471 – 140 – 19 – 630 – 462 – 992 – 2,084 –
1
Domenic De Lorenzo was appointed a director on 23 July 2015 and this table shows his remuneration from that date.
2
Retirement benefits consist solely of contributions to defined contribution arrangements. None of the directors have entitlements to defined benefit pensions in respect of their services
as a director.
3
Other benefits include car allowance, family medical and dental insurance, long-term disability insurance, life insurance, accompanied travel, occasional overnight accommodation, legal
and professional fees, and a beer allowance. Alan Clark also received a long-service award during the year of £145,875 (11
/2 months’ base pay) in recognition of 25 years’ service in accordance
with the group’s policy for all UK employees.
4
The value of long-term incentives vesting in respect of performance periods ended in the year to 31 March 2016 includes those granted to executive directors in respect of their prior service
as employees, rather than only those granted as, or in contemplation of their appointment as, executive directors.
The charts below show the remuneration opportunity for the year ended 31 March 2016 (using the same assumptions as the remuneration
scenario charts included in the remuneration policy approved by shareholders in 2014), with actual remuneration being shown with and
without the effect of share price growth over the performance periods. In the five years ended 31 March 2016, SABMiller’s share price
increased by 92%.
Alan Clark
£m
Domenic De Lorenzo
£m
2016 (including share price growth)
2016 (excluding share price growth)
Opportunity
Min On-target Max
£0 £5 £10 £15
2016 (including share price growth)
2016 (excluding share price growth)
Opportunity
Min MaxOn-target
£0 £1 £2 £3 £4 £5
GOVERNANCEGOVERNANCE
81SABMiller plc Annual Report 2016
GOVERNANCE |Directors’ remuneration report continued
Annual report on remuneration continued
Non-executive directors’ emoluments for the year ended 31 March 2016 (audited)
£’000 Fees Benefits5
Total
2016 2015 2016 2015 2016 2015
Mark Armour 135 125 – – 135 125
Dave Beran (appointed 23 July 2015) 59 n/a – n/a 59 n/a
Geoffrey Bible 97 92 – – 97 92
Dinyar Devitre 105 100 – – 105 100
Jan du Plessis1
476 47 – – 476 47
Guy Elliott 150 145 – – 150 145
Javier Ferrán (appointed 23 July 2015)2
67 n/a – n/a 67 n/a
Lesley Knox 133 128 – – 133 128
John Manser (retired 23 July 2015) 203 650 – – 203 650
Trevor Manuel 91 7 – – 91 7
John Manzoni (retired 23 July 2015)3
– 62 – – – 62
Miles Morland (retired 24 July 2014) n/a 32 n/a – n/a 32
Dambisa Moyo 110 105 – – 110 105
Carlos Pérez Dávila 85 80 – – 85 80
Alejandro Santo Domingo Dávila 85 80 – – 85 80
Helen Weir 117 112 – – 117 112
Howard Willard (retired 23 July 2015)4
– – – – – –
1
Jan du Plessis was appointed to the board on 1 September 2014 and appointed Chairman on 23 July 2015. Under the terms of his appointment, his annual fee is £650,000 and his
appointment may be terminated with 12 months’ notice. In his capacity as chairman of Rio Tinto plc, he is provided with a car and driver, and on occasions he uses this car and driver for
SABMiller business. SABMiller reimburses Rio Tinto plc in respect of the travel costs incurred, but no amount payable by SABMiller relates to any personal use. For the year ended 31 March
2016, the amount paid to Rio Tinto plc was £45,600 inclusive of VAT.
2
Javier Ferrán will step down from the board at the annual general meeting on 21 July 2016.
3
John Manzoni announced his intention to step down as a director following the 2015 annual general meeting, and declined to accept his non-executive director’s fee from the date of this
announcement on 30 October 2014.
4
Howard Willard is an executive officer of Altria Group, Inc (Altria), and in line with the company’s agreement with Altria, he did not receive a director’s fee from the company.
5
Non-executive directors do not participate in any of the company’s incentive plans, nor do they receive retirement or other benefits, other than a beer allowance (the value of which was
considerably less than £1,000 for the year ended 31 March 2016).
Base pay and non-executive directors’ fees
Executive directors’ base pay, and non-executive directors’ fees, for the year ended 31 March 2016 and those for the year ending
31 March 2017 (annualised for ease of comparison), are as follows.
Annualised
Year ended
31 March 2016
£
Year ending
31 March 20171
£ % change
Executive directors
Chief Executive 1,167,000 1,200,000 2.8%
Chief Financial Officer 680,000 715,000 5.1%
Non-executive directors
Non-executive Chairman’s fee (inclusive of all committee fees) 650,000 650,000 –
Base fee 85,000 85,000 –
Senior Independent Director (additional fee) 30,000 30,000 –
Committee chairman fee (inclusive)
– Audit 35,000 35,000 –
– Remuneration 28,000 28,000 –
– Nomination 25,000 25,000 –
– CARAC 25,000 25,000 –
Committee member fee
– Audit 20,000 20,000 –
– Remuneration 15,000 15,000 –
– Nomination – – –
– CARAC 12,000 12,000 –
1
At its meeting on 17 May 2016 the board considered the level of non-executive directors’ fees and resolved not to increase them for the year ending 31 March 2017.
82 SABMiller plc Annual Report 2016
Annual bonus
Outcome for the year ended 31 March 2016 (audited)
For the year ended 31 March 2016, the total bonus opportunity for executive directors was split:
– 60% annual financial performance; and
– 40% individual strategic objectives.
The performance measures and achievement against each target for the year ended 31 March 2016 are shown in the table below. The actual
financial targets and detailed strategic objectives of the executive directors for the year ended 31 March 2016 have not been disclosed as they
remain commercially confidential. The board will review this position, and if the risk is no longer considered material, retrospective disclosure
of the financial targets and strategic objectives may be made if appropriate. Retrospective disclosure of results and targets for the year ended
31 March 2014 is shown on page 84, as the commercial risk of this level of disclosure is no longer considered material.
Performance measure Weighting Achievement
Outcome
Alan Clark
Domenic
De Lorenzo
Financial performance targets:
– Group net producer revenue growth 20% 33% 6.7% 6.7%
– Group EBITA growth 20% 100% 20% 20%
– Adjusted EPS growth 20% 100% 20% 20%
60% 46.7% 46.7%
+ + +
Individual strategic objectives:
– Alan Clark
40%
92.5% 37.0%
– Domenic De Lorenzo 88% 35.2%
= = =
Total (% of maximum bonus opportunity) 100% 83.7% 81.9%
x x
Maximum bonus opportunity (% of base pay) 175% 120%
x x
Base pay during the year £1,167,000 £470,580
= =
Annual bonus £1,709,000 £462,000
Alan Clark’s strategic objectives included his leadership of global initiatives on costs and category optimisation, for which achievement during
the year ended 31 March 2016 was rated as 92.5% of maximum.
Domenic De Lorenzo’s strategic objectives included efficiency savings and risk management, for which achievement during the year ended
31 March 2016 was rated as 88% of maximum.
GOVERNANCEGOVERNANCE
83SABMiller plc Annual Report 2016
GOVERNANCE |Directors’ remuneration report continued
Annual report on remuneration continued
Retrospective disclosure of annual bonus targets for the year ended 31 March 2014
Performance measure Weighting
Threshold
(25%)
Target
(50%)
Maximum
(100%) Result
Outcome
Alan Clark Jamie Wilson
Financial performance targets:1
– Group net producer revenue growth (%) 15% 6.5 9.9 13.4 4.3 (0%) nil nil
– Group EBITA margin growth (bps) 15% – 10 50 61 (100%) 15% 15%
– Adjusted EPS growth (%) 15% 5.2 10.1 16.1 9.0 (45%) 7% 7%
– Group free cash flow (US$m) 15% 2,832 3,146 3,461 3,202 (59%) 9% 9%
60% 31% 31%
+ + +
Individual strategic objectives:
Alan Clark
40%
32%
– Category strategy developed and implemented 90%
– End-to-end supply chain established and cost
savings delivered
70%
Jamie Wilson
– Global Business Services established to plan
(time and cost)
75%
30%
– Tsogo Sun exit achieved and managed to timetable 75%
= = =
Total (% of maximum bonus opportunity) 100% 63% 61%
x x
Maximum bonus opportunity
(% of base pay)
175% 120%
x x
Base pay during the year £1,085,000 £740,000
= =
Annual bonus £1,196,300 £541,700
1
Targets and outcomes are shown using budgeted exchange rates for the relevant performance period with adjustments for unbudgeted acquisition and disposal activities during the year to
enable like-for-like comparison.
Performance measures for the year commencing 1 April 2016
The performance measures and weightings that will determine the total bonus opportunity for the year commencing 1 April 2016 are:
Performance measure Weighting
Financial performance targets:
– Group net producer revenue growth 25%
– Group EBITA growth 25%
– Net working capital 10%
60%
– Individual strategic objectives 40%
100%
If there is a change of control during the year ending 31 March 2017, any bonus amounts payable to executive directors shall be determined by
reference to achievement of the above financial performance targets and individual strategic objectives, with annual bonus payments pro-rated
for the period to change of control.
84 SABMiller plc Annual Report 2016
Share option plan
Outcome for the year ended 31 March 2016 (audited)
Share options provide a direct and transparent link between executive pay and value creation for shareholders, as no gains are possible unless
there has been an absolute increase in the share price. Furthermore, to ensure that any share price increase is supported by a sustainable
improvement in the group’s underlying financial performance, additional performance conditions are applied before vesting of:
– two-thirds of the share options after three years; and
– one-third of the share options after five years.
If these performance conditions are not met, the appropriate proportion of share options will lapse, and there is no opportunity for retesting.
The vesting of share options for the executive directors for the performance periods ended 31 March 2016 is shown in the table below,
which includes share options granted in respect of their services as employees rather than as, or in contemplation of their appointment as,
executive directors. Share options vesting shortly after the year end with performance periods ended 31 March 2016 have lapsed with a nil
payout because the required performance threshold was not achieved.
Performance conditions/period Performance Vesting
Outcome
Alan Clark
Domenic
De Lorenzo
Compound annualised adjusted EPS
growth, expressed in sterling, of UK RPI
plus a fixed percentage compounded
Threshold vesting:
UK RPI + 3% pa
Maximum vesting:
UK RPI + 5% pa
Performance achieved:
Five years ended 31 March 2016 UK RPI + 1.6% pa nil nil –
Performance achieved:
Three years ended 31 March 2016 UK RPI - 2.0% pa nil nil nil
Total number of share options vesting nil nil
Value at vesting nil nil
Share award plan
Outcome for the year ended 31 March 2016 (audited)
Share awards comprise performance shares and value shares to incentivise and reward executives for achieving:
– long-term financial performance (adjusted EPS growth over three years) through the vesting of performance shares; and
– long-term external relative performance (TSR outperformance of the median of a comparator group over three, four and five years) through
the vesting of value shares.
The number of shares which can be released under a value share award is dependent upon TSR outperformance compared with a comparator
group (identified on page 86) so that:
– at median or below median TSR performance, no shares will vest; but
– for every £10 million of additional shareholder value created above the median, a pre-determined fixed number of shares will vest.
The table below shows the vesting of the performance shares and value shares for the year ended 31 March 2016. Performance shares vesting
shortly after the year end with performance periods ended 31 March 2016 have lapsed with a nil payout because the required performance
threshold was not achieved.
Performance conditions/period Performance
Vesting/
multiplier
Outcome
Alan Clark
Domenic
De Lorenzo
Compound growth in adjusted EPS Threshold vesting:
6% pa
Maximum vesting:
11% pa
Performance achieved:
Three years ended 31 March 2016 -1.9% pa nil nil nil
TSR outperformance achieved:
Five years ended 31 March 20161
12.905% outperformance x £33,485m capitalisation
= £4,321m additional value
£4,321m/£10m
= 432.1
432.1 x 115
= 49,691 shares
432.1 x 50
= 21,605 shares
TSR outperformance achieved:
Three years ended 31 March 20162
3.330% outperformance x £47,580m capitalisation
= £1,584m additional value
£1,584m/£10m
= 158.4
158.4 x 41
= 6,494 shares
158.4 x 10
= 1,584 shares
Total number of share vesting 56,185 23,189
Value at vesting (including share price growth) £2,404,312 £991,859
Value at vesting (excluding share price growth)3
£1,334,049 £536,699
1
Vested 31 May 2016, share price = £42.744.
2
Vested 3 June 2016, share price = £43.166.
3
Share price at award dates are shown on page 91.
GOVERNANCEGOVERNANCE
85SABMiller plc Annual Report 2016
GOVERNANCE |Directors’ remuneration report continued
Annual report on remuneration continued
Performance conditions for share awards granted in the year commencing 1 April 2016 (audited)
The performance condition and performance target for performance share awards granted in the year commencing 1 April 2016 are:
Performance conditions Performance targets
Compound growth in adjusted EPS – in constant currency
Proportion of performance shares vesting
Threshold vesting: 6% pa
25% of maximum
Maximum vesting: 11% pa
100% of maximum
The performance condition for value share awards remains TSR outperformance of the median of a comparator group. The comparator
group was changed for performance periods commencing from 2014 to include other companies in the wider consumer goods categories
considered to be more relevant comparators than some of the smaller scale, regional, beer, and alcoholic beverage companies in the previous
comparator group.
Weighting of comparator group constituents for awards granted:
2010 to 2013 from 2014
Anheuser-Busch InBev 21% 20%
Heineken 21% 20%
Molson Coors Brewing Co 11% –
Carlsberg 11% 10%
Diageo 11% 10%
Pernod-Ricard 5% 10%
Kirin Holdings 5% 10%
Asahi Breweries 5% –
Constellation Brands 5% –
Sapporo Holdings 5% –
The Coca-Cola Company – 5%
Nestlé – 5%
Unilever – 5%
Mondelez – 5%
100% 100%
Details of executive directors’ performance shares and value shares awarded during the year ended 31 March 2016 are shown on page 89,
and those outstanding at 31 March 2016, are shown on page 91.
86 SABMiller plc Annual Report 2016
Total shareholdings of directors (audited)
The total shareholdings and shareholding requirements at 31 March 2016 are shown in the table below.
Shares held1
Options held (see table on page 90)
Executive director
Shares owned
outright
(see table below)
Shares subject to
performance
conditions (see
table on page 91)
Subject to
deferral
Owned outright
(vested and
exercisable)
Subject to
performance
conditions
Shares owned outright as
% of annualised base pay
at 31 March 2016
@ £42.562
Shareholding
requirement
(shares owned
outright as %
of annualised
base pay)2
Alan Clark3
311,608 219,061 – 636,851 525,570 1,136% 300%
Domenic
De Lorenzo4
126,355 59,065 – – 146,838 791% 200%
1
The numbers of shares shown in the table above include those held by connected persons.
2
Shares owned outright and shareholding requirement excludes any shares or share options that remain subject to performance conditions or deferral.
3
As a result of shares retained from awards vested in respect of the year ended 31 March 2016, but not received until after the year end, Alan Clark owned 341,886 shares outright at 10 June
2016, equivalent to 1,247% of base pay.
4
As a result of shares retained from awards vested in respect of the year ended 31 March 2016, but not received until after the year end, Domenic De Lorenzo owned 149,544 shares outright
at 10 June 2016, equivalent to 936% of base pay.
The company maintains a periodically updated table on its website, showing the shareholdings of the directors in accordance with the
recommendation made by the GC100 and Investor Group.
Directors’ interests in shares of the company (audited)
Director
Ordinary shares held at
31 March 2015 (or date of
appointment if later)7
Ordinary shares acquired
during the period
Ordinary shares disposed
of during the period
Ordinary shares held as at
31 March 2016 (or date of
ceasing to be a director if earlier)8
Alan Clark1,2
298,764 215,034 (202,190) 311,608
Domenic De Lorenzo3
126,355 – – 126,355
Mark Armour 3,000 – – 3,000
Dave Beran – – – –
Geoffrey Bible 92,750 – – 92,750
Dinyar Devitre4
31,125 – (1,125) 30,000
Jan du Plessis 30,000 – – 30,000
Guy Elliott5
2,000 1,114 – 3,114
Javier Ferrán – – – –
Lesley Knox 3,000 – – 3,000
John Manser 8,000 – – 8,000
Trevor Manuel – – – –
John Manzoni 8,252 – – 8,252
Dambisa Moyo 386 – – 386
Carlos Pérez Dávila – – – –
Alejandro Santo Domingo Dávila – – – –
Helen Weir6
304 2 – 306
Howard Willard – – – –
1
Alan Clark had awards vested and exercised options in respect of 215,034 shares during the year ended 31 March 2016, selling 102,190 shares to pay the subscription price and to settle the
resulting tax and social security charges, and retaining the balance of shares beneficially. Alan Clark disposed of 10,000 shares on 14 September 2015 by way of gifts, and The Clark Family
Trust, a connected person with Alan Clark, disposed of 90,000 shares on 4 March 2016 at a price of £42.06 per share.
2
On 31 May 2016 and 3 June 2016, Alan Clark’s beneficial holding increased by a total of 30,278 shares following the release to him of 56,185 shares as the result of the vesting of his 2011
and 2013 value share awards (as shown on page 85), with 25,907 shares sold to pay the resulting tax liability, retaining the balance of shares beneficially.
3
On 31 May and 3 June 2016, Domenic De Lorenzo’s beneficial holding increased by a total of 23,189 shares following the release to him of 23,189 shares as the result of the vesting of his 2011
and 2013 value share awards (as shown on page 85), with the resulting tax liability paid directly by him without the sale of shares.
4
Dinyar Devitre disposed of 1,125 shares on 26 May 2015 at a price of £35.717 per share.
5
Guy Elliott acquired 219 and 895 shares on 31 July 2015 at prices of £33.486 and £33.565 per share respectively.
6
Helen Weir acquired 2 shares on 11 September 2015 at a price of £29.708 per share as part of a dividend reinvestment plan.
7
Domenic De Lorenzo was appointed a director on 23 July 2015, and his interest in shares is shown at that date.
8
John Manser, John Manzoni, and Howard Willard retired as non-executive directors on 23 July 2015, and their interest in shares is shown at that date.
9.
The number of shares shown in the table above include those held by connected persons.
During the year ended 31 March 2016 the highest and lowest market prices for the company’s shares were £42.65 and £27.73 respectively,
and the closing market price on 31 March 2016 was £42.56.
GOVERNANCEGOVERNANCE
87SABMiller plc Annual Report 2016
GOVERNANCE |Directors’ remuneration report continued
Annual report on remuneration continued
Performance review
In accordance with the regulations, the company
is required to include a line graph showing the
company’s TSR performance compared with
an appropriate broad equity market index for
the preceding seven years. The chart compares
the company’s TSR with the FTSE 100 Total Return
Index over the period from 1 April 2009 to
31 March 2016, assuming an initial investment
of £100. The company is a constituent of the
FTSE 100 Total Return Index and, accordingly,
this is considered to be an appropriate comparison
to demonstrate the company’s relative performance.
Chief Executive remuneration table
Year 2010 2011 2012 2013 2014 2015 2016
Incumbent
Graham
Mackay
Graham
Mackay
Graham
Mackay
Graham
Mackay Alan Clark Alan Clark Alan Clark
Total remuneration ‘single figure’ (£’000) 8,515 12,713 13,728 13,910 6,463 7,072 5,873
Annual variable pay (as a % of maximum) 79% 85% 77% 62% 63% 55% 84%
LTI vesting (as a % of maximum) 100% 98% 100% 100% 87% 37% 23%
Percentage change in remuneration for the Chief Executive compared with other employees
The table below shows the percentage change in remuneration for the Chief Executive from the prior year, compared with a comparator group
of other employees of the SABMiller group based in the UK over the same time period. Given the global nature of SABMiller’s operations and the
diverse pay markets in which our employees operate, the UK employees were deemed to provide the most appropriate comparator to the Chief
Executive, who is also UK-based.
Salary and
fees
(annualised)
Taxable
benefits
Annual cash
bonus
Chief Executive (% change) +3.0% +312% +56%
UK employees (% change) +3.0% +21% +32%
Alan Clark’s taxable benefits increased for the year ended 31 March 2016, mostly due to the payment of a long service award during the year
and an increase in insurance premiums. The value of taxable benefits for UK employees increased by 21% as a result of an increase in medical
insurance premiums, which had otherwise remained fixed for the prior two years.
Payments to past directors (audited)
There were no payments to past directors, termination payments or payments for loss of office in respect of the year.
Relative importance of expenditure on pay
The table below sets out the remuneration paid to or receivable by all employees, in the years ended 31 March 2016 and 31 March 2015
compared with the distributions to shareholders. The variation in total employee pay is a function of the number of employees and the
percentage changes in their remuneration in the countries in which they are employed, and the depreciation of key currencies against the US
dollar during the year.
2016
US$m
2015
US$m % change
Total employee pay 2,235 2,491 (10)%
Dividends to shareholders 1,860 1,705 9%
Note: Spot prices
1 Apr
2009
31 Mar
2012
31 Mar
2011
31 Mar
2010
31 Mar
2013
31 Mar
2014
31 Mar
2015
31 Mar
2016
0
100
200
300
400
500
Seven-year cumulative TSR performance
Value of £100 invested 1 April 2009
SABMiller
FTSE 100
88 SABMiller plc Annual Report 2016
Scheme interests awarded during the year (audited)
On 1 June 2015, the following share options were granted and share awards conditionally allocated to executive directors, subject to the
achievement of the relevant performance conditions as disclosed on pages 90 to 91.
Executive director Award type
Number of
share options/
conditional shares
Face value of share
options and shares1
Face value of
share options and
shares as percentage
of annualised base pay
Percentage achievable if
minimum performance
is achieved
Latest
performance
period ending
Alan Clark Share options 98,169 £3,430,025 294% 25% at threshold 31 Mar 2018
Share options 49,084 £1,714,995 147% 25% at threshold 31 Mar 2020
Performance shares 73,627 £2,572,527 220% 25% at threshold 31 Mar 2018
Value shares 125 £4,367
per £10m
of additional
shareholder value
Nil at median
or below
31 Mar 2020
Domenic
De Lorenzo
Share options 49,958 £1,745,533 257% 25% at threshold 31 Mar 2018
Share options 9,991 £349,086 51% 25% at threshold 31 Mar 2020
Performance shares 29,975 £1,047,327 154% 25% at threshold 31 Mar 2018
Value shares 60 £2,096
per £10m
of additional
shareholder value
Nil at median
or below
31 Mar 2020
1
The face value of share options and performance shares has been calculated by multiplying the maximum number of shares under option and the maximum number of shares possible to vest
by the share price on the date of grant, being £34.94 on 1 June 2015.
Statement of shareholder voting
The table below sets out the result of the vote on the directors’ remuneration policy at the 2014 annual general meeting, and the vote on the
annual report on remuneration at the 2015 annual general meeting.
Votes for Votes against Votes withheld
Remuneration policy 1,111,025,026 92,388,744 178,551,996
92.32% 7.68%
Annual report on
remuneration
1,262,211,914 83,528,932 6,529,077
93.79% 6.21%
0% 25% 50% 75% 100%
92.32%
93.79%
GOVERNANCEGOVERNANCE
89SABMiller plc Annual Report 2016
Annual report on remuneration continued
GOVERNANCE |Directors’ remuneration report continued
Share options (audited)
Director
Exercisable
for
3-10 years
from
Performance
period
(year ending
31 March)
Subscription
price
£
Outstanding
as at
31 March
2015
Granted
during
the year
Exercised
during
the year
Lapsed
during
the year
Outstanding
as at
31 March
2016
Vested and
exercisable
as at
31 March
2016
Sale price/
market price
£
Alan Clark1
19 May 2006 Vested 10.61 100,000 – (100,000) – – – 42.51
18 May 2007 Vested 11.67 100,000 – – – 100,000 100,000
16 May 2008 Vested 12.50 100,000 – – – 100,000 100,000
1 Aug 2008 Vested 10.49 50,000 – – – 50,000 50,000
15 May 2009 Vested 12.31 125,250 – – – 125,250 125,250
15 May 2009 Vested 12.31 24,750 – – – 24,750 24,750
1 Jun 2010 Vested 19.51 108,550 – – – 108,550 108,550
1 Jun 2010 Vested 19.51 21,450 – – – 21,450 21,450
1 Jun 2011 Vested 22.495 65,000 – – – 65,000 65,000
1 Jun 2011 Vested 22.495 41,851 – – – 41,851 41,851
1 Jun 2011 5 years (2016) 22.495 21,450 – – – 21,4503
–
1 Jun 2012 Lapsed 23.95 134,000 – – (134,000) – –
1 Jun 2012 5 years (2017) 23.95 66,000 – – – 66,000 –
3 Jun 2013 3 years (2016) 33.30 93,800 – – – 93,8003
–
3 Jun 2013 5 years (2018) 33.30 46,200 – – – 46,200 –
2 Jun 2014 3 years (2017) 33.11 101,081 – – – 101,081 –
2 Jun 2014 5 years (2019) 33.11 49,786 – – – 49,786 –
1 Jun 2015 3 years (2018) 34.94 – 98,169 – – 98,169 –
1 Jun 2015 5 years (2020) 34.94 – 49,084 – – 49,084 –
1,249,168 147,253 (100,000) (134,000) 1,162,421 636,851
Domenic
De Lorenzo 1 Dec 2011 5 years (2016) 22.40 12,210 – – – 12,210 –
1 Jun 2012 5 years (2017) 23.95 16,500 – – – 16,500 –
3 Jun 2013 3 years (2016) 33.30 18,760 – – – 18,7603
–
3 Jun 2013 5 years (2018) 33.30 9,240 – – – 9,240 –
2 Jun 2014 3 years (2017) 33.11 15,090 – – – 15,090 –
2 Jun 2014 3 years (2017) 33.11 10,110 – – – 10,110 –
2 Jun 2014 5 years (2019) 33.11 4,979 – – – 4,979 –
1 Jun 2015 3 years (2018) 34.94 – 49,958 – – 49,958 –
1 Jun 2015 5 years (2020) 34.94 – 9,991 – – 9,991 –
86,889 59,949 – – 146,838 –
1
On 29 March 2016 Alan Clark exercised an option to purchase 100,000 shares at an option price of £10.61 per share. 51,352 shares were sold at a price of £42.51 per share with the proceeds
being used to cover the subscription price and to meet applicable income tax and social security charges. The balance of the shares were retained by him beneficially.
2
On 31 May 2016 Alan Clark and Domenic De Lorenzo were granted an option over a maximum of 123,285 shares and 66,779 shares respectively at an exercise price of £42.8275 per share,
subject to the performance conditions listed below. If there is a change of control during the year ending 31 March 2017, the number of shares vesting on a change of control will be pro-rated.
3
Share options vesting in June 2016 with performance periods ended 31 March 2016 have lapsed with a nil payout because the required performance threshold was not achieved, as shown on
page 85.
Share options granted to executive directors before 2014 have a performance condition that requires compound annualised adjusted EPS
growth, expressed in sterling, of:
– UK RPI + 3% per annum for any of the share options to vest; and
– UK RPI + 5% per annum for full vesting.
Share options granted to executive directors from 2014 have a performance condition that requires compound growth in adjusted EPS in
constant currency of:
– 6% per annum for any of the share options to vest; and
– 11% per annum for full vesting.
90 SABMiller plc Annual Report 2016
Performance shares (audited)
Director Award date
Performance
period
(year ending
31 March)
Share price at
award date
£
Outstanding
as at
31 March
2015
Awarded
during
the year
Released
during
the year
Lapsed
during
the year
Outstanding
as at
31 March
2016
Share price/
market price
£
Alan Clark2
1 Jun 2012 Lapsed 23.95 100,000 – – (100,000) –
3 Jun 2013 3 years (2016) 33.30 70,0001
– – – 70,000
2 Jun 2014 3 years (2017) 33.11 75,434 – – – 75,434
1 Jun 2015 3 years (2018) 34.94 – 73,627 – – 73,627
245,434 73,627 – (100,000) 219,061
Domenic
De Lorenzo2
3 Jun 2013 3 years (2016) 33.30 14,0001
– – – 14,000
2 Jun 2014 3 years (2017) 33.11 15,090 – – – 15,090
1 Jun 2015 3 years (2018) 34.94 – 29,975 – – 29,975
29,090 29,975 – – 59,065
1
Performance shares vesting in June 2016 with a performance period ended 31 March 2016 have lapsed with a nil payout because the required performance threshold was not achieved,
as shown on page 85.
2
On 31 May 2016 Alan Clark and Domenic De Lorenzo were each granted a performance share award over a maximum of 61,643 shares and 33,389 shares respectively, subject to the
performance conditions listed below. If there is a change of control during the year ending 31 March 2017, the number of shares vesting on a change of control will be pro-rated.
For performance share awards granted from 2011 onwards, the performance condition is compound growth in adjusted EPS (from 2014
onwards, in constant currency) of:
– 6% per annum for any performance shares to vest; and
– 11% per annum for full vesting.
Value shares (audited)
Director Award date
Share price
at award
date
£
Outstanding
as at
31 March 2015
(shares per
£10m of
additional
shareholder
value)
Awarded
during
the year
(shares per
£10m of
additional
value)
Released
during
the year
(shares per
£10m of
additional
value)
Lapsed during
the year (shares
per £10m of
additional value)
Outstanding
as at
31 March 2016
(shares per
£10m of
additional
value)
Earliest
possible
release
date
Final
vesting date
Share price/
market price
£
Alan Clark 1 Jun 2010 19.51 115 – (115) – – 1 Jun 2013 1 Jun 2015 35.74
1 Jun 2011 22.495 115 – – – 115 1 Jun 2014 1 Jun 2016
1 Jun 2012 23.95 175 – – – 175 1 Jun 2015 1 Jun 2017
3 Jun 2013 33.30 125 – – – 125 3 Jun 2016 3 Jun 2018
2 Jun 2014 33.11 125 – – – 125 2 Jun 2017 2 Jun 2019
1 Jun 2015 34.94 – 125 – – 125 1 Jun 2018 1 Jun 2020
655 125 (115) – 665
Domenic
De Lorenzo 1 Dec 2011 22.40 50 – – – 50 1 Dec 2014 1 Jun 2016
1 Jun 2012 23.95 50 – – – 50 1 Jun 2015 1 Jun 2017
3 Jun 2013 33.30 30 – – – 30 3 Jun 2016 3 Jun 2018
2 Jun 2014 33.11 30 – – – 30 2 Jun 2017 2 Jun 2019
1 Jun 2015 34.94 – 60 – – 60 1 Jun 2018 1 Jun 2020
160 60 – – 220
On 31 May 2016 Alan Clark and Domenic De Lorenzo were conditionally awarded 125 value shares and 100 value shares respectively, of which one-third are capable of vesting for every
£10 million of additional shareholder value created over three, four and five-year performance periods commencing 1 April 2016. If there is a change of control during the year ending 31 March
2017, TSR outperformance of the median of a comparator group will be measured through to change of control, and any shares vesting on a change of control will be pro-rated.
The number of shares which can be released under a value share award is dependent upon TSR outperformance compared with the median
of a comparator group (identified on page 86) over three, four and five-year performance periods:
– at median or below median TSR performance, no shares will vest; and
– for every £10 million of additional shareholder value created, a predetermined fixed number of shares will vest (as set out in the table above).
GOVERNANCEGOVERNANCE
91SABMiller plc Annual Report 2016
Annual report on remuneration continued
GOVERNANCE |Directors’ remuneration report continued
Additional shareholder value represents the amount of additional return to shareholders as a result of the company’s TSR performance
exceeding the median of the comparator group. It is calculated as the percentage change in TSR of the company, less the percentage
change in TSR of the median of the comparator group, multiplied by the company’s market capitalisation at the commencement of the
performance period. The maximum number of shares that can vest is capped at the level at which additional shareholder value at the end
of each performance period equals the market capitalisation of the company at the commencement of the performance period. The maximum
value for all participants (including executive directors) in the aggregate is therefore capped at 0.5% of additional shareholder value created for
any five-year performance period. This is the maximum theoretical percentage that can be earned in aggregate by all participants, with 99.5%
of the additional value created accruing to shareholders.
Value share awards granted before 2013 vest on the fifth anniversary of the grant date, subject to TSR outperformance, but participants may
request the release of all or part of the award from the third anniversary of the grant date. If the committee exercises its discretion to release
shares in such circumstances, the number of shares is determined based on TSR outperformance to that date, with the shares partially deferred
and released in equal instalments over the period until the fifth anniversary of the grant date. There is no opportunity for retesting against future
TSR performance, and the deferred shares are subject to forfeiture under certain circumstances should the participant’s employment terminate
before the fifth anniversary.
Value share awards granted from 2013 vest one-third on each of the third, fourth and fifth anniversaries of the grant date respectively.
Any shares are then released, based on TSR outperformance to the preceding 31 March. If the performance conditions for any award
are not achieved at the relevant date, the appropriate proportion of shares will lapse and there is no opportunity for retesting.
At 31 March 2016, TSR outperformance, additional shareholder value created, and the indicative value of shares capable of vesting
for the highest paid executive (Alan Clark) were:
Performance period commencing
1 April 2011 1 April 2012 1 April 2013 1 April 2014 1 April 2015
SABMiller’s TSR to 31 March 2016 114.963% 87.503% 46.071% 40.837% 19.701%
Comparator group median TSR to 31 March 2016 102.058% 103.698% 42.741% 30.258% 11.254%
Outperformance 12.905% nil 3.330% 10.579% 8.447%
SABMiller market capitalisation (at commencement
of the performance period)
£33,485m £37,639m £47,580m £48,459m £56,264m
Additional shareholder value created £4,321m nil £1,584m £5,126m £4,753m
Value of shares capable of vesting (at £42.56 per share) £2.1m nil £0.8m £2.7m £2.5m
Value of shares as % of additional shareholder value created 0.05% – 0.05% 0.05% 0.05%
Approval
This report complies with the requirements of the regulations. Those parts of the report that are subject to audit are identified separately.
This report and the recommendations of the committee were approved by the board on 10 June 2016 as recommended by the committee
on 16 May 2016 and will be submitted to shareholders for approval at the 2016 annual general meeting.
Signed on behalf of the board of directors by
Stephen Shapiro
Group Company Secretary
10 June 2016
92 SABMiller plc Annual Report 2016
Directors’ report
The directors have pleasure in submitting their report to shareholders,
together with the audited annual financial statements for the year
ended 31 March 2016.
Much of the information previously provided as part of the directors’
report is required to be presented as part of the strategic report, which
includes a description of the principal risks and uncertainties we face,
our development and performance during the year, our position at the
end of the year, key performance indicators, and information relating to
environmental matters, employee matters and social, community, and
human rights issues.
The directors’ report includes information required under the
Companies Act 2006, the Listing Rules, and the Disclosure and
Transparency Rules.
For the purposes of compliance with the Disclosure and Transparency
Rules, the strategic report and this directors’ report, including those
sections of the annual report incorporated by reference, constitute
a management report.
Directors
The names and biographical details of the current directors are set out
on pages 54 and 55. All the current directors served throughout the
period, except Dave Beran and Javier Ferrán who were elected as
directors at the annual general meeting on 23 July 2015, and Domenic
De Lorenzo, who was appointed as a director immediately after the
annual general meeting. John Manser, John Manzoni and Howard
Willard served as directors until their retirement on 23 July 2015.
Javier Ferrán will retire from the conclusion of the 2016 annual general
meeting. Details of the interests in shares and options of the directors
who held office during the year and any persons connected to them
are set out in the directors’ remuneration report on pages 74 to 92.
Corporate governance
The directors’ approach to corporate governance and statements of
our application of the UK Corporate Governance Code are set out in
the corporate governance report, which forms part of this directors’
report, on pages 58 to 69, in the audit committee report on pages 70
to 73 and in the directors’ remuneration report on pages 74 to 92.
Share capital
Details of the issued share capital and movement in it during the year
are provided in note 25 to the consolidated financial statements.
During the year 3,190,462 ordinary shares were purchased by the
trustee of the SABMiller Employees’ Benefit Trust (EBT) (at an average
price of £30.89 per share) which amounted to 0.19% of the issued
ordinary shares of the company, in order to ensure that the trustee
of EBT continued to hold sufficient ordinary shares to meet expected
future obligations in respect of performance share awards under the
Share Award Plan.
Annual general meeting
Our 2016 annual general meeting will be held at the InterContinental
London Park Lane, One Hamilton Place, London W1V 7QY, UK at
11.00am on Thursday 21 July 2016. Copies of the notice of this
meeting may be obtained from our website.
Dividends
An interim dividend of 28.25 US cents per share was paid to
shareholders on 4 December 2015 in respect of the year ended
31 March 2016. Details of the final dividend proposed by the board
for the year ended 31 March 2016 are set out below:
Amount of final dividend proposed by the board:
– 93.75 US cents per share.
Total proposed dividend for the year ended 31 March 2016:
– 122 US cents per share.
If approved, and the proposed acquisition of the company by a Belgian
company formed for the purposes of the recommended transaction
by AB InBev has not become effective prior to 12 August 2016, the final
dividend will be payable to shareholders on either section of the register
on 5 August 2016 in the following way:
Dividend payable on:
12 August 2016.
Currency of payment:
– South African rands – to shareholders on the RSA section
of the register;
– US dollars – to shareholders shown as having an address
in the USA and recorded on the UK section of the register
(unless mandated otherwise); and
– Pounds sterling – to all other shareholders on the UK section
of the register.
Ex-dividend dates:
– 3 August 2016 for shares traded on the JSE Limited, South Africa.
– 4 August 2016 for shares traded on the London Stock Exchange
(LSE).
The rate of exchange for conversion from US dollars will be calculated
on 20 July 2016 and published on the RNS of the LSE and the SENS
of the JSE Limited on 21 July 2015.
Shareholders registered on the RSA section of the register will, unless
a shareholder qualifies for an exemption, be subject to a dividend
withholding tax at a rate of 15%. The dividend withholding tax is only
of direct application to shareholders registered on the RSA section
of the register, who should direct any questions about the application
of the dividend withholding tax to Computershare Investor Services
(Pty) Limited, tel: +27 11 373 0004.
Note 9 to the consolidated financial statements discloses
dividends waived.
Purchase of own shares
At the last annual general meeting, shareholder authority was
obtained for us to purchase our own shares up to a maximum of
10% of the number of ordinary shares in issue as at 1 June 2015.
This authority is due to expire at the earlier of the next annual general
meeting or 23 October 2016, and remains exercisable provided that
certain conditions relating to the purchase are met. The notice of
annual general meeting proposes that shareholders approve a
resolution updating and renewing the authority allowing us to
purchase our own shares.
We did not repurchase any shares during the year for the purpose
of cancellation, holding in treasury, or for any other purpose.
GOVERNANCEGOVERNANCE
93SABMiller plc Annual Report 2016
Political donations
It remains our policy not to make donations to political organisations
in the European Union. Other political donations are only made by
exception, and where permitted by local laws, and must be consistent
with the support of multi-party democracy.
Our subsidiary in Mozambique made a donation totalling US$142,914
to Mozambique’s Ministry of Foreign Affairs, as a contribution to the
costs of the 2015 Presidential inauguration ceremony.
Employment, environmental and social policies
Our aim is to be the employer of choice in each country in which our
group companies operate. To achieve this, each operating company
designs employment policies which attract, retain and motivate
the highest quality of staff. We are committed to an active equal
opportunities policy, from recruitment and selection, through training
and development, appraisal and promotion to retirement. Within the
constraints of local law, it is our policy to ensure that everyone is
treated equally, regardless of gender, colour, nationality, ethnic origin,
race, disability, marital status, sexual orientation, religion or trade union
affiliation. We value the benefits of employing people of different races,
genders, creeds and backgrounds. If employees become disabled,
efforts are made to allow them to continue in their role, or a suitable
alternative role, through making reasonable adjustments. Full
consideration is given to applications for employment from disabled
persons, having regard to their particular aptitudes and abilities.
We are committed to regular communication and consultation with
our employees and we encourage employee involvement in our
performance. We have distribution of real time news through our
intranet, which is available to businesses to help inform employees
about what is happening in our global operations. Further information
is provided to employees at regional and country level by way of a mix
of channels such as newsletters, employees’ boards, meetings and
electronic communication.
Certain employees throughout the group are eligible to participate
in the group’s share incentive plans.
The sustainable development review on pages 48 to 51 gives an
overview of the progress of the implementation of our sustainable
development ambition, Prosper, and of the impact of our business
on the environment. More detailed information is provided in our 2016
sustainable development report, available on our website.
Research and development
To ensure improved overall operational effectiveness, we place
considerable emphasis on research and development in our
global technical activities. This enables us to develop new products,
packaging, processes and manufacturing technologies. Continued
progress was made in our research in the key areas of raw materials,
brewing, flavour stability, packaging materials and energy and
water saving.
Greenhouse gas emissions
Disclosures concerning greenhouse gas emissions required by law
are included in the strategic report, on page 50.
Overseas branches
SABMiller plc does not have any branches registered overseas.
Substantial shareholdings
As at 7 June 2016, we had received the following notifications of
interests in voting rights of the issued share capital of the company
pursuant to Rule 5.1.2 of the Disclosure and Transparency Rules:
Date of
notification
Number
of shares
Percentage
of issued
share capital1
Altria Group, Inc. 29 June 2012 430,000,000 26.99
BevCo Ltd. 2 June 2014 225,000,000 13.99
Public Investment Corporation 11 March 2015 50,780,462 3.14
The Companies Act 2006 requires disclosure of persons with
significant direct or indirect holdings of securities as at the year end.
At the year-end we were aware of the following shareholdings of
3.00% or more:
Percentage
of issued
share capital1
Altria Group, Inc. 26.52
BevCo Ltd 13.88
BlackRock Inc. 3.93
1
Excluding shares held in treasury.
Directors’ indemnities
The company has granted rolling indemnities to the directors,
uncapped in amount, in relation to certain losses and liabilities which
they may incur in the course of acting as directors of the company
or of one or more of its subsidiaries and associates. The company
secretary has also been granted an indemnity, on similar terms,
covering his role as group company secretary of the company, and as
a director or as company secretary of one or more of the company’s
subsidiaries and associates. The board believes that it is in the best
interests of the group to attract and retain the services of the most
able and experienced directors and officers by offering competitive
terms of engagement, including the granting of such indemnities.
These indemnities are categorised as qualifying third-party indemnity
provisions as defined by Section 234 of the Companies Act 2006.
They will continue in force for the benefit of directors and officers
in respect of their periods of office.
Financial instruments
Information on our financial risk management objectives and
policies and details of our exposure to price risk, credit risk, liquidity
risk and cash flow risk are contained in note 21 to the consolidated
financial statements.
Future developments
Details of likely future developments in the business of the group
are included in the strategic report.
Other disclosures required by the Companies Act
and the Disclosure and Transparency Rules
We do not have any contractual or other arrangements that individually
are essential to the business of the company or the group as a whole.
The structure of our share capital, including the rights and obligations
attaching to each class of share and the percentage of the share
capital that each class of share comprises, is set out in note 25 to the
consolidated financial statements. There are no securities of the
company that grant the holder special control rights.
Directors’ report continued
GOVERNANCE |Directors’ report
94 SABMiller plc Annual Report 2016
At 31 March 2016 our employees’ benefit trust (EBT) held 11,476,675
ordinary shares in the company and our Employee Share Purchase
Plan Trust (ESPPT) held 12,153 shares. By agreement with the
company, voting rights attached to the EBT are not exercised unless
shares are beneficially owned by a participant and that participant has
instructed the Trustee to vote. As at 31 March 2016 there were no
shares beneficially owned by a participant in our EBT. All the shares in
our ESPPT are eligible to vote except for 22 shares held by the trustee
which were unallocated and the trustee has agreed that the voting
rights attached to those shares will not be exercised.
The directors are responsible for the management of the business of
the company and may exercise all the powers of the company subject
to the articles of association and relevant statutes. Powers of the
directors relating to the issuing and buying back of shares are set out
in the articles of association. These powers are subject to renewal by
our shareholders each year at the annual general meeting.
Our articles of association give the board of directors power to appoint
directors. The articles of association may be amended by special
resolution of the shareholders.
Directors appointed by the board are required to submit themselves
for election by the shareholders at the next annual general meeting.
Additionally, as disclosed in the corporate governance report on pages
58 to 69, Altria Group, Inc. (Altria) and BevCo Ltd (BevCo) have power
under their respective relationship agreements with the company
to nominate directors for appointment to the board and certain
committees. These relationship agreements also regulate orderly
marketing processes applicable in relation to any disposal of shares
by Altria and BevCo.
A change of control of the company would give The Coca-Cola
Company certain rights under its bottling agreements with various
subsidiaries of the company, and in certain limited circumstances may
give China Resources Beer (Holdings) Company Limited the ability to
exercise certain rights under a shareholders’ agreement in relation to
our associate CR Snow. A change of control may also give the Molson
Coors Brewing Company the ability to exercise certain rights under
the MillerCoors operating agreement, and would result in certain
minority protection rights contained in our relationship agreement with
the Anadolu Group and Anadolu Efes ceasing to apply. The Anheuser-
Busch InBev SA/NV transaction, if completed, will trigger some of the
various change of control provisions mentioned above. We also have
a number of facility agreements with banks which contain provisions
giving rights to the banks upon a change of control of the company.
The company does not have any agreements with any director
or officer that would provide compensation for loss of office or
employment resulting from a takeover.
Our articles of association allow directors, in their absolute discretion,
to refuse to register the transfer of a share in certificated form which is
not fully paid or the transfer of a share in certificated form on which
the company has a lien. If that share has been admitted to the Official
List, the board may not refuse to register the transfer if this would
prevent dealings in our shares from taking place on an open and
proper basis. The board may also refuse to register a transfer of a
share in certificated form unless the instrument of transfer is lodged,
duly stamped (if stampable), at the address at which our register is
held or at such other place as the directors may appoint, and (except
in the case of a transfer by a financial institution where a certificate
has not been issued in respect of the share) is accompanied by the
certificate for the share to which it relates and such other evidence
as the directors may reasonably require to show the right of the
transferor to make the transfer, is in respect of only one class of share
and is in favour of not more than four transferees jointly.
Transfers of shares in uncertificated form must be made in
accordance with, and subject to, the Uncertificated Securities
Regulations (the Regulations), the facilities and requirements of the
relevant CREST system and such arrangements as the board may
determine in relation to the transfer of certificated shares (subject
to the Regulations).
Transfers of shares listed on the JSE in uncertificated form must be
made in accordance with, and subject to, the Securities Services
Act 2004, the Rules and Directives of the JSE and STRATE Ltd.
Certificated shares may be transferred prior to dematerialisation,
but share certificates must be dematerialised prior to trading in the
STRATE environment.
Pursuant to our code for securities transactions, directors and persons
discharging managerial responsibilities, and employees may, in certain
circumstances, require approval to deal in the company’s shares.
Unless the directors otherwise determine, no shareholder is entitled
in respect of any share held by them to vote either personally or
by proxy at a shareholders’ meeting or to exercise any other right
conferred by membership in relation to shareholders’ meetings if any
call or other sum presently payable by them to the company in respect
of that share remains unpaid. In addition, no shareholder will be
entitled to vote if they have been served with a notice after failing to
provide the company with information concerning interests in those
shares required to be provided under Section 793 of the Companies
Act 2006. Restrictions on the rights of the holders of convertible
shares and deferred shares are set out in note 25 to the consolidated
financial statements (although there are no convertible shares currently
in issue).
Votes may be exercised in person, by proxy, or in relation to corporate
members, by a corporate representative. The deadline for delivering
proxy forms is 48 hours before the time for holding the meeting.
Going concern
The directors have reviewed the group’s performance for the year
and the principal risks it faces, together with the budget and cash
flow forecasts, in particular with reference to the period to the end
of September 2017, and the application of reasonably possible
sensitivities associated with these forecasts. On the basis of this
review, and in light of the current financial position and existing
committed borrowing facilities, the directors are satisfied that the
group has adequate resources to continue in operational existence
and therefore have continued to adopt the going concern basis in
preparing the consolidated financial statements.
Viability statement
The strategic report, set out on pages 2 to 53, includes information
about SABMiller’s strategy, financial condition, cash flows and liquidity,
as well as the factors, including the principal risks, likely to affect its
future development.
The directors have carried out a robust assessment of the principal
risks, including those that would threaten its business model, future
performance, solvency or liquidity. These risks and the ways they are
being managed and mitigated are summarised on pages 16 and 17.
GOVERNANCEGOVERNANCE
95SABMiller plc Annual Report 2016
In accordance with provision C.2.2 of the Code, the directors have
assessed the prospects of the company over a period significantly
longer than 12 months. The directors believe that a three year
assessment period is most appropriate as it aligns with our normal
and well established three year business planning processes. This
three year period balances the long-term nature of investments in
the brewing industry with an assessment of the variability of the key
drivers of near-term business performance as well as external factors
and regulation impacting the business.
The directors’ assessment included a review of the financial impact
of severe but plausible scenarios that could lessen the viability of the
company, and an assumed inability to access the capital markets
to refinance maturing term debt, and the likely effectiveness of the
potential mitigations that management reasonably believes would
be available to the company over this period.
Based on this assessment, and taking into account the current
position and principal risks, the directors have a reasonable
expectation that the company will be able to continue in operation
and meet its liabilities as they fall due over the three years.
In assessing the prospects of the company, the directors noted that
such assessment is subject to a degree of uncertainty that can be
expected to increase looking out over time and, accordingly, that
future outcomes cannot be guaranteed or predicted with certainty.
Directors’ responsibility statement
The directors are responsible for preparing the annual report, the
directors’ remuneration report and the financial statements in
accordance with applicable law and regulations.
Company law requires the directors to prepare financial statements
for each financial year. The directors have prepared the consolidated
financial statements in accordance with International Financial
Reporting Standards (IFRSs) as adopted by the European Union, and
the parent company financial statements in accordance with United
Kingdom Generally Accepted Accounting Practice (United Kingdom
Accounting Standards) and applicable law.
Under company law the directors must not approve the consolidated
financial statements unless they are satisfied that they give a true and
fair view of the state of affairs of the group and company and of the
profit or loss of the group for that period.
In preparing these financial statements, the directors are required to:
– select suitable accounting policies and then apply them
consistently;
– make judgements and accounting estimates that are reasonable
and prudent;
– state whether IFRSs as adopted by the European Union and
applicable UK Accounting Standards have been followed, subject
to any material departures disclosed and explained in the group
and parent company financial statements respectively; and
– prepare the financial statements on the going concern basis unless
it is inappropriate to presume that the group and the company will
continue in business.
The directors are responsible for keeping adequate accounting
records that are sufficient to show and explain the transactions of the
company and group and disclose with reasonable accuracy at any
time the financial position of the company and group and enable them
to ensure that the company and consolidated financial statements and
the directors’ remuneration report comply with the Companies Act
2006 and, as regards the consolidated financial statements, Article 4
of the IAS Regulation. They are also responsible for safeguarding the
assets of the company and group and hence for taking reasonable
steps for the prevention and detection of fraud and other irregularities.
A copy of the consolidated and company financial statements is
placed on the company’s website. The directors are responsible for
the maintenance and integrity of the statutory and audited information
on the company’s website. Legislation in the United Kingdom
governing the preparation and dissemination of financial statements
may differ from legislation in other jurisdictions.
The directors consider that the annual report and accounts, taken
as a whole, is fair, balanced and understandable and provides the
information necessary for shareholders to assess the group’s position
and performance, business model and strategy.
Each of the directors, whose names and functions are listed on pages
54 and 55 of this annual report, confirms that, to the best of his or
her knowledge:
– the consolidated financial statements, which have been prepared in
accordance with IFRSs as adopted by the EU, the Companies Act
2006 and Article 4 of the IAS Regulation, give a true and fair view of
the assets, liabilities, financial position and profit of the group; and
– the management report contained in this annual report includes a
fair review of the development and performance of the business and
the position of the group, together with a description of the principal
risks and uncertainties that it faces.
The directors in office at the date of this report have each
confirmed that:
– so far as the director is aware, there is no relevant audit information
of which the group’s auditors are unaware; and
– he or she has taken all the steps that he or she ought to have taken
as a director in order to make himself or herself aware of any
relevant audit information and to establish that the group’s auditors
are aware of that information.
Post balance sheet events
In May 2016 the South African Competition Tribunal approved,
with agreed conditions, the formation of Coca-Cola Beverages Africa,
Africa’s largest soft drinks operation. The transaction is expected
to complete in early July 2016.
Stephen Shapiro
Group Company Secretary
For and on behalf of the board of SABMiller plc
10 June 2016
GOVERNANCE |Directors’ report continued
Directors’ report continued
96 SABMiller plc Annual Report 2016
In accordance with Listing Rule 9.8.4 R the table below gives the location of information required by that Rule to be included in the annual report
and accounts.
Listing Rule Information Location
LR 9.8.4 (1) Amount of interest capitalised and amount and treatment
of tax relief.
Not applicable: no interest capitalised.
LR 9.8.4 (2) Information required by Listing Rule 9.2.18 regarding the
prior publication of unaudited financial information.
Not applicable: no relevant information published in
advance of this annual report and accounts.
LR 9.8.4 (3) Rule deleted. Not applicable.
LR 9.8.4 (4) Long-term incentive schemes where the only participant
is a director or prospective director of the company and
the arrangement is established specifically to facilitate the
recruitment or retention of the director.
Not applicable: no such arrangements exist.
LR 9.8.4 (5) Arrangements under which a director has waived or
agreed to waive emoluments from the company or any
subsidiary undertaking.
In accordance with our agreement with Altria, Howard
Willard, as an executive director of Altria, did not receive
a director’s fee from SABMiller (see page 82).
LR 9.8.4 (6) Agreements with a director to waive future emoluments. Not applicable: no such agreement exists.
LR 9.8.4 (7) Details of shares allotted during the period under review
which have not been allotted to existing shareholders in
proportion to their shareholdings and which have not
been specifically authorised by the company’s
shareholders.
Not applicable: the only shares that have been allotted
during the period have been to satisfy the exercise of
options under various share incentive plans as
approved by the company’s shareholders. See note 25
to the consolidated financial statements for further
details of these allotments.
LR 9.8.4 (8) Shares allotted in major subsidiary undertakings during
the period under review which have not been allotted to
existing shareholders in proportion to their shareholdings.
Not applicable: no individual subsidiary is a major
subsidiary undertaking as defined by the Listing Rules.
LR 9.8.4 (9) Details of any parent undertaking’s participation in any
placing during the period under review.
Not applicable: SABMiller does not have a parent
undertaking.
LR 9.8.4 (10) Details of any contract of significance (as defined by the
Listing Rules) existing between SABMiller, or any of its
subsidiaries, in which either a director is materially
interested or one of the parties is a controlling
shareholder of SABMiller.
Not applicable: no such contract of significance exists.
LR 9.8.4 (11) Details of any contract for the provision of services to
SABMiller, or any of its subsidiaries, by a controlling
shareholder.
Not applicable: SABMiller does not have a controlling
shareholder.
LR 9.8.4 (12) Details of any arrangement under which a shareholder
has waived or agreed to waive any dividends.
The trustees of two employees’ benefit trusts have
elected to waive dividends, except in circumstances
where they may be holding shares beneficially owned
by participants. See notes 9 and 26 to the consolidated
financial statements.
LR 9.8.4 (13) Details of any arrangement under which a shareholder
has agreed to waive future dividends.
As noted above the trustees of the employees’ benefit
trusts have elected to waive dividends, except in
circumstances where they may be holding shares
beneficially owned by participants. See notes 9 and 26
to the consolidated financial statements.
LR 9.8.4 (14) Agreements with any controlling shareholder. Not applicable: SABMiller does not have a controlling
shareholder.
GOVERNANCEGOVERNANCE
97SABMiller plc Annual Report 2016
FINANCIAL STATEMENTS
Independent auditors’ report
to the members of SABMiller plc
Report on the financial statements
Our opinion
In our opinion:
– SABMiller plc’s consolidated financial statements and company
financial statements (the financial statements) give a true and fair
view of the state of the group’s and of the company’s affairs as at
31 March 2016 and of the group’s profit and cash flows for the year
then ended;
– the consolidated financial statements have been properly prepared
in accordance with International Financial Reporting Standards
(IFRSs) as adopted by the European Union;
– the company financial statements have been properly prepared in
accordance with United Kingdom Generally Accepted Accounting
Practice; and
– the financial statements have been prepared in accordance with
the requirements of the Companies Act 2006 and, as regards the
consolidated financial statements, Article 4 of the IAS Regulation.
What we have audited
SABMiller plc’s financial statements comprise:
– the consolidated income statement and the consolidated statement
of comprehensive income for the year ended 31 March 2016;
– the consolidated and company balance sheets as at 31 March 2016;
– the consolidated cash flow statement for the year then ended;
– the consolidated and company statements of changes in equity
for the year then ended; and
– the notes to the consolidated and company financial statements,
which include a summary of significant accounting policies and other
explanatory information.
Certain required disclosures have been presented elsewhere in the
Annual Report, rather than in the notes to the financial statements.
These are cross-referenced from the financial statements and are
identified as audited.
The financial reporting framework that has been applied in the
preparation of the consolidated financial statements is IFRSs as
adopted by the European Union and applicable law. The financial
reporting framework that has been applied in the preparation of
the company financial statements is United Kingdom Accounting
Standards, comprising FRS 101 ‘Reduced Disclosure Framework’,
and applicable law (United Kingdom Generally Accepted
Accounting Practice).
Our audit approach
Overview
Materiality − Overall group materiality: US$230 million which
represents approximately 5% of consolidated
profit before tax and exceptional items included
within operating profit.
Audit scope – The group is structured into five geographic
segments and one corporate segment. Each
geographic segment is a consolidation of a
number of country-based operating businesses.
We identified three segments (Latin America,
Africa and Corporate), three country-based
operating businesses (Poland, Czech Republic
and Australia) and one joint venture (MillerCoors)
which, in our view, required an audit of their
complete financial information. Specified audit
procedures were also performed on certain of
the group’s associates (Castel, CR Snow and
Anadolu Efes).
– Taken together, the components at which audit
work was performed accounted for 73% of
consolidated revenue, 72% of consolidated
profit before tax and 76% of consolidated profit
before tax and exceptional items.
Areas of focus – Recoverability of the carrying value of the
Australian cash generating unit (CGU).
– Carrying value of the investment in the Angolan
associate.
– Provisions for uncertain tax positions.
– Classification of exceptional items.
The scope of our audit and our areas of focus
We conducted our audit in accordance with International Standards
on Auditing (UK and Ireland) (ISAs (UK & Ireland)).
We designed our audit by determining materiality and assessing the risks
of material misstatement in the financial statements. In particular, we
looked at where management made judgements, for example in respect
of significant accounting estimates that involved making assumptions
and considering future events that are inherently uncertain. Consistent
with all of our audits, we also addressed the risk of management override
of internal controls, including evaluating whether there was evidence of
bias by management that represented a risk of material misstatement
due to fraud, and the risk of fraud in revenue recognition. Procedures
designed to address these risks included testing of material journal
entries and post-close adjustments, testing and evaluating
management’s key accounting estimates for reasonableness and
consistency, undertaking cut-off procedures to check proper cut-off
of revenue and expenses and testing the occurrence and accuracy
of revenue transactions. In addition, we incorporate an element
of unpredictability into our audit work each year.
The risks of material misstatement that had the greatest effect on our
audit, including the allocation of our resources and effort, are identified
as areas of focus in the table below. We have also set out how we
tailored our audit to address these specific areas in order to provide
an opinion on the financial statements as a whole. Any comments we
make on the results of our procedures should be read in this context.
This is not a complete list of all risks identified by our audit.
98 SABMiller plc Annual Report 2016
Area of focus How our audit addressed the area of focus
Recoverability of the carrying value of the
Australian CGU
As required by applicable accounting standards in
relation to goodwill, management conducts an impairment
review on an annual basis to identify if the carrying values
of goodwill and associated assets are considered
to be impaired.
We specifically focused on the Australian CGU given
the size of the goodwill balance, and because the
assessment of value involves subjective judgements which
are highly sensitive to small changes in assumptions.
Management determines the recoverable amount of the
Australian CGU utilising a discounted cash flow model with
five-year projections and a terminal value. Key assumptions
within this model include net producer revenue (NPR)
and associated estimates of short-term EBITA growth,
long-term growth rate, and discount rate.
Despite continued decline in the local beer category during
the year, growth has been achieved through the successful
execution of a number of initiatives, increased market share
and improved customer relationships.
As a result of its assessment, management estimated the
recoverable amount is greater than the carrying value.
Refer to the audit committee review of areas of significant
judgement (page 71) and goodwill note 10.
We satisfied ourselves that it was appropriate to use fair value less costs to dispose
(FVLCD) as the basis for determining the recoverable amount and verified the
mathematical accuracy of the cash flow model used to estimate FVLCD.
We considered the accuracy of management’s forecasting process by comparing
budgeted results to actual performance of the Australian business.
We assessed the consistency of the assumptions used in management’s cash flow
forecasts with those a market participant would use when valuing the business.
As part of this process we disaggregated and understood the individual cash flow
components such as developments in the Australian beer category, Carlton and
United Breweries’ market share, the drivers of NPR growth projections such as price
and mix, costs and the resultant EBITA forecasts. This included comparing inputs
to the business’s own forecasts based on latest internal board approved budgets
and external market data. We also assessed the risks associated with achieving
the forecast, which provided data points on which to sensitise management’s
assumptions over the first five years of the model.
We compared the discount and long-term growth rates used with market information
and determined that they all fall within a range of external data.
We satisfied ourselves that the assumptions used in determining management’s
estimate of the recoverable amount were reasonable.
We also considered the EBITDA multiple implied by management’s estimate and
determined that it falls within a range of independently derived data.
Our sensitivity analysis highlighted that the model continues to be sensitive to
a combination of changes in key assumptions. Any reasonably possible change
in these assumptions could reduce headroom and may result in an impairment.
We satisfied ourselves that this was appropriately highlighted within the disclosures
in note 10.
Carrying value of the investment in the
Angolan associate
The devaluation of the Angolan kwanza, liquidity
restrictions and a deterioration in macroeconomic
conditions in the second half of the year led to a significant
downscaling of Castel’s business within Angola. Based on
these factors, management determined that an impairment
trigger existed and accordingly assessed the carrying value
of the group’s investment in its Angolan associate.
The recoverable amount for the business, which was a key
determinant of the recoverable value of the investment, was
based on a discounted cash flow model involving five-year
projections with a terminal value. Key assumptions within
this model include estimates of short-term growth,
long-term growth rate and discount rate.
As a result of the assessment management has recorded
an impairment charge of US$372 million in relation to the
investment in associate in addition to the recognition of the
group’s share of Castel’s impairment and related charges.
We specifically focused on the Angolan assessment given
the quantum of the impairment charge, the economic
uncertainties and the judgemental nature of the future cash
flow forecasts.
Refer to the audit committee review of areas of significant
judgement (page 71) and investments in associates note 14.
We verified the mathematical accuracy of the cash flow model used to support the
recoverable amount and determine the impairment charge.
We assessed management’s future cash flow forecasts by comparing them to
latest internal board approved plans and considering them in light of macroeconomic
indicators and production forecasts, recognising that the operations have been
significantly scaled down. We also assessed the reasonableness of the country
discount and long-term growth rates used and determined that they were within a
range of independently derived data and the model was not sensitive to reasonably
possible changes in these assumptions.
The significant decline in the recoverable amount is primarily driven by a decrease in
forecast profitability. We sensitised the cash flows to illustrate the impact of increased
profitability compared to plan and satisfied ourselves that the impairment charge was
appropriate given the deterioration in the macroeconomic environment and the
downscaling of Castel’s operations within Angola.
We satisfied ourselves that the assumptions used to determine the recoverable value
of the investment were reasonable.
We also satisfied ourselves that the impairment was appropriately highlighted and
disclosed in note 14.
99SABMiller plc Annual Report 2016
FINANCIALSTATEMENTS
FINANCIAL STATEMENTS
Independent auditors’ report to the members of SABMiller plc continued
Area of focus How our audit addressed the area of focus
Provisions for uncertain tax positions
Due to the group operating across a number of different
tax jurisdictions it is subject to periodic challenges
by local tax authorities on a range of tax matters during
the normal course of business including transaction
related tax matters and transfer pricing arrangements
where centralised functions support a number of
different countries.
Where the amount of tax payable or recoverable is
uncertain, the directors establish provisions based on
their judgement of the probable amount of the liability,
or recovery.
We focused on these judgements in assessing the
quantification and likelihood of the potential exposures
and therefore the level of provisions required against them.
In particular we focused on the impact of recent rulings
and the status of ongoing local tax authority audits.
Refer to the audit committee review of areas of significant
judgement (page 72).
We obtained a detailed understanding of the potential consequences of the group’s
tax policies and the status of the ongoing local tax authority audits. We assessed key
technical tax issues and risks related to business and legislative developments using,
where applicable, our local and international specialised tax knowledge.
We obtained explanations regarding the tax treatment applied to material transactions
and arrangements and the corresponding provisions recorded. We obtained
corroborative evidence supporting these explanations, including reading
communications with local tax authorities and copies of tax advice obtained by
management from its external tax advisers.
We also challenged the tax positions taken for each material exposure, in particular
where there have been significant developments with local tax authorities, and satisfied
ourselves that relevant provisions were appropriate.
Classification of exceptional items
The group has historically had significant levels of
exceptional items which are disclosed separately within the
income statement and are excluded from management’s
reporting of the underlying results of the business. In the
year the group identified US$556 million of net exceptional
items within operating profit comprising charges of
US$585 million and credits of US$29 million.
The treatment of exceptional items is explained
within the group accounting policy. In the year exceptional
items primarily relate to impairments and other related
charges in respect of the group’s investment in Angola
and costs associated with the proposed Anheuser-Busch
InBev transaction.
We focused on this area because the classification of
exceptional items requires judgement and they are also
excluded from the calculation of elements of executive
remuneration. Consistency in the identification and
presentation of these items is also important to ensure
comparability of year on year reporting within the
Annual Report.
Refer to the audit committee review of areas of significant
judgement (page 72).
We substantiated the nature and quantum of individual items to appropriate
corroborating evidence.
We considered whether the classification of individual items as exceptional
was consistent with the group’s accounting policy and treatment in prior years
where applicable.
We considered whether the group has taken a balanced approach to disclosure
of these items, checking that exceptional one-off items of income were treated
consistently with one-off items of cost.
Based on our procedures, we were satisfied that the treatment and classification
of these items was consistent with prior years and in line with the group’s policy.
100 SABMiller plc Annual Report 2016
How we tailored the audit scope
We tailored the scope of our audit to ensure that we performed
enough work to be able to give an opinion on the financial statements
as a whole, taking into account the geographic structure of the group,
the accounting processes and controls, and the industry in which the
group operates.
The group is structured in five geographic segments being Latin
America, Africa, Asia Pacific, Europe and North America. A sixth
corporate head office segment is managed at a group level. Each
geographic segment is a consolidation of a number of country-based
operating businesses, regional and central functions and the group’s
interests in associates and joint ventures within that geographical region.
Based on this, we determined the appropriate segment and operating
businesses to perform work over based on factors such as the size of
the balances, the areas of focus as noted above, known or historical
accounting issues and the desire to include some unpredictability in
our audit procedures.
We considered the type of work that needed to be performed on these
segments and operating businesses by us, as the group engagement
team, or by component auditors within PwC UK and from other PwC
network firms and other firms operating under our instruction. Where the
work was performed by component auditors, we determined the level
of involvement we needed to have in the audit work at those segments
or operating businesses to be able to conclude whether sufficient
appropriate audit evidence had been obtained as a basis for our opinion
on the consolidated financial statements as a whole.
We identified three segments (Latin America, Africa and Corporate),
three country-based operating businesses (Poland, Czech Republic
and Australia) and one joint venture (MillerCoors) which, in our view,
required an audit of their complete financial information. Specified audit
procedures were also performed on certain of the group’s associates
(Castel, CR Snow and Anadolu Efes). This, together with procedures
performed on regional and central functions and at the group level,
accounted for 73% of consolidated revenue, 72% of consolidated profit
before tax and 76% of consolidated profit before tax and exceptional
items. At the group level, we also carried out analytical and other
procedures on the financial information not covered by the procedures
described above.
The involvement of the group engagement team in the work of the
component auditors included site visits, conference calls, meetings with
local management, review of work papers, attendance at audit clearance
meetings, and other forms of communication as considered necessary
depending on the significance of the component and the extent of
accounting and audit issues arising.
Materiality
The scope of our audit was influenced by our application of materiality.
We set certain quantitative thresholds for materiality. These, together
with qualitative considerations, helped us to determine the scope of our
audit and the nature, timing and extent of our audit procedures on the
individual financial statement line items and disclosures and in evaluating
the effect of misstatements, both individually and on the financial
statements as a whole.
Based on our professional judgement, we determined materiality for the
financial statements as a whole as follows:
Overall group
materiality
US$230 million (2015: US$250 million).
How we
determined it
Approximately 5% of profit before tax (US$4,074 million),
adjusted for exceptional items included within
operating profit (US$556 million).
Rationale for
benchmark
applied
We considered this adjusted measure to be the most
relevant in assessing the recurring financial
performance of the group.
We agreed with the audit committee that we would report to them
misstatements identified during our audit above US$20 million (2015:
US$20 million) as well as misstatements below that amount that,
in our view, warranted reporting for qualitative reasons.
Going concern
Under the Listing Rules we are required to review the directors’
statement, set out on page 95, in relation to going concern.
We have nothing to report having performed our review.
Under ISAs (UK & Ireland) we are required to report to you if we
have anything material to add or to draw attention to in relation to the
directors’ statement about whether they considered it appropriate to
adopt the going concern basis in preparing the financial statements.
We have nothing material to add or to draw attention to.
As noted in the directors’ statement, the directors have concluded
that it is appropriate to adopt the going concern basis in preparing the
financial statements. The going concern basis presumes that the group
and company have adequate resources to remain in operation, and
that the directors intend them to do so, for at least one year from the
date the financial statements were signed. As part of our audit we
have concluded that the directors’ use of the going concern basis
is appropriate.
However, because not all future events or conditions can be predicted,
these statements are not a guarantee as to the group’s and company’s
ability to continue as a going concern.
Other required reporting
Consistency of other information
Companies Act 2006 opinion
In our opinion, the information given in the strategic report and the
directors’ report for the financial year for which the financial statements
are prepared is consistent with the financial statements.
ISAs (UK & Ireland) reporting
Under ISAs (UK & Ireland) we are required to report to you if, in
our opinion:
− information in the Annual Report is:
– materially inconsistent with the information in the audited financial
statements; or
– apparently materially incorrect based on, or materially inconsistent
with, our knowledge of the group and company acquired in the
course of performing our audit; or
– otherwise misleading.
We have no exceptions to report arising from this responsibility.
– the statement given by the directors on page 96, in accordance
with provision C.1.1 of the UK Corporate Governance Code (the
Code), that they consider the Annual Report taken as a whole to
be fair, balanced and understandable and provides the information
necessary for members to assess the group’s and company’s
position and performance, business model and strategy is
materially inconsistent with our knowledge of the group and
company acquired in the course of performing our audit.
We have no exceptions to report arising from this responsibility.
– the section of the Annual Report on page 71, as required by
provision C.3.8 of the Code, describing the work of the audit
committee does not appropriately address matters communicated
by us to the audit committee.
We have no exceptions to report arising from this responsibility.
101SABMiller plc Annual Report 2016
FINANCIALSTATEMENTS
FINANCIAL STATEMENTS
Independent auditors’ report to the members of SABMiller plc continued
The directors’ assessment of the prospects of the
group and of the principal risks that would threaten
the solvency or liquidity of the group
Under ISAs (UK & Ireland) we are required to report to you if we have
anything material to add or to draw attention to in relation to:
– the directors’ confirmation on page 16 of the Annual Report, in
accordance with provision C.2.1 of the Code, that they have carried
out a robust assessment of the principal risks facing the group,
including those that would threaten its business model, future
performance, solvency or liquidity.
We have nothing material to add or to draw attention to.
– the disclosures in the Annual Report that describe those risks
and explain how they are being managed or mitigated.
We have nothing material to add or to draw attention to.
– the directors’ explanation on pages 95 and 96 of the Annual
Report, in accordance with provision C.2.2 of the Code, as to
how they have assessed the prospects of the group, over what
period they have done so and why they consider that period
to be appropriate, and their statement as to whether they have
a reasonable expectation that the group will be able to continue
in operation and meet its liabilities as they fall due over the period
of their assessment, including any related disclosures drawing
attention to any necessary qualifications or assumptions.
We have nothing material to add or to draw attention to.
Under the Listing Rules we are required to review the directors’
statement that they have carried out a robust assessment of the principal
risks facing the group and the directors’ statement in relation to the
longer-term viability of the group.
Our review was substantially less in scope than an audit and only
consisted of making inquiries and considering the directors’ process
supporting their statements; checking that the statements are in
alignment with the relevant provisions of the Code; and considering
whether the statements are consistent with the knowledge acquired by
us in the course of performing our audit. We have nothing to report
having performed our review.
Adequacy of accounting records and information
and explanations received
Under the Companies Act 2006 we are required to report to you if,
in our opinion:
– we have not received all the information and explanations we require
for our audit; or
– adequate accounting records have not been kept by the company,
or returns adequate for our audit have not been received from
branches not visited by us; or
– the company financial statements and the part of the directors’
remuneration report to be audited are not in agreement with the
accounting records and returns.
We have no exceptions to report arising from this responsibility.
Directors’ remuneration
Directors’ remuneration report – Companies Act 2006
opinion
In our opinion, the part of the directors’ remuneration report to
be audited has been properly prepared in accordance with the
Companies Act 2006.
Other Companies Act 2006 reporting
Under the Companies Act 2006 we are required to report to you if,
in our opinion, certain disclosures of directors’ remuneration specified
by law are not made. We have no exceptions to report arising from
this responsibility.
Corporate governance statement
Under the Listing Rules we are required to review the part of the
corporate governance statement relating to ten further provisions
of the Code. We have nothing to report having performed our review.
Responsibilities for the financial
statements
Our responsibilities and those of the directors
As explained more fully in the directors’ responsibilities statement, the
directors are responsible for the preparation of the financial statements
and for being satisfied that they give a true and fair view.
Our responsibility is to audit and express an opinion on the financial
statements in accordance with applicable law and ISAs (UK & Ireland).
Those standards require us to comply with the Auditing Practices
Board’s Ethical Standards for Auditors.
This report, including the opinions, has been prepared for and only for
the company’s members as a body in accordance with Chapter 3 of
Part 16 of the Companies Act 2006 and for no other purpose. We do
not, in giving these opinions, accept or assume responsibility for any
other purpose or to any other person to whom this report is shown or
into whose hands it may come save where expressly agreed by our
prior consent in writing.
What an audit of financial statements involves
An audit involves obtaining evidence about the amounts and disclosures
in the financial statements sufficient to give reasonable assurance that the
financial statements are free from material misstatement, whether caused
by fraud or error. This includes an assessment of:
– whether the accounting policies are appropriate to the group’s and
the company’s circumstances and have been consistently applied
and adequately disclosed;
– the reasonableness of significant accounting estimates made
by the directors; and
– the overall presentation of the financial statements.
We primarily focus our work in these areas by assessing the directors’
judgements against available evidence, forming our own judgements,
and evaluating the disclosures in the financial statements.
We test and examine information, using sampling and other auditing
techniques, to the extent we consider necessary to provide a reasonable
basis for us to draw conclusions. We obtain audit evidence through testing
the effectiveness of controls, substantive procedures or a combination
of both.
In addition, we read all the financial and non-financial information in the
Annual Report to identify material inconsistencies with the audited financial
statements and to identify any information that is apparently materially
incorrect based on, or materially inconsistent with, the knowledge
acquired by us in the course of performing the audit. If we become aware
of any apparent material misstatements or inconsistencies we consider
the implications for our report.
Richard Hughes BA FCA (Senior Statutory Auditor)
for and on behalf of PricewaterhouseCoopers LLP
Chartered Accountants and Statutory Auditors
London
10 June 2016
102 SABMiller plc Annual Report 2016
Consolidated income statement
for the year ended 31 March
Notes
2016
US$m
2015
US$m
Revenue 2 19,833 22,130
Net operating expenses 3 (16,379) (17,746)
Operating profit 2 3,454 4,384
Operating profit before exceptional items 2 4,010 4,459
Exceptional items 4 (556) (75)
Net finance costs 5 (506) (637)
Finance costs 5a (763) (1,047)
Finance income 5b 257 410
Share of post-tax results of associates and joint ventures 2 1,126 1,083
Profit before taxation 4,074 4,830
Taxation 7 (1,152) (1,273)
Profit for the year 27a 2,922 3,557
Profit attributable to non-controlling interests 223 258
Profit attributable to owners of the parent 26a 2,699 3,299
2,922 3,557
Basic earnings per share (US cents) 8 167.8 205.7
Diluted earnings per share (US cents) 8 166.0 203.5
The notes on pages 108 to 170 are an integral part of these consolidated financial statements.
103SABMiller plc Annual Report 2016
FINANCIALSTATEMENTS
FINANCIAL STATEMENTS
Consolidated statement of comprehensive income
for the year ended 31 March
Notes
2016
US$m
2015
US$m
Profit for the year 2,922 3,557
Other comprehensive loss:
Items that will not be reclassified to profit or loss
Net remeasurements of defined benefit plans 30 5 (7)
Tax on items that will not be reclassified 7 (29) 70
Share of associates’ and joint ventures’ other comprehensive income/(loss) 72 (178)
Total items that will not be reclassified to profit or loss 48 (115)
Items that may be reclassified subsequently to profit or loss
Currency translation differences on foreign currency net investments: (1,230) (5,387)
– Decrease in foreign currency translation reserve during the year (1,230) (5,550)
– Recycling of foreign currency translation reserve on disposals – 163
Net investment hedges:
– Fair value gains arising during the year 26b 88 608
Cash flow hedges: 26b (64) 30
– Fair value (losses)/gains arising during the year (56) 45
– Fair value gains transferred to inventory (24) (8)
– Fair value (gains)/losses transferred to property, plant and equipment (1) 1
– Fair value losses/(gains) transferred to profit or loss 17 (8)
Tax on items that may be reclassified subsequently to profit or loss 7 18 (3)
Share of associates’ and joint ventures’ other comprehensive loss (89) (120)
Total items that may be reclassified subsequently to profit or loss (1,277) (4,872)
Other comprehensive loss for the year, net of tax (1,229) (4,987)
Total comprehensive income/(loss) for the year 1,693 (1,430)
Attributable to:
Non-controlling interests 169 179
Owners of the parent 1,524 (1,609)
Total comprehensive income/(loss) for the year 1,693 (1,430)
The notes on pages 108 to 170 are an integral part of these consolidated financial statements.
104 SABMiller plc Annual Report 2016
Consolidated balance sheet
at 31 March
Notes
2016
US$m
2015
US$m
Assets
Non-current assets
Goodwill 10 14,268 14,746
Intangible assets 11 6,526 6,878
Property, plant and equipment 12 7,750 7,961
Investments in joint ventures 13 5,512 5,428
Investments in associates 14 4,114 4,459
Available for sale investments 19 21
Derivative financial instruments 22 565 770
Trade and other receivables 16 121 126
Deferred tax assets 19 209 163
39,084 40,552
Current assets
Inventories 15 993 1,030
Trade and other receivables 16 1,742 1,711
Current tax assets 59 190
Derivative financial instruments 22 281 463
Cash and cash equivalents 17 1,430 965
4,505 4,359
Total assets 43,589 44,911
Liabilities
Current liabilities
Derivative financial instruments 22 (213) (101)
Borrowings 20 (2,926) (1,961)
Trade and other payables 18 (3,870) (3,728)
Current tax liabilities (830) (1,184)
Provisions 24 (270) (358)
(8,109) (7,332)
Non-current liabilities
Derivative financial instruments 22 (26) (10)
Borrowings 20 (8,814) (10,583)
Trade and other payables 18 (28) (18)
Deferred tax liabilities 19 (2,250) (2,275)
Provisions 24 (274) (338)
(11,392) (13,224)
Total liabilities (19,501) (20,556)
Net assets 24,088 24,355
Equity
Share capital 25 168 168
Share premium 6,849 6,752
Merger relief reserve 3,628 3,963
Other reserves 26b (6,758) (5,457)
Retained earnings 26a 19,005 17,746
Total shareholders’ equity 22,892 23,172
Non-controlling interests 1,196 1,183
Total equity 24,088 24,355
The balance sheet of SABMiller plc is shown on page 171.
The notes on pages 108 to 170 are an integral part of these consolidated financial statements.
The financial statements were authorised for issue by the board of directors on 10 June 2016 and were signed on its behalf by:
Alan Clark Domenic De Lorenzo
Chief Executive Chief Financial Officer
105SABMiller plc Annual Report 2016
FINANCIALSTATEMENTS
FINANCIAL STATEMENTS
Consolidated cash flow statement
for the year ended 31 March
Notes
2016
US$m
2015
US$m
Cash flows from operating activities
Cash generated from operations 27a 5,116 5,812
Interest received 273 352
Interest paid (659) (1,003)
Tax paid (1,315) (1,439)
Net cash generated from operating activities 27b 3,415 3,722
Cash flows from investing activities
Purchase of property, plant and equipment (1,210) (1,394)
Proceeds from sale of property, plant and equipment 74 68
Purchase of intangible assets (103) (178)
Proceeds from disposal of available for sale investments – 1
Proceeds from disposal of associates – 979
Acquisition of businesses (net of cash acquired) (191) (5)
Investments in joint ventures 13 (301) (216)
Investments in associates (4) (3)
Dividends received from joint ventures 13 998 976
Dividends received from associates 253 430
Dividends received from other investments – 1
Net cash (used in)/generated from investing activities (484) 659
Cash flows from financing activities
Proceeds from the issue of shares 113 202
Proceeds from the issue of shares in subsidiaries to non-controlling interests – 29
Purchase of own shares for share trusts 26a (149) (146)
Purchase of shares from non-controlling interests – (3)
Proceeds from borrowings 1,064 594
Repayment of borrowings (1,847) (4,413)
Capital element of finance lease payments (10) (10)
Net cash receipts on derivative financial instruments 547 243
Dividends paid to shareholders of the parent 9 (1,860) (1,705)
Dividends paid to non-controlling interests (153) (173)
Net cash used in financing activities (2,295) (5,382)
Net cash inflow/(outflow) from operating, investing and financing activities 636 (1,001)
Effects of exchange rate changes (115) (117)
Net increase/(decrease) in cash and cash equivalents 521 (1,118)
Cash and cash equivalents at 1 April 750 1,868
Cash and cash equivalents at 31 March 27c 1,271 750
The notes on pages 108 to 170 are an integral part of these consolidated financial statements.
106 SABMiller plc Annual Report 2016
Consolidated statement of changes in equity
for the year ended 31 March
Notes
Share
capital
US$m
Share
premium
US$m
Merger
relief
reserve
US$m
Other
reserves
US$m
Retained
earnings
US$m
Total
shareholders’
equity
US$m
Non-
controlling
interests
US$m
Total
equity
US$m
At 1 April 2014 167 6,648 4,321 (702) 15,885 26,319 1,163 27,482
Total comprehensive loss – – – (4,755) 3,146 (1,609) 179 (1,430)
Profit for the year – – – – 3,299 3,299 258 3,557
Other comprehensive loss – – – (4,755) (153) (4,908) (79) (4,987)
Dividends paid 9 – – – – (1,705) (1,705) (185) (1,890)
Issue of SABMiller plc ordinary shares 1 104 – – 97 202 – 202
Proceeds from the issue of shares in subsidiaries
to non-controlling interests – – – – – – 29 29
Share of movements in associates’ other
reserves 26a – – – – (6) (6) – (6)
Payment for purchase of own shares for
share trusts 26a – – – – (146) (146) – (146)
Buyout of non-controlling interests – – – – – – (3) (3)
Utilisation of merger relief reserve 26a – – (358) – 358 – – –
Credit entry relating to share-based payments 26a – – – – 117 117 – 117
At 31 March 2015 168 6,752 3,963 (5,457) 17,746 23,172 1,183 24,355
Total comprehensive income – – – (1,223) 2,747 1,524 169 1,693
Profit for the year – – – – 2,699 2,699 223 2,922
Other comprehensive loss – – – (1,223) 48 (1,175) (54) (1,229)
Dividends paid 9 – – – – (1,860) (1,860) (156) (2,016)
Issue of SABMiller plc ordinary shares – 97 – – 16 113 – 113
Share of movements in associates’ other
reserves 26a – – – – 2 2 – 2
Payment for purchase of own shares for
share trusts 26a – – – – (149) (149) – (149)
Utilisation of merger relief reserve 26a – – (335) – 335 – – –
Transfer between reserves 26a – – – (78) 78 – – –
Credit entry relating to share-based payments 26a – – – – 90 90 – 90
At 31 March 2016 168 6,849 3,628 (6,758) 19,005 22,892 1,196 24,088
The notes on pages 108 to 170 are an integral part of these consolidated financial statements.
Merger relief reserve
At 1 April 2015 the merger relief reserve comprised US$3,395 million in respect of the excess of value attributed to the shares issued as consideration
for Miller Brewing Company over the nominal value of those shares and US$568 million (2014: US$926 million) relating to the merger relief arising on
the issue of SABMiller plc ordinary shares for the buyout of non-controlling interests in the group’s Polish business. In the year ended 31 March 2016
the group transferred US$335 million (2015: US$358 million) of the reserve relating to the Polish business to retained earnings upon realisation of
qualifying consideration.
107SABMiller plc Annual Report 2016
FINANCIALSTATEMENTS
FINANCIAL STATEMENTS
Notes to the consolidated financial statements
1. Accounting policies
The principal accounting policies adopted in the preparation of the
group’s financial statements are set out below. These policies have been
consistently applied to all the years presented, unless otherwise stated.
a) Basis of preparation
The consolidated financial statements of SABMiller plc have been
prepared in accordance with International Financial Reporting Standards
as adopted by the European Union (IFRSs as adopted by the EU), and
the Companies Act 2006 applicable to companies reporting under IFRS.
The financial statements are prepared under the historical cost
convention, except for the revaluation to fair value of certain financial
assets and liabilities, and post-retirement assets and liabilities as
described in the accounting policies below. The financial statements
have been prepared on a going concern basis.
The preparation of financial statements in conformity with IFRS requires the
use of certain critical accounting estimates. It also requires management to
exercise its judgement in the process of applying the group’s accounting
policies. Actual results could differ from those estimates.
b) Recent accounting developments
(i) New standards, amendments and interpretations of existing
standards adopted by the group
The following standards, interpretations and amendments have been
adopted by the group as of 1 April 2015 and which have had no material
impact on the consolidated results of operations or financial position of
the group.
− Amendment to IAS 19, ‘Employee benefits’ on defined benefit plans;
− IFRIC 21, ‘Levies’;
− Annual improvements to IFRS 2012; and
– Annual improvements to IFRS 2013.
(ii) New standards, amendments and interpretations of existing
standards that are not yet effective and have not been early
adopted by the group
The following standards, interpretations and amendments to existing
standards mandatory for the group’s accounting periods beginning on
or after 1 April 2016 are not expected to have a material impact on the
consolidated results of operations or financial position of the group.
− Amendment to IAS 1, ‘Presentation of financial statements’ on the
disclosure initiative is effective from 1 January 2016;
− Amendments to IFRS 10, ‘Consolidated financial statements’, IFRS 12,
‘Disclosure of interests in other entities’, and IAS 28, ‘Investments in
associates and joint ventures’, on investment entities applying the
consolidation exemption, are effective from 1 January 20161
.
− Amendment to IFRS 11, ‘Joint arrangements’, on acquisition of an
interest in a joint operation, is effective from 1 January 2016;
− Amendments to IAS 16, ‘Property, plant and equipment’, and IAS 38,
‘Intangible assets’, on depreciation and amortisation, are effective
from 1 January 2016;
− Amendments to IAS 16, ‘Property, plant and equipment’, and IAS 41,
‘Agriculture’, regarding bearer plants, are effective from 1 January
2016;
− Amendment to IAS 27, ‘Separate financial statements’, is effective from
1 January 2016; and
− Annual improvements to IFRS 2014, are effective from 1 January 2016.
The group has yet to assess the full impact of the following standards
and amendments to existing standards mandatory for the group’s
accounting periods beginning on or after 1 April 2017 or later periods,
which have not been early adopted.
− IFRS 9, ‘Financial instruments’, is effective from 1 January 20181
;
− IFRS 15, ‘Revenue from contracts with customers’, is effective from
1 January 20181
; and
– IFRS 16, ‘Leases’, is effective from 1 January 20191
.
1
Not yet endorsed by the EU.
c) Significant judgements and estimates
In determining and applying accounting policies, judgement is often
required where the choice of specific policy, assumption or accounting
estimate to be followed could materially affect the reported results or net
position of the group, should it later be determined that a different choice
be more appropriate.
Management considers the following to be areas of significant
judgement and estimation for the group due to greater complexity
and/or particularly subject to the exercise of judgement. The group
has reconsidered the significant judgements and estimates applied,
in particular the determination of exceptional items and share-based
compensation, where it has not assumed the completion of the
AB InBev transaction.
(i) Impairment reviews
Goodwill arising on business combinations is allocated to the relevant
cash generating unit (CGU). Impairment reviews in respect of the relevant
CGUs, and also in respect of the investments in joint ventures and
associates, are performed at least annually or more regularly if events
indicate that this is necessary. Impairment reviews are based on future
cash flows discounted using the weighted average cost of capital for the
relevant country with terminal values calculated applying a long-term
growth rate. The future cash flows which are based on business
forecasts, the long-term growth rates and the discount rates used are
dependent on management estimates and judgements. Future events
could cause the assumptions used in these impairment reviews to
change with a consequent adverse impact on the results and net
position of the group. Details of the estimates used in the impairment
reviews for the year are set out in note 10.
(ii) Taxation
The group operates in many countries and is subject to taxes in
numerous jurisdictions. Significant judgement is required in determining
the provision for taxes as the tax treatment is often by its nature complex,
and cannot be finally determined until a formal resolution has been
reached with the relevant tax authority which may take several years
to conclude. Amounts provided are accrued based on management’s
interpretation of country specific tax laws and the likelihood of
settlement. Actual liabilities could differ from the amount provided which
could have a consequent adverse impact on the results and net position
of the group. Further significant judgement is required in determining
whether a deferred tax asset is recoverable, and thus recognised.
This is based on management’s expectations with regard to taxable
temporary differences and forecasts of future taxable profits.
108 SABMiller plc Annual Report 2016
(iii) Business combinations
On the acquisition of a company or business, a determination of the
fair value of the assets acquired and liabilities assumed, and the useful
life of intangible assets and property, plant and equipment acquired is
performed, which requires the application of management judgement.
Future events could cause the assumptions used by the group to change
which could have a significant impact on the results and net position
of the group.
(iv) Exceptional items
Exceptional items are expense or income items recorded in a period
which have been determined by management as being material by their
size or incidence and are presented separately within the results of the
group. The determination of which items are disclosed as exceptional
items will affect the presentation of profit measures including EBITA and
adjusted earnings per share, and requires a degree of judgement. Details
relating to exceptional items reported during the year are set out in note 4.
(v) Share-based compensation
Accounting for share-based compensation requires certain assumptions
to be made in order to determine the amounts to be recognised in the
income statement in accordance with IFRS 2. The income statement
charge spreads the fair value of each award at the grant date over the
vesting period on a straight-line basis, after considering an estimate of
the share awards that will eventually vest. The estimate of the level of
vesting is reviewed at least annually, with any impact on the cumulative
charge recognised immediately. The completion of the proposed
AB InBev transaction has not been assumed in determining the extent
and timing of the vesting of awards. The fair value at the date of grant
is calculated by various binomial model calculations and Monte Carlo
simulations which require various management assumptions including,
inter alia, forfeiture rates, dividend yield, volatility, and risk-free interest
rates. Details of the assumptions used in determining fair values of
grants in the year are set out in note 25.
d)Segmental reporting
Operating segments reflect the management structure of the group
and the way performance is evaluated and resources allocated based
on group net producer revenue and EBITA by the group’s chief operating
decision maker, defined as the executive directors. The group is focused
geographically, and while not meeting the definition of a reportable
segment, the group reports separately as a segment Corporate (and in
the prior year South Africa: Hotels and Gaming) as this provides useful
additional information. Segmental performance is reported after the
specific apportionment of attributable head office costs.
e) Basis of consolidation
SABMiller plc (the company) is a public limited company incorporated
in Great Britain and registered in England and Wales. The consolidated
financial statements include the financial information of the subsidiaries,
associates and joint ventures owned by the company.
(i) Subsidiaries
Subsidiaries are entities controlled by the company. Control is where
the company has power to vary the returns from its investment in the
entity and exposure to the variability of those returns. Where the
company’s interest in subsidiaries is less than 100%, the share
attributable to outside shareholders is reflected in non-controlling
interests. Subsidiaries are included in the financial statements from
the date control commences until the date control ceases.
On the subsequent disposal or termination of a business, the results
of the business are included in the group’s results up to the effective date
of disposal. The profit or loss on disposal or termination is calculated
after charging the amount of any related goodwill to the extent that
it has not previously been taken to the income statement.
Intra-group balances, and any unrealised gains and losses or income
and expenses arising from intra-group transactions, are eliminated in
preparing the consolidated financial statements. Unrealised losses are
eliminated unless the transaction provides evidence of an impairment
of the asset transferred.
Some of the company’s subsidiaries have a local statutory balance
sheet date of 31 December. These are consolidated using management
prepared information on a basis coterminous with the company’s
balance sheet date.
(ii) Associates
Associates are entities in which the group has a long-term interest and
over which the group has directly or indirectly significant influence, where
significant influence is the ability to influence the financial and operating
policies of the entity.
The associate, Distell Group Ltd, has a statutory balance sheet date
of 30 June. In respect of each year ending 31 March, this company
is included based on financial statements drawn up to the previous
31 December, but taking into account any changes in the subsequent
period from 1 January to 31 March that would materially affect the
results. All other associates are included on a coterminous basis.
(iii) Joint ventures
The group has assessed the nature of its joint arrangements and
determined them to be joint ventures.
Joint ventures are contractual arrangements which the group has
entered into with one or more parties to undertake an economic activity
that is subject to joint control. Joint control is the contractually agreed
sharing of control over an economic activity, and exists only when
decisions relating to the relevant activities require the unanimous
consent of the parties sharing the control.
The group’s share of the recognised income and expenses of associates
and joint ventures is accounted for using the equity method from the
date significant influence or joint control commences to the date it
ceases based on present ownership interests.
The group recognises its share of associates’ and joint ventures’
post-tax results as a one line entry before profit before taxation in
the income statement and its share of associates’ and joint ventures’
equity movements as one line entries under each of items of other
comprehensive income that will not be reclassified to profit or loss,
and items of other comprehensive income that may be reclassified
to profit or loss, in the statement of comprehensive income.
When the group’s interest in an associate or joint venture has been
reduced to nil because the group’s share of losses exceeds its interest
in the associate or joint venture, the group only provides for additional
losses to the extent that it has incurred legal or constructive obligations
to fund such losses, or make payments on behalf of the associate or
joint venture. Where the investment in an associate or joint venture is
disposed, the investment ceases to be equity accounted.
(iv) Transactions with non-controlling interests
Transactions with non-controlling interests are treated as transactions
with equity owners of the group. For purchases from non-controlling
interests, the difference between any consideration paid and the relevant
share acquired of the carrying value of net assets of the subsidiary
is recorded in equity. Gains or losses on disposals to non-controlling
interests are also recorded in equity where there is no loss of control.
1. Accounting policies continued
109SABMiller plc Annual Report 2016
FINANCIALSTATEMENTS
FINANCIAL STATEMENTS
(v) Reduction in interests
When the group ceases to have control, joint control or significant
influence, any retained interest in the entity is remeasured to its fair
value, with the change in carrying amount recognised in profit or
loss. The fair value is the initial carrying amount for the purposes of
subsequently accounting for the retained interest as an associate,
joint venture or financial asset. In addition, certain amounts previously
recognised in other comprehensive income in respect of that entity
are accounted for as if the group had directly disposed of the related
assets or liabilities. This may mean that certain amounts previously
recognised in other comprehensive income are reclassified to profit
or loss.
If the ownership interest in an associate is reduced but significant
influence is retained, or if the ownership interest in a joint venture is
reduced but joint control is retained, only the proportionate share
of the carrying amount of the investment and of the amounts previously
recognised in other comprehensive income are reclassified to profit
or loss where appropriate.
f) Foreign exchange
(i) Foreign exchange translation
Items included in the financial statements of each of the group’s entities
are measured using the currency of the primary economic environment
in which the entity operates (the functional currency). The consolidated
financial statements are presented in US dollars which is the group’s
presentational currency. The key exchange rates to the US dollar used
in preparing the consolidated financial statements were as follows.
Year ended
31 March
2016
Year ended
31 March
2015
Average rate
Australian dollar (AUD) 1.36 1.15
Colombian peso (COP) 2,922 2,097
Czech koruna (CZK) 24.66 21.56
Euro (€) 0.90 0.78
Peruvian nuevo sol (PEN) 3.29 2.90
Polish zloty (PLN) 3.81 3.26
South African rand (ZAR) 13.78 11.08
Turkish lira (TRY) 2.81 2.22
Closing rate
Australian dollar (AUD) 1.31 1.31
Colombian peso (COP) 3,022 2,576
Czech koruna (CZK) 23.76 25.59
Euro (€) 0.88 0.93
Peruvian nuevo sol (PEN) 3.31 3.10
Polish zloty (PLN) 3.73 3.80
South African rand (ZAR) 14.77 12.13
Turkish lira (TRY) 2.82 2.60
The average exchange rates have been calculated based on the average
of the exchange rates during the relevant year which have been weighted
according to the phasing of revenue of the group’s businesses.
(ii) Transactions and balances
The financial statements for each group company have been prepared
on the basis that transactions in foreign currencies are recorded in their
functional currency at the rate of exchange ruling at the date of the
transaction. Monetary items denominated in foreign currencies are
retranslated at the rate of exchange ruling at the balance sheet date with
the resultant translation differences being included in operating profit in the
income statement other than those arising on financial assets and liabilities
which are recorded within net finance costs and those which are deferred
in equity as qualifying cash flow hedges and qualifying net investment
hedges. Translation differences on non-monetary assets such as equity
investments classified as available for sale assets are included in other
comprehensive income.
(iii) Overseas subsidiaries, associates and joint ventures
One-off items in the income and cash flow statements of overseas
subsidiaries, associates and joint ventures expressed in currencies other
than the US dollar are translated to US dollars at the rates of exchange
prevailing on the day of the transaction. All other items are translated at
weighted average rates of exchange for the relevant reporting period.
Assets and liabilities of these undertakings are translated at closing
rates of exchange at each balance sheet date. All translation exchange
differences arising on the retranslation of opening net assets together
with differences between income statements translated at average and
closing rates are recognised as a separate component of equity. For
these purposes net assets include loans between group companies that
form part of the net investment, for which settlement is neither planned
nor likely to occur in the foreseeable future. When a foreign operation is
disposed of, any related exchange differences in equity are reclassified
to the income statement as part of the gain or loss on disposal.
Goodwill and fair value adjustments arising on the acquisition of a foreign
entity are treated as assets and liabilities of the foreign entity and
translated at the closing rate.
(iv) Hyperinflationary economies
In hyperinflationary economies, when translating the results of operations
into US dollars, adjustments are made to local currency denominated
non-monetary assets, liabilities, income statement and equity accounts
to reflect the changes in purchasing power. South Sudan was considered
to be a hyperinflationary economy in the year ended 31 March 2016. The
effect of inflation accounting in South Sudan for the year ended 31 March
2016 was not material.
g) Business combinations
(i) Subsidiaries
The acquisition method is used to account for business combinations.
The identifiable net assets (including intangibles) are incorporated into the
financial statements on the basis of their fair value from the effective date
of control, and the results of subsidiary undertakings acquired during the
financial year are included in the group’s results from that date.
On the acquisition of a company or business, fair values reflecting
conditions at the date of acquisition are attributed to the identifiable
assets (including intangibles), liabilities and contingent liabilities acquired.
Fair values of these assets and liabilities are determined by reference
to market values, where available, or by reference to the current price
at which similar assets could be acquired or similar obligations entered
into, or by discounting expected future cash flows to present value,
using either market rates or the risk-free rates and risk-adjusted expected
future cash flows.
The consideration transferred is measured as the fair value of the assets
given, equity instruments issued and liabilities incurred or assumed at the
date of the acquisition, and also includes the group’s estimate of the fair
value of any deferred consideration payable. Acquisition-related costs
are expensed as incurred. Where the business combination is achieved
in stages and results in a change in control, the acquisition date fair
value of the acquirer’s previously held equity interest in the acquiree is
remeasured to fair value at the acquisition date through profit or loss.
Where the business combination agreement provides for an adjustment
to the cost that is contingent on future events, the consideration
transferred includes the fair value of any asset or liability resulting from
a contingent consideration arrangement. On an acquisition by acquisition
basis, the group recognises any non-controlling interest in the acquiree
either at fair value or at the non-controlling interest’s proportionate share
of the acquiree’s net assets.
1. Accounting policies continued
Notes to the consolidated financial statements continued
110 SABMiller plc Annual Report 2016
(ii) Associates and joint ventures
On acquisition the investment in associates and joint ventures is
recorded initially at cost. Subsequently, the carrying amount is increased
or decreased to recognise the group’s share of the associates’ and joint
ventures’ income and expenses after the date of acquisition less any
impairment losses.
Fair values reflecting conditions at the date of acquisition are attributed
to the group’s share of identifiable assets (including intangibles), liabilities
and contingent liabilities acquired. The consideration transferred is
measured as the fair value of the assets given, equity instruments issued
and liabilities incurred or assumed at the date of the acquisition, and also
includes the group’s estimate of the fair value of any deferred
consideration payable.
The date significant influence or joint control commences is not
necessarily the same as the closing date or any other date named
in the contract.
(iii) Goodwill
Goodwill arising on consolidation represents the excess of the
consideration transferred, the amount of any non-controlling interest
in the acquiree and the acquisition-date fair value of any previous
equity interest in the acquiree over the fair value of the identifiable
assets (including intangibles), liabilities and contingent liabilities of the
acquired entity at the date of acquisition. Where the fair value of the
group’s share of identifiable net assets acquired exceeds the fair value
of the consideration, the difference is recognised immediately in the
income statement.
Goodwill is stated at cost less impairment losses and is reviewed for
impairment on an annual basis. Any impairment identified is recognised
immediately in the income statement and is not reversed.
The carrying amount of goodwill in respect of associates and joint
ventures is included in the carrying value of the investment in the
associate or joint venture.
h) Intangible assets
Intangible assets are stated at cost less accumulated amortisation on
a straight-line basis (if applicable) and impairment losses. Cost is usually
determined as the amount paid by the group, unless the asset has been
acquired as part of a business combination. Intangible assets acquired
as part of a business combination are recognised at their fair value
at the date of acquisition. Amortisation is included within net operating
expenses in the income statement. Internally generated intangibles are
not recognised except for computer software and applied development
costs referred to under computer software and research and
development below.
Intangible assets with finite lives are amortised over their estimated
useful economic lives, and only tested for impairment where there is
a triggering event. The group regularly reviews all of its amortisation rates
and residual values to take account of any changes in circumstances.
The directors’ assessment of the useful life of intangible assets is based
on the nature of the asset acquired, the durability of the products to
which the asset attaches and the expected future impact of competition
on the business.
(i) Brands
Brands are recognised as an intangible asset where the brand has
a long-term value. Acquired brands are only recognised where title
is clear or the brand could be sold separately from the rest of the
business and the earnings attributable to it are separately identifiable.
Acquired brands are amortised. In respect of brands currently held the
amortisation period is 10 to 40 years, being the period for which the
group has exclusive rights to those brands, up to a maximum of
40 years.
(ii) Contract brewing and other licences recognised as part
of a business combination
Contractual arrangements for contract brewing and competitor licensing
arrangements are recognised as an intangible asset at a fair value
representing the remaining contractual period with an assumption about
the expectation that such a contract will be renewed, together with a
valuation of this extension.
Acquired licences or contracts are amortised. In respect of licences or
contracts currently held, the amortisation period is the period for which
the group has exclusive rights to these assets or income streams.
(iii) Customer lists and distributor relationships recognised
as part of a business combination
The fair value of businesses acquired may include customer lists and
distributor relationships. These are recognised as intangible assets and
are calculated by discounting the future revenue stream attributable
to these lists or relationships.
Acquired customer lists or distributor relationships are amortised.
In respect of contracts currently held, the amortisation period is the
period for which the group has the benefit of these assets.
(iv) Computer software
Where computer software is not an integral part of a related item
of property, plant and equipment, the software is capitalised
as an intangible asset.
Acquired computer software licences are capitalised on the basis of the
costs incurred to acquire and bring them to use. Direct costs associated
with the production of identifiable and unique internally generated
software controlled by the group that will probably generate economic
benefits exceeding costs beyond one year are capitalised. Direct costs
include software development employment costs (including those of
contractors used), capitalised interest and an appropriate portion of
overheads. Capitalised computer software, licence and development
costs are amortised over their useful economic lives of between three
and eight years.
Internally generated costs associated with maintaining computer
software programmes are expensed as incurred.
(v) Research and development
Research and general development expenditure is written off in the
period in which it is incurred.
Certain applied development costs are only capitalised as internally
generated intangible assets where there is a clearly defined project,
separately identifiable expenditure, an outcome assessed with
reasonable certainty (in terms of feasibility and commerciality), expected
revenues exceed expected costs and the group has the resources to
complete the task. Such assets are amortised on a straight-line basis
over their useful lives once the project is complete.
i) Property, plant and equipment
Property, plant and equipment are stated at cost net of accumulated
depreciation and any impairment losses.
Cost includes expenditure that is directly attributable to the acquisition
of the assets. Subsequent costs are included in the asset’s carrying
value or recognised as a separate asset as appropriate, only when it is
probable that future economic benefits associated with the specific asset
will flow to the group and the cost can be measured reliably. Repairs
and maintenance costs are charged to the income statement during
the financial period in which they are incurred.
(i) Assets in the course of construction
Assets in the course of construction are carried at cost less any
impairment loss. Cost includes professional fees and for qualifying
assets certain borrowing costs as determined below. When these assets
are ready for their intended use, they are transferred into the appropriate
category. At this point, depreciation commences on the same basis as
on other property, plant and equipment.
1. Accounting policies continued
111SABMiller plc Annual Report 2016
FINANCIALSTATEMENTS
FINANCIAL STATEMENTS
(ii) Assets held under finance leases
Assets held under finance leases which result in the group bearing
substantially all the risks and rewards incidental to ownership are
capitalised as property, plant and equipment. Finance lease assets
are initially recognised at an amount equal to the lower of their fair value
and the present value of the minimum lease payments at inception of
the lease, then depreciated over the lower of the lease term or their
useful lives. The capital element of future obligations under the leases
is included as a liability in the balance sheet classified, as appropriate,
as a current or non-current liability. The interest element of the lease
obligations is charged to the income statement over the period of the
lease term to reflect a constant rate of interest on the remaining balance
of the obligation for each financial period.
(iii) Returnable containers
Returnable containers in circulation are recorded within property, plant
and equipment at cost net of accumulated depreciation less any
impairment loss.
Depreciation of returnable bottles and containers is recorded to write
the containers off over the course of their economic life. This is typically
undertaken in a two stage process:
− the excess over deposit value is written down over a period of one to
10 years.
– provisions are made against the deposit values for breakages and
losses in the trade together with a design obsolescence provision
held to write off the deposit value over the expected container
design period – which is a period of no more than 14 years from
the inception of a container design. This period is shortened where
appropriate by reference to market dynamics and the ability of the
entity to use containers for different brands.
(iv) Depreciation
No depreciation is provided on freehold land or assets in the course
of construction. In respect of all other property, plant and equipment,
depreciation is provided on a straight-line basis at rates calculated to
write off the cost, less the estimated residual value, of each asset over
its expected useful life as follows.
Freehold buildings 20 – 50 years
Leasehold buildings Shorter of the lease
term or 50 years
Plant, vehicles and systems 2 – 30 years
Returnable containers (non-returnable 1 – 14 years
containers are recorded as inventory)
Assets held under finance leases Lower of the lease term
or life of the asset
The group regularly reviews all of its depreciation rates and residual
values to take account of any changes in circumstances. When setting
useful economic lives, the principal factors the group takes into account
are the expected rate of technological developments, expected market
requirements for the equipment and the intensity at which the assets
are expected to be used.
The profit or loss on the disposal of an asset is the difference between
the disposal proceeds and the net book amount.
(v) Capitalisation of borrowing costs
Financing costs incurred, before tax, on major capital projects during the
period of development or construction that necessarily take a substantial
period of time to be developed for their intended use, are capitalised
up to the time of completion of the project.
j) Advance payments made to customers (principally hotels,
restaurants, bars and clubs)
Advance payments made to customers are conditional on the
achievement of contracted sales targets or marketing commitments.
The group records such payments as prepayments initially at fair value
and amortises them in the income statement over the relevant period to
which the customer commitment is made (typically three to five years).
These prepayments are recorded net of any impairment losses.
Where there is a volume target the amortisation of the advance is
included in sales discounts as a reduction to revenue and where there
are specific marketing activities/commitments the amortisation is
included as an operating expense. The amounts capitalised are
reassessed annually for achievement of targets and are impaired
where there is objective evidence that the targets will not be achieved.
Assets held at customer premises are included within property, plant
and equipment and are depreciated in line with group policies on
similar assets.
k) Inventories
Inventories are stated at the lower of cost incurred in bringing each
product to its present location and condition, and net realisable value,
as follows.
− raw materials, consumables and goods for resale: Purchase cost
net of discounts and rebates on a first-in first-out basis (FIFO).
– finished goods and work in progress: Raw material cost plus direct
costs and a proportion of manufacturing overhead expenses on
a FIFO basis.
Net realisable value is based on estimated selling price less further costs
expected to be incurred to completion and disposal. Costs of inventories
include the transfer from equity of any gains or losses on matured
qualifying cash flow hedges of purchases of raw materials.
l) Financial assets and financial liabilities
Financial assets and financial liabilities are initially recorded at fair value
(plus any directly attributable transaction costs, except in the case of
those classified at fair value through profit or loss). For those financial
instruments that are not subsequently held at fair value, the group
assesses whether there is any objective evidence of impairment
at each balance sheet date.
Financial assets are recognised when the group has rights or other
access to economic benefits. Such assets consist of cash, equity
instruments, a contractual right to receive cash or another financial asset,
or a contractual right to exchange financial instruments with another
entity on potentially favourable terms. Financial assets are derecognised
when the right to receive cash flows from the asset have expired or have
been transferred and the group has transferred substantially all risks and
rewards of ownership.
Financial liabilities are recognised when there is an obligation to transfer
benefits and that obligation is a contractual liability to deliver cash or
another financial asset or to exchange financial instruments with
another entity on potentially unfavourable terms. Financial liabilities are
derecognised when they are extinguished, that is discharged, cancelled
or expired.
If a legally enforceable right exists to set off recognised amounts of
financial assets and liabilities, which are in determinable monetary
amounts, and there is the intention to settle net, the relevant financial
assets and liabilities are offset.
Interest costs are charged to the income statement in the year in
which they accrue. Premiums or discounts arising from the difference
between the net proceeds of financial instruments purchased or issued
and the amounts receivable or repayable at maturity are included in the
effective interest calculation and taken to net finance costs over the life
of the instrument.
1. Accounting policies continued
Notes to the consolidated financial statements continued
112 SABMiller plc Annual Report 2016
There are four categories of financial assets and financial liabilities.
These are described as follows.
(i) Financial assets and financial liabilities at fair value through
profit or loss
Financial assets and financial liabilities at fair value through profit or loss
include derivative assets and derivative liabilities not designated as
effective hedging instruments.
All gains or losses arising from changes in the fair value of financial
assets or financial liabilities within this category are recognised in the
income statement.
a. Derivative financial assets and financial liabilities
Derivative financial assets and financial liabilities are financial instruments
the value of which changes in response to an underlying variable, require
little or no initial investment and are settled in the future.
These include derivatives embedded in host contracts. Such embedded
derivatives need not be accounted for separately if the host contract
is already fair valued; if it is not considered as a derivative if it was
freestanding; or if it can be demonstrated that it is closely related to
the host contract. There are certain currency exemptions which the
group has applied to these rules which limit the need to account for
certain potential embedded foreign exchange derivatives. These are:
if a contract is denominated in the functional currency of either party;
where that currency is commonly used in international trade of the
good traded; or if it is commonly used for local transactions in an
economic environment.
Derivative financial assets and liabilities are analysed between current
and non-current assets and liabilities on the face of the balance sheet,
depending on when they are expected to mature.
For derivatives that have not been designated to a hedging relationship, all
fair value movements are recognised immediately in the income statement.
(See note x for the group’s accounting policy on hedge accounting).
(ii) Loans and receivables
Loans and receivables are non-derivative financial assets with fixed or
determinable payments that are not quoted on an active market. They
arise when the group provides money, goods or services directly to a
debtor with no intention of trading the receivable. They are included in
current assets, except for maturities of greater than 12 months after the
balance sheet date which are classified as non-current assets. Loans
and receivables are initially recognised at fair value including originating
fees and transaction costs, and subsequently measured at amortised
cost using the effective interest method less provision for impairment.
Loans and receivables include trade receivables, amounts owed by
associates, amounts owed by joint ventures, accrued income and cash
and cash equivalents.
a. Trade receivables
Trade receivables are initially recognised at fair value and subsequently
measured at amortised cost less provision for impairment.
A provision for impairment of trade receivables is established when there
is objective evidence that the group will not be able to collect all amounts
due according to the terms of the receivables. The amount of the
provision is the difference between the asset’s carrying value and the
present value of the estimated future cash flows discounted at the
original effective interest rate. This provision is recognised in the
income statement.
b. Cash and cash equivalents
In the consolidated balance sheet, cash and cash equivalents includes
cash in hand, bank deposits repayable on demand and other short-term
highly liquid investments with original maturities of three months or less.
In the consolidated cash flow statement, cash and cash equivalents also
includes bank overdrafts which are shown within borrowings in current
liabilities on the balance sheet.
(iii) Available for sale investments
Available for sale investments are non-derivative financial assets that are
either designated in this category or not classified as financial assets at
fair value through profit or loss, or loans and receivables. Investments
in this category are included in non-current assets unless management
intends to dispose of the investment within 12 months of the balance
sheet date. They are initially recognised at fair value plus transaction
costs and are subsequently remeasured at fair value and tested for
impairment. Gains and losses arising from changes in fair value including
any related foreign exchange movements are recognised in other
comprehensive income. On disposal or impairment of available for sale
investments, any gains or losses in other comprehensive income are
reclassified to the income statement.
Purchases and sales of investments are recognised on the date on
which the group commits to purchase or sell the asset. Investments are
derecognised when the rights to receive cash flows from the investments
have expired or have been transferred and the group has transferred
substantially all risks and rewards of ownership.
(iv) Financial liabilities held at amortised cost
Financial liabilities held at amortised cost include trade payables,
accruals, amounts owed to associates, amounts owed to joint ventures,
other payables and borrowings.
a. Trade payables
Trade payables are initially recognised at fair value and subsequently
measured at amortised cost using the effective interest method. Trade
payables are analysed between current and non-current liabilities on the
face of the balance sheet, depending on when the obligation to settle will
be realised.
b. Borrowings
Borrowings are recognised initially at fair value, net of transaction costs,
and are subsequently stated at amortised cost and include accrued
interest and prepaid interest. Borrowings are classified as current liabilities
unless the group has an unconditional right to defer settlement of the
liability for at least 12 months from the balance sheet date. Borrowings
classified as hedged items are subject to hedge accounting requirements
(see note x). Bank overdrafts are shown within borrowings in current
liabilities and are included within cash and cash equivalents on the face
of the cash flow statement as they form an integral part of the group’s
cash management.
m) Impairment
This policy covers all assets except inventories (see note k), financial
assets (see note l), non-current assets classified as held for sale (see note
n), and deferred tax assets (see note u).
Impairment reviews are performed by comparing the carrying value of
the non-current asset with its recoverable amount, being the higher of
the fair value less costs of disposal and value in use. The fair value less
costs of disposal is considered to be the amount that could be obtained
on disposal of the asset, and therefore is determined from a market
participant perspective. The recoverable amount under both calculations
is determined by discounting the future post-tax cash flows generated
from continuing use of the cash generating unit (CGU) using a post-tax
discount rate. For value in use, this closely approximates applying
pre-tax discount rates to pre-tax cash flows. Where a potential
impairment is identified using post-tax cash flows and post-tax discount
rates, the impairment review is reperformed on a pre-tax basis in order to
determine the impairment loss to be recorded. Fair value less costs of
disposal calculations are prepared on a post-tax basis, and are classified
as level 3 in the fair value hierarchy.
Where the asset does not generate cash flows that are independent
from the cash flows of other assets, the group estimates the recoverable
amount of the CGU to which the asset belongs. For the purpose of
conducting impairment reviews, CGUs are considered to be groups of
assets that have separately identifiable cash flows. They also include
those assets and liabilities directly involved in producing the income
1. Accounting policies continued
113SABMiller plc Annual Report 2016
FINANCIALSTATEMENTS
FINANCIAL STATEMENTS
Notes to the consolidated financial statements continued
and a suitable proportion of those used to produce more than one
income stream.
An impairment loss is taken first against any specifically impaired assets.
Where an impairment is recognised against a CGU, the impairment
is first taken against goodwill balances and if there is a remaining loss
it is set against the remaining intangible and tangible assets on a
pro-rata basis.
Should circumstances or events change and give rise to a reversal
of a previous impairment loss, the reversal is recognised in the income
statement in the period in which it occurs and the carrying value of the
asset is increased. The increase in the carrying value of the asset is
restricted to the amount that it would have been had the original
impairment not occurred. Impairment losses in respect of goodwill
are irreversible.
Goodwill is tested annually for impairment. Assets subject to amortisation
or depreciation are reviewed for impairment if circumstances or events
change to indicate that the carrying value may not be fully recoverable.
n) Non-current assets (or disposal groups) held for sale
Non-current assets and all assets and liabilities classified as held for sale
are measured at the lower of carrying value and fair value less costs
of disposal.
Such assets are classified as held for sale if their carrying amount will be
recovered through a sale transaction rather than through continued use.
This condition is regarded as met only when a sale is highly probable,
the asset or disposal group is available for immediate sale in its present
condition and when management is committed to the sale which is
expected to qualify for recognition as a completed sale within one year
from date of classification.
o) Provisions
Provisions are recognised when there is a present obligation, whether
legal or constructive, as a result of a past event for which it is probable
that a transfer of economic benefits will be required to settle the
obligation and a reliable estimate can be made of the amount of the
obligation. Such provisions are calculated on a discounted basis where
the effect is material to the original undiscounted provision. The carrying
amount of the provision increases in each period to reflect the passage
of time and the unwinding of the discount and the movement is
recognised in the income statement within net finance costs.
Restructuring provisions comprise lease termination penalties and
employee termination payments. Provisions are not recognised for future
operating losses. Provisions are recognised for onerous contracts where
the unavoidable cost exceeds the expected benefit.
p) Share capital
Ordinary shares are classified as equity. Incremental costs directly
attributable to the issue of new shares or options are shown in equity
as a deduction, net of tax, from the proceeds.
q)Investments in own shares (treasury and shares held
by employee benefit trusts)
Shares held by employee share ownership plans, employee benefit
trusts and in treasury are treated as a deduction from equity until the
shares are cancelled, reissued, or disposed.
Purchases of such shares are classified in the cash flow statement as
a purchase of own shares for share trusts or purchase of own shares
for treasury within net cash from financing activities.
Where such shares are subsequently sold or reissued, any consideration
received, net of any directly attributable incremental costs and
related tax effects, is included in equity attributable to the company’s
equity shareholders.
r) Revenue recognition
(i) Sale of goods and services
Revenue represents the fair value of consideration received or receivable
for goods and services provided to third parties and is recognised when
the risks and rewards of ownership are substantially transferred.
The group presents revenue gross of excise duties because unlike value
added tax, excise is not directly related to the value of sales. It is not
generally recognised as a separate item on invoices, increases in excise
are not always directly passed on to customers, and the group cannot
reclaim the excise where customers do not pay for product received. The
group therefore considers excise as a cost to the group and reflects it as
a production cost. Consequently, any excise that is recovered in the sale
price is included in revenue.
Revenue excludes value added tax. It is stated net of price discounts,
promotional discounts, settlement discounts and after an appropriate
amount has been provided to cover the sales value of credit notes yet
to be issued that relate to the current and prior periods.
The same recognition criteria also apply to the sale of by-products and
waste (such as spent grain, malt dust and yeast) with the exception that
these are included within other income.
(ii) Interest income
Interest income is recognised on an accruals basis using the effective
interest method.
When a receivable is impaired the group reduces the carrying amount to
its recoverable amount by discounting the estimated future cash flows at
the original effective interest rate, and continuing to unwind the discount
as interest income.
(iii) Royalty income
Royalty income is recognised on an accruals basis in accordance with
the relevant agreements and is included in other income.
(iv) Dividend income
Dividend income is recognised when the right to receive payment
is established.
s) Operating leases
Rentals paid and incentives received on operating leases are charged
or credited to the income statement on a straight-line basis over the
lease term.
t) Exceptional items
Where certain expense or income items recorded in a period are material
by their size or incidence, the group reflects such items as exceptional
items within a separate line on the income statement except for those
exceptional items that relate to associates, joint ventures, net finance
costs and tax. (Associates’ and joint ventures’ net finance costs and tax
exceptional items are only referred to in the notes to the consolidated
financial statements).
Exceptional items are also summarised in the segmental analyses,
excluding those that relate to net finance costs and tax.
The group presents alternative earnings per share calculations on a
headline and adjusted basis. The adjusted earnings per share figure
excludes the impact of amortisation of intangible assets (excluding
computer software), certain non-recurring items and post-tax exceptional
items in order to present an additional measure of performance for the
years shown in the consolidated financial statements. Headline earnings
per share is calculated in accordance with the South African Circular
2/2015 entitled ‘Headline Earnings’ which forms part of the listing
requirements for the JSE Ltd (JSE).
u) Taxation
The tax expense for the period comprises current and deferred tax. Tax
is recognised in the income statement, except to the extent that it relates
to items recognised in other comprehensive income or directly in equity,
in which case it is recognised in other comprehensive income or directly
in equity, respectively.
1. Accounting policies continued
114 SABMiller plc Annual Report 2016
Current tax expense is based on the results for the period as adjusted
for items that are not taxable or not deductible. The group’s liability for
current taxation is calculated using tax rates and laws that have been
enacted or substantively enacted by the balance sheet date.
Deferred tax is provided in full using the liability method, in respect
of all temporary differences arising between the tax bases of assets
and liabilities and their carrying values in the consolidated financial
statements, except where the temporary difference arises from goodwill
(in the case of deferred tax liabilities) or from the initial recognition
(other than a business combination) of other assets and liabilities in
a transaction that affects neither accounting nor taxable profit.
Deferred tax liabilities are recognised where the carrying value of an
asset is greater than its tax base, or where the carrying value of a liability
is less than its tax base. Deferred tax is recognised in full on temporary
differences arising from investment in subsidiaries, associates and joint
ventures, except where the timing of the reversal of the temporary
difference is controlled by the group and it is probable that the temporary
difference will not reverse in the foreseeable future. This includes taxation
in respect of the retained earnings of overseas subsidiaries only to the
extent that, at the balance sheet date, dividends have been accrued as
receivable or a binding agreement to distribute past earnings in future
periods has been entered into by the subsidiary. Deferred income tax
is also recognised in respect of the unremitted retained earnings of
overseas associates and joint ventures as the group is not able to
determine when such earnings will be remitted and when such additional
tax such as withholding taxes might be payable.
A net deferred tax asset is regarded as recoverable and therefore
recognised only when, on the basis of all available evidence, it is
expected that sufficient existing taxable temporary differences will
reverse in the future or there will be sufficient taxable profit available
against which the temporary differences (including carried forward
tax losses) can be utilised.
Deferred tax is measured at the tax rates expected to apply in the periods
in which the timing differences are expected to reverse based on tax
rates and laws that have been enacted or substantively enacted at
balance sheet date. Deferred tax is measured on a non-discounted basis.
v) Dividend distributions
Dividend distributions to equity holders of the parent are recognised
as a liability in the group’s financial statements in the period in which
the dividends are approved by the company’s shareholders. Interim
dividends are recognised when paid. Dividends declared after the
balance sheet date are not recognised, as there is no present obligation
at the balance sheet date.
w) Employee benefits
(i) Wages and salaries
Wages and salaries for current employees are recognised in the income
statement as the employees’ services are rendered.
(ii) Vacation and long-term service awards costs
The group recognises a liability and an expense for accrued vacation pay
when such benefits are earned and not when these benefits are paid.
The group also recognises a liability and an expense for long-term service
awards where cash is paid to the employee at certain milestone dates
in a career with the group. Such accruals are appropriately discounted to
reflect the future payment dates at discount rates determined by reference
to local high-quality corporate bonds.
(iii) Profit-sharing and bonus plans
The group recognises a liability and an expense for bonuses and
profit-sharing, based on a formula that takes into consideration the profit
attributable to the company’s shareholders after certain adjustments.
The group recognises a provision where contractually obliged or where
there is a past practice that has created a constructive obligation. At a
mid-year point an accrual is maintained for the appropriate proportion
of the expected bonuses which would become payable at the year end.
(iv) Share-based compensation
The group operates a variety of equity-settled share-based
compensation plans.
The equity-settled plans comprise share option and stock appreciation
rights plans (with and without market performance conditions attached),
performance share award plans (with and without market performance
conditions attached) and awards related to the employee element of
the Broad-Based Black Economic Empowerment (BBBEE) scheme in
South Africa. An expense is recognised to spread the fair value of each
award over the vesting period on a straight-line basis, after considering
an estimate of the share awards that will eventually vest. A corresponding
adjustment is made to equity over the remaining vesting period. The
estimate of the level of vesting is reviewed at least annually, with any
impact on the cumulative charge being recognised immediately.
In addition the group has granted an equity-settled share-based
payment to retailers in relation to the retailer element of the BBBEE
scheme. A one-off charge has been recognised based on the fair value
at the grant date with a corresponding adjustment to equity. The charge
will not be adjusted in the future.
The charges are based on the fair value of the awards as at the date of
grant, as calculated by various binomial model calculations and Monte
Carlo simulations.
The charges are not reversed if the options and awards are not exercised
because the market value of the shares is lower than the option price
at the date of grant.
The proceeds received net of any directly attributable transaction costs
are credited to share capital (nominal value) and share premium when
the options are exercised.
(v) Pension obligations
The group has both defined benefit and defined contribution plans.
The liability recognised in the balance sheet in respect of defined
benefit pension plans is the present value of the defined benefit
obligation at the balance sheet date less the fair value of plan assets.
The defined benefit obligation is calculated annually by independent
actuaries using the projected unit credit method. The present value of
the defined benefit obligation is determined by discounting the estimated
future cash outflows using interest rates of high-quality corporate bonds
that are denominated in the currency in which the benefits will be paid,
and that have terms to maturity approximating to the terms of the related
pension liability.
Actuarial gains and losses arising from experience adjustments and
changes in actuarial assumptions are recognised in full as they arise
and are charged or credited to equity in other comprehensive income
in the period in which they arise.
The current service cost, the net interest cost, any past service costs,
and the effect of any curtailments and settlements are recognised
in operating costs in the income statement.
The contributions to defined contribution plans are recognised as an
expense as the costs become payable. The contributions are recognised
as employee benefit expense when they are due. Prepaid contributions
are recognised as an asset to the extent that a cash refund or
a reduction in the future payments is available.
(vi) Other post-employment obligations
Some group companies provide post-retirement healthcare benefits
to qualifying employees. The expected costs of these benefits are
assessed in accordance with the advice of qualified actuaries and
contributions are made to the relevant funds over the expected service
lives of the employees entitled to those funds. Actuarial gains and losses
1. Accounting policies continued
115SABMiller plc Annual Report 2016
FINANCIALSTATEMENTS
FINANCIAL STATEMENTS
Notes to the consolidated financial statements continued
arising from experience adjustments, and changes in actuarial
assumptions are recognised in full as they arise and are charged
or credited to equity in other comprehensive income in the period
in which they arise. These obligations are valued annually by
independent qualified actuaries.
(vii)Termination benefits
Termination benefits are payable when employment is terminated before
the normal retirement date, or whenever an employee accepts voluntary
redundancy in exchange for these benefits. The group recognises
termination benefits when it is demonstrably committed to terminating
the employment of current employees according to a detailed formal plan
without possibility of withdrawal, or providing termination benefits as a
result of an offer made to encourage voluntary redundancy. Benefits falling
due more than 12 months after balance sheet date are discounted to
present value in a similar manner to all long-term employee benefits.
x) Derivative financial instruments – hedge accounting
Financial assets and financial liabilities at fair value through profit or loss
include all derivative financial instruments. The derivative instruments used
by the group, which are used solely for hedging purposes (i.e. to offset
foreign exchange, commodity price and interest rate risks), comprise
interest rate swaps, cross currency swaps, forward foreign exchange
contracts, commodity contracts and other specific instruments as
necessary under the approval of the board. Such derivative instruments
are used to alter the risk profile of an existing underlying exposure of the
group in line with the group’s risk management policies. The group also
has derivatives embedded in other contracts, primarily cross border
foreign currency supply contracts for raw materials.
Derivatives are initially recorded at fair value on the date a derivative
contract is entered into and are subsequently remeasured at their fair
value. The method of recognising the resulting gain or loss depends on
whether the derivative is designated as a hedging instrument, and, if so,
the nature of the hedging relationship.
In order to qualify for hedge accounting, the group is required to document
at inception the relationship between the hedged item and the hedging
instrument as well as its risk management objectives and strategy for
undertaking hedging transactions. The group is also required to document
and demonstrate that the relationship between the hedged item and the
hedging instrument will be highly effective. This effectiveness test is
reperformed at each period end to ensure that the hedge has remained
and will continue to remain highly effective.
The group designates certain derivatives as either: hedges of the fair value
of recognised assets or liabilities or a firm commitment (fair value hedge);
hedges of highly probable forecast transactions or commitments (cash
flow hedge); or hedges of net investments in foreign operations (net
investment hedge).
(i) Fair value hedges
Fair value hedges comprise derivative financial instruments designated
in a hedging relationship to manage the group’s interest rate risk and
foreign exchange risk to which the fair value of certain assets and
liabilities are exposed. Changes in the fair value of the derivative offset
the relevant changes in the fair value of the underlying hedged item
attributable to the hedged risk in the income statement in the
period incurred.
Gains or losses on fair value hedges that are regarded as highly effective
are recorded in the income statement together with the gain or loss on
the hedged item attributable to the hedged risk.
(ii) Cash flow hedges
Cash flow hedges comprise derivative financial instruments designated in
a hedging relationship to manage currency and interest rate risk to which
the cash flows of certain assets and liabilities are exposed. The effective
portion of changes in the fair value of the derivative that is designated and
qualifies for hedge accounting is recognised in other comprehensive
income. The ineffective portion is recognised immediately in the income
statement. Amounts accumulated in equity are reclassified to the income
statement in the period in which the hedged item affects profit or loss.
However, where a forecasted transaction results in a non-financial asset or
liability, the accumulated fair value movements previously deferred in equity
are included in the initial cost of the asset or liability.
(iii) Hedges of net investments in foreign operations
Hedges of net investments in foreign operations comprise either foreign
currency borrowings or derivatives (typically forward exchange contracts
and cross currency swaps) designated in a hedging relationship.
Gains or losses on hedging instruments that are regarded as highly
effective are recognised in other comprehensive income. These largely
offset foreign currency gains or losses arising on the translation of net
investments that are recorded in equity, in the foreign currency translation
reserve. The ineffective portion of gains or losses on hedging instruments
is recognised immediately in the income statement. Amounts accumulated
in equity are only reclassified to the income statement upon disposal of the
net investment.
Where a derivative ceases to meet the criteria of being a hedging
instrument or the underlying exposure which it is hedging is sold, matures
or is extinguished, hedge accounting is discontinued and amounts
previously recorded in equity are reclassified to the income statement.
A similar treatment is applied where the hedge is of a future transaction
and that transaction is no longer likely to occur. When the hedge is
discontinued due to ineffectiveness, hedge accounting is discontinued
prospectively.
Certain derivative instruments, while providing effective economic
hedges under the group’s policies, are not designated as hedges.
Changes in the fair value of any derivative instruments that do not qualify
or have not been designated as hedges are recognised immediately in the
income statement. The group does not hold or issue derivative financial
instruments for speculative purposes.
y) Deposits by customers
Returnable containers in circulation are recorded within property, plant
and equipment and a corresponding liability is recorded in respect of the
obligation to repay the customers’ deposits. Deposits paid by customers
for branded returnable containers are reflected in the balance sheet
within current liabilities. Any estimated liability that may arise in respect
of deposits for unbranded containers is shown in provisions.
z) Earnings per share
Basic earnings per share represents the profit on ordinary activities
after taxation attributable to the equity shareholders of the parent entity,
divided by the weighted average number of ordinary shares in issue
during the year, less the weighted average number of ordinary shares
held in the group’s employee benefit trusts and in treasury during
the year.
Diluted earnings per share represents the profit on ordinary activities
after taxation attributable to the equity shareholders of the parent entity,
divided by the weighted average number of ordinary shares in issue
during the year, less the weighted average number of ordinary shares
held in the group’s employee benefit trusts and in treasury during the
year, plus the weighted average number of dilutive shares resulting from
share options and other potential ordinary shares outstanding during
the year.
1. Accounting policies continued
116 SABMiller plc Annual Report 2016
2. Segmental analysis
Operating segments reflect the management structure of the group and the way performance is evaluated and resources allocated based on group
NPR and EBITA by the group’s chief operating decision maker, defined as the executive directors. The group is focused geographically and, while not
meeting the definition of a reportable segment, the group reports Corporate (2015: Corporate and South Africa: Hotels and Gaming) as a separate
segment as this provides useful additional information.
The segmental information presented below includes the reconciliation of GAAP measures presented on the face of the income statement to
non-GAAP measures which are used by management to analyse the group’s performance.
Income statement
Group NPR
2016
US$m
EBITA
2016
US$m
Group NPR
2015
US$m
EBITA
2015
US$m
Latin America 5,211 1,959 5,768 2,224
Africa 6,781 1,708 7,462 1,907
Asia Pacific 3,650 753 3,867 768
Europe 3,832 636 4,398 700
North America 4,675 865 4,682 858
Corporate – (111) – (122)
Retained operations 24,149 5,810 26,177 6,335
South Africa: Hotels and Gaming – – 111 32
24,149 5,810 26,288 6,367
Amortisation of intangible assets (excluding computer software) – group and share of
associates’ and joint ventures’ (350) (423)
Exceptional items in operating profit – group and share of associates’ and joint ventures’ (657) (138)
Net finance costs – group and share of associates’ and joint ventures’ (579) (740)
Share of associates’ and joint ventures’ taxation (114) (157)
Share of associates’ and joint ventures’ non-controlling interests (36) (79)
Profit before taxation 4,074 4,830
Group revenue and group NPR (including the group’s share of associates and joint ventures)
With the exception of South Africa: Hotels and Gaming, all reportable segments derive their revenues from the sale of beverages. Revenues are
derived from a large number of customers which are internationally dispersed, with no customers being individually material.
Revenue
2016
US$m
Share of
associates’
and joint
ventures’
revenue
2016
US$m
Group
revenue
2016
US$m
Excise duties
and other
similar taxes
2016
US$m
Share of
associates’
and joint
ventures’
excise duties
and other
similar taxes
2016
US$m
Group NPR
2016
US$m
Latin America 7,018 – 7,018 (1,807) – 5,211
Africa 6,126 2,124 8,250 (1,160) (309) 6,781
Asia Pacific 2,793 2,180 4,973 (1,061) (262) 3,650
Europe 3,721 1,371 5,092 (906) (354) 3,832
North America 175 5,142 5,317 (4) (638) 4,675
19,833 10,817 30,650 (4,938) (1,563) 24,149
2015
US$m
2015
US$m
2015
US$m
2015
US$m
2015
US$m
2015
US$m
Latin America 7,812 – 7,812 (2,044) – 5,768
Africa 6,853 2,221 9,074 (1,334) (278) 7,462
Asia Pacific 3,136 2,203 5,339 (1,203) (269) 3,867
Europe 4,186 1,675 5,861 (1,011) (452) 4,398
North America 143 5,201 5,344 (4) (658) 4,682
Retained operations 22,130 11,300 33,430 (5,596) (1,657) 26,177
South Africa: Hotels and Gaming – 128 128 – (17) 111
22,130 11,428 33,558 (5,596) (1,674) 26,288
117SABMiller plc Annual Report 2016
FINANCIALSTATEMENTS
FINANCIAL STATEMENTS
2. Segmental analysis continued
Operating profit and EBITA (segment result)
The following table provides a reconciliation of operating profit to operating profit before exceptional items, and to EBITA. EBITA comprises operating
profit before exceptional items, and amortisation of intangible assets (excluding computer software) and includes the group’s share of associates’ and
joint ventures’ operating profit on a similar basis.
Operating
profit
2016
US$m
Exceptional
items
2016
US$m
Operating
profit before
exceptional
items
2016
US$m
Share of
associates’
and joint
ventures’
operating
profit before
exceptional
items
2016
US$m
Amortisation
of intangible
assets
(excluding
computer
software)
2016
US$m
Share of
associates’
and joint
ventures’
amortisation
of intangible
assets
(excluding
computer
software)
2016
US$m
EBITA
2016
US$m
Latin America 1,873 – 1,873 – 86 – 1,959
Africa 923 389 1,312 381 15 – 1,708
Asia Pacific 463 (29) 434 165 153 1 753
Europe 511 – 511 78 21 26 636
North America (9) – (9) 826 4 44 865
Corporate (307) 196 (111) – – – (111)
3,454 556 4,010 1,450 279 71 5,810
2015
US$m
2015
US$m
2015
US$m
2015
US$m
2015
US$m
2015
US$m
2015
US$m
Latin America 2,110 – 2,110 – 114 – 2,224
Africa 1,516 (45) 1,471 427 9 – 1,907
Asia Pacific (14) 452 438 142 188 – 768
Europe 548 – 548 85 22 45 700
North America 14 – 14 800 2 42 858
Corporate (191) 69 (122) – – – (122)
Retained operations 3,983 476 4,459 1,454 335 87 6,335
South Africa: Hotels and Gaming 401 (401) – 31 – 1 32
4,384 75 4,459 1,485 335 88 6,367
The group’s share of associates’ and joint ventures’ operating profit is reconciled to the share of post-tax results of associates and joint ventures
in the income statement as follows.
2016
US$m
2015
US$m
Share of associates’ and joint ventures’ operating profit (before exceptional items) 1,450 1,485
Share of associates’ and joint ventures’ exceptional items in operating profit (101) (63)
Share of associates’ and joint ventures’ net finance costs (73) (103)
Share of associates’ and joint ventures’ taxation (114) (157)
Share of associates’ and joint ventures’ non-controlling interests (36) (79)
Share of post-tax results of associates and joint ventures 1,126 1,083
EBITDA
EBITA is reconciled to EBITDA as follows.
EBITA
2016
US$m
Depreciation
2016
US$m
Share of
associates’
and joint
ventures’
depreciation
2016
US$m
EBITDA
2016
US$m
EBITA
2015
US$m
Depreciation
2015
US$m
Share of
associates’
and joint
ventures’
depreciation
2015
US$m
EBITDA
2015
US$m
Latin America 1,959 274 – 2,233 2,224 302 – 2,526
Africa 1,708 249 120 2,077 1,907 275 121 2,303
Asia Pacific 753 62 148 963 768 66 148 982
Europe 636 195 64 895 700 214 77 991
North America 865 – 139 1,004 858 – 145 1,003
Corporate (111) 36 – (75) (122) 39 – (83)
Retained operations 5,810 816 471 7,097 6,335 896 491 7,722
South Africa: Hotels and Gaming – – – – 32 – 8 40
5,810 816 471 7,097 6,367 896 499 7,762
Notes to the consolidated financial statements continued
118 SABMiller plc Annual Report 2016
2. Segmental analysis continued
Adjusted EBITDA
Adjusted EBITDA is comprised of the following.
2016
US$m
2015
US$m
Subsidiaries’ EBITDA 5,105 5,690
– Operating profit before exceptional items 4,010 4,459
– Depreciation (including amortisation of computer software) 816 896
– Amortisation (excluding computer software) 279 335
Group’s share of MillerCoors’ EBITDA 1,009 987
– Operating profit before exceptional items 826 800
– Depreciation (including amortisation of computer software) 139 145
– Amortisation (excluding computer software) 44 42
Adjusted EBITDA 6,114 6,677
Other segmental information
Capital
expenditure
excluding
investment
activity¹
2016
US$m
Investment
activity²
2016
US$m
Total
2016
US$m
Capital
expenditure
excluding
investment
activity¹
2015
US$m
Investment
activity²
2015
US$m
Total
2015
US$m
Latin America 439 – 439 429 (5) 424
Africa 547 4 551 720 8 728
Asia Pacific 85 – 85 80 – 80
Europe 201 191 392 253 – 253
North America – 301 301 15 216 231
Corporate 41 – 41 75 (972) (897)
1,313 496 1,809 1,572 (753) 819
¹ Capital expenditure includes additions of intangible assets (excluding goodwill) and property, plant and equipment.
² Investment activity includes acquisitions and disposals of businesses, net investments in associates and joint ventures, purchases of shares in non-controlling interests and purchases
and disposals of available for sale investments.
Geographical information
The UK is the parent company’s country of domicile. Those countries which account for more than 10% of the group’s total revenue and/or
non-current assets are considered individually material and are reported separately below.
Revenue
2016
US$m
2015
US$m
UK 440 424
Australia 2,149 2,493
Colombia 2,844 3,568
Peru 2,025 2,145
South Africa 3,804 4,352
USA 165 131
Rest of world 8,406 9,017
19,833 22,130
Non-current assets
2016
US$m
2015
US$m
UK 489 358
Australia 9,697 9,804
Colombia 4,990 5,886
Peru 2,896 3,094
South Africa 1,548 1,735
USA 5,781 5,704
Rest of world 12,909 13,038
38,310 39,619
Non-current assets by location exclude amounts relating to derivative financial instruments and deferred tax assets.
119SABMiller plc Annual Report 2016
FINANCIALSTATEMENTS
FINANCIAL STATEMENTS
3. Net operating expenses
2016
US$m
2015
US$m
Cost of inventories recognised as an expense 4,177 4,552
– Changes in inventories of finished goods and work in progress 17 57
– Raw materials and consumables used 4,160 4,495
Excise duties and other similar taxes 4,938 5,596
Employee costs (see note 6a) 2,232 2,483
Depreciation of property, plant and equipment 743 821
– Containers 205 219
– Other 538 602
Profit on disposal of available for sale investments – (1)
Profit on disposal of businesses – (45)
Profit on disposal of investment in associates – (403)
Gain on dilution of investment in associates – (2)
Profit on disposal of property, plant and equipment (34) (18)
Loss on disposal of intangible assets 2 –
Amortisation of intangible assets 352 410
– Intangible assets (excluding computer software) 279 335
– Computer software 73 75
Other expenses 4,178 4,696
– Selling, marketing and distribution costs 2,132 2,428
– Repairs and maintenance expenditure on property, plant and equipment 266 309
– Impairment of investment in associate 372 –
– Impairment of trade and other receivables 25 34
– Impairment of property, plant and equipment 7 73
– Impairment of goodwill – 286
– Impairment of intangible assets – 6
– Operating lease rentals – land and buildings 68 84
– Operating lease rentals – plant, vehicles and systems 67 88
– Transaction-related costs (excluding employee-related costs) 94 –
– Research and development expenditure 4 5
– Other operating expenses 1,143 1,383
Total net operating expenses by nature 16,588 18,089
Other income (209) (343)
– Revenue received from royalties (37) (47)
– Dividends received from investments – (1)
– Other operating income (172) (295)
Net operating expenses 16,379 17,746
Foreign exchange differences recognised in the profit for the year, except for those arising on financial instruments measured at fair value under
IAS 39, were a loss of US$34 million (2015: US$25 million).
The following fees were paid to a number of different accounting firms as auditors of various parts of the group.
2016
US$m
2015
US$m
Group auditors
Fees payable to the company’s auditor and its associates for the audit of parent company and consolidated financial statements 3 3
Fees payable to the company’s auditor and its associates for other services:
The audit of the company’s subsidiaries 7 8
Total audit fees payable to the company’s auditor 10 11
Taxation advisory services 1 1
Other non-audit services1
3 1
Total fees payable to the company’s auditor 14 13
Reimbursement by third party of fees payable to the company’s auditor (1) –
Total fees payable by the group to the company’s auditor 13 13
Other audit firms
Fees payable to other auditor firms for:
The audit of the company’s subsidiaries 1 1
Taxation advisory services 3 3
Services relating to corporate finance transactions 1 1
Internal audit services 1 3
Other non-audit services
Services relating to information technology2
2 1
Other2
6 21
Total fees payable to other audit firms 14 30
1
Principally relating to the AB InBev offer. 2
Consulting services principally relating to the cost and efficiency programme.
Notes to the consolidated financial statements continued
120 SABMiller plc Annual Report 2016
4. Exceptional items
2016
US$m
2015
US$m
Exceptional items included in operating profit:
Impairments1,2
(379) (313)
Transaction costs (160) –
Cost and efficiency programme costs (36) (69)
Integration and restructuring costs 29 (139)
Net foreign exchange losses2
(10) –
Profit on disposal of investment in associate – 401
Profit on disposal of business – 45
Net exceptional losses included within operating profit (556) (75)
Exceptional items included in net finance costs:
Net foreign exchange losses2
(44) –
Loan guarantee provision1
(20) –
Early redemption costs – (48)
Recycling of foreign currency translation reserves – 33
Net exceptional losses included within net finance costs (64) (15)
Share of associates’ and joint ventures’ exceptional items:
Profit on transaction in associate 86 –
Impairments and related charges1
(119) (63)
Restructuring costs (68) –
Group’s share of associates’ and joint ventures’ exceptional losses (101) (63)
Net taxation credits/(charges) relating to subsidiaries’ and the group’s share of associates’
and joint ventures’ exceptional items 28 (83)
1
Angola
During 2016 the group incurred US$491 million of exceptional charges before finance costs relating to Angola including the US$372 million
impairment of the group’s associate investment in Angola and the group’s US$119 million share of Castel’s impairment and related charges.
Additionally the group has made a provision within finance costs in relation to loan guarantees in Angola of US$20 million. All the charges result
from the operations being significantly scaled down following the significant devaluation of the local currency against the US dollar and the lack
of availability of hard currency in Angola.
2
South Sudan
During 2016 the group incurred US$17 million of exceptional charges before finance costs relating to South Sudan including the US$7 million
impairment of property, plant and equipment and US$10 million of operating foreign exchange losses arising on the retranslation of net monetary
liabilities. Additionally the group has incurred US$44 million of foreign exchange losses on net monetary liabilities within finance costs. All the
charges result from the operation being significantly scaled down following the significant devaluation of the local currency against the US dollar
and the lack of availability of hard currency in South Sudan.
Impairments
During 2015 an impairment charge of US$313 million was incurred in respect of the group’s Indian business in Asia Pacific. The impairment charge
comprised US$286 million against goodwill, US$23 million against property, plant and equipment, and US$4 million against intangible assets.
Transaction costs
During 2016 the group incurred costs of US$160 million relating to the potential transaction with Anheuser-Busch InBev SA/NV, including advisers’
fees and staff-related costs.
Cost and efficiency programme costs
In 2016 costs of US$36 million (2015: US$69 million) were incurred in relation to the cost and efficiency programme.
Integration and restructuring costs
In 2016 a credit of US$29 million was realised relating to integration and restructuring in Australia, following the successful resolution of certain claims
leading to the release of provisions.
During 2015 US$139 million of integration and restructuring costs were incurred in Asia Pacific following the Foster’s and Pacific Beverages
acquisitions, including impairments relating to brewery closures.
Profit on disposal of investment in associate
During 2015 a pre-tax profit of US$401 million, after associated costs, was realised on the disposal of the group’s interests in the Tsogo Sun hotels
and gaming business in South Africa.
Profit on disposal of business
During 2015 an additional profit of US$45 million was realised in Africa in relation to the disposal in 2012 of the group’s Angolan operations in
exchange for a 27.5% interest in BIH Angola, following the resolution of certain matters leading to the release of provisions.
121SABMiller plc Annual Report 2016
FINANCIALSTATEMENTS
FINANCIAL STATEMENTS
4. Exceptional items continued
Exceptional items included in net finance costs
Early redemption costs
During 2015 a US$48 million exceptional charge was incurred in relation to costs for the early redemption of the US$850 million 6.5% Notes that were
due July 2016.
Recycling of foreign currency translation reserve
During 2015 a credit of US$33 million was recognised in relation to the recycling of foreign currency translation reserves following the repayment
of an intercompany loan.
Share of associates’ and joint ventures’ exceptional items
Profit on transaction in associate
In 2016 the group’s associate Castel recognised a gain arising on the change in control following the acquisition of further interests in its Tunisian
operation. The group’s share of the gain amounted to US$86 million.
Impairments
During 2015 the group’s share of the impairment charges taken by Anadolu Efes in relation to its beer businesses in Russia and Ukraine amounted
to US$63 million.
Restructuring costs
During 2016 MillerCoors announced the closure of the Eden brewery with full effect from September 2016. Restructuring costs, including accelerated
depreciation and severance costs, have been incurred of which the group’s share amounted to US$68 million.
Net taxation credits/(charges) relating to subsidiaries’ and the group’s share of associates’ and joint ventures’ exceptional items
Net taxation credits of US$28 million (2015: charges of US$83 million) arose in relation to exceptional items during the year, and include US$25 million
(2015: US$nil) in relation to MillerCoors although the tax credit is recognised in Miller Brewing Company (see note 7).
5. Net finance costs
2016
US$m
2015
US$m
a. Finance costs
Interest payable on bank loans and overdrafts 88 100
Interest payable on derivatives 132 177
Interest payable on corporate bonds 397 545
Interest element of finance lease payments 4 3
Net fair value losses on financial instruments 27 –
Net exchange losses 15 120
Exceptional foreign exchange losses1
(see note 4) 44 –
Exceptional loan guarantee provision1
(see note 4) 20 –
Early redemption costs1
(see note 4) – 48
Other finance charges 36 54
Total finance costs 763 1,047
b. Finance income
Interest receivable 16 19
Interest receivable on derivatives 234 282
Net fair value gains on financial instruments – 66
Recycling of foreign currency translation reserves1
(see note 4) – 33
Other finance income 7 10
Total finance income 257 410
Net finance costs 506 637
1
Net exceptional losses of US$64 million (2015: US$15 million) are excluded from the determination of adjusted net finance costs and adjusted earnings per share.
Adjusted net finance costs were US$442 million (2015: US$622 million).
Refer to note 21 – Financial risk factors for interest rate risk information.
Notes to the consolidated financial statements continued
122 SABMiller plc Annual Report 2016
6. Employee and key management compensation costs
a. Employee costs
2016
US$m
2015
US$m
Wages and salaries 1,858 2,085
Share-based payments 90 117
Social security costs 175 164
Pension costs 107 117
Post-retirement benefits other than pensions 5 8
2,235 2,491
Of the US$2,235 million employee costs shown above, US$3 million (2015: US$8 million) has been capitalised within intangible assets and property,
plant and equipment.
b. Employee numbers
The average monthly number of employees are shown on a full-time equivalent basis, excluding employees of associated and joint venture
undertakings and including executive directors.
2016
Number
2015
Number
Latin America 28,632 28,162
Africa 25,669 24,802
Asia Pacific 4,692 5,048
Europe 9,971 9,810
North America 186 124
Corporate 939 862
70,089 68,808
c. Key management compensation
The directors of the group and members of the executive committee (excom) are defined as key management. At 31 March 2016 there were
23 (2015: 23) key management.
2016
US$m
2015
US$m
Salaries and short-term employee benefits 28 29
Post-employment benefits 2 3
Share-based payments 53 47
83 79
d. Directors
2016
US$m
2015
US$m
Aggregate emoluments £5,986,052 (2015: £5,235,208) 9 8
Aggregate gains made on the exercise of share options or release of share awards 11 12
Notional contributions to unfunded retirement benefits scheme £370,666 (2015: £502,836) 1 1
21 21
At 31 March 2016 two directors (2015: one) had retirement benefits accruing under money purchase pension schemes. Company contributions to
money purchase pension schemes during the year amounted to £120,000 (2015: £40,000).
Full details of individual directors’ remuneration are given in the directors’ remuneration report on pages 74 to 92.
123SABMiller plc Annual Report 2016
FINANCIALSTATEMENTS
FINANCIAL STATEMENTS
7. Taxation
2016
US$m
2015
US$m
Current taxation 1,039 1,415
– Charge for the year 1,050 1,390
– Adjustments in respect of prior years (11) 25
Withholding taxes and other remittance taxes 148 176
Total current taxation 1,187 1,591
Deferred taxation (35) (318)
– Credit for the year (24) (330)
– Adjustments in respect of prior years (12) 7
– Rate change 1 5
Taxation expense 1,152 1,273
Tax charge/(credit) relating to components of other comprehensive loss is as follows:
Deferred tax charge/(credit) on net remeasurements of defined benefit plans 29 (70)
Deferred tax (credit)/charge on financial instruments (18) 3
11 (67)
Total current tax 1,187 1,591
Total deferred tax (24) (385)
Total taxation 1,163 1,206
Effective tax rate (%) 26.3 26.0
UK taxation included in the above
Current taxation – –
Withholding taxes and other remittance taxes 91 82
Total current taxation 91 82
Deferred taxation (53) –
UK taxation expense 38 82
See the financial definitions section for the definition of the effective tax rate. The calculation is on a basis consistent with that used in prior years and
is also consistent with other group operating metrics. Tax on amortisation of intangible assets (excluding computer software) was US$96 million
(2015: US$117 million).
MillerCoors is not a taxable entity. The tax balances and obligations therefore remain with Miller Brewing Company as a 100% subsidiary of the group.
This subsidiary’s tax charge includes tax (including deferred tax) on the group’s share of the taxable profits of MillerCoors and includes tax in other
comprehensive income on the group’s share of MillerCoors’ taxable items included within other comprehensive income.
Notes to the consolidated financial statements continued
124 SABMiller plc Annual Report 2016
7. Taxation continued
Tax rate reconciliation
2016
US$m
2015
US$m
Profit before taxation 4,074 4,830
Less: Share of post-tax results of associates and joint ventures (1,126) (1,083)
2,948 3,747
Tax charge at standard UK rate of 20% (2015: 21%) 590 787
Exempt income (155) (194)
Other incentive allowances (33) (34)
Expenses not deductible for tax purposes 140 179
Deferred tax asset not recognised/(recognised) 49 (54)
Initial recognition of deferred taxation (53) (104)
Tax impact of MillerCoors joint venture 158 174
Withholding taxes and other remittance taxes 148 176
Other taxes 37 33
Adjustments in respect of foreign tax rates 288 306
Adjustments in respect of prior periods (23) 32
Deferred taxation rate change 1 5
Deferred taxation on unremitted earnings 5 (33)
Total taxation expense 1,152 1,273
8. Earnings per share
2016
US cents
2015
US cents
Basic earnings per share 167.8 205.7
Diluted earnings per share 166.0 203.5
Headline earnings per share 188.4 213.4
Adjusted basic earnings per share 224.1 239.1
Adjusted diluted earnings per share 221.6 236.6
The weighted average number of shares was:
2016
Millions of
shares
2015
Millions of
shares
Ordinary shares 1,677 1,674
Treasury shares (59) (63)
EBT ordinary shares (10) (7)
Basic shares 1,608 1,604
Dilutive ordinary shares 18 17
Diluted shares 1,626 1,621
The calculation of diluted earnings per share excludes 4,582,485 (2015: 8,613,524) share options that were non-dilutive for the year because the
exercise price together with the future IFRS 2 charge of the option exceeded the average fair value of the shares during the year and 25,574,875
(2015: 16,316,980) share awards that were non-dilutive for the year because the performance conditions attached to the share awards had not been
met. These share incentives could potentially dilute earnings per share in the future.
125SABMiller plc Annual Report 2016
FINANCIALSTATEMENTS
FINANCIAL STATEMENTS
8. Earnings per share continued
Adjusted and headline earnings
The group presents an adjusted earnings per share figure which excludes the impact of amortisation of intangible assets (excluding computer
software), certain non-recurring items and post-tax exceptional items in order to present an additional measure of performance for the years shown
in the consolidated financial statements. Adjusted earnings per share are based on adjusted earnings for each financial year and on the same
number of weighted average shares in issue as the basic earnings per share calculation. Headline earnings per share has been calculated in
accordance with the South African Circular 2/2015 entitled ‘Headline Earnings’ which forms part of the listing requirements for the JSE Ltd (JSE).
The adjustments made to arrive at headline earnings and adjusted earnings are as follows.
2016
US$m
2015
US$m
Profit for the year attributable to owners of the parent 2,699 3,299
Headline adjustments
Impairment of associate 372 –
Impairment of property, plant and equipment 7 73
Impairment of intangible assets – 6
Impairment of goodwill – 286
Profit on disposal of investment in associate – (401)
Profit on disposal of business – (45)
Tax effects of these items – 146
Non-controlling interests’ share of the above items (1) (1)
Share of associates’ and joint ventures’ headline adjustments, net of tax and non-controlling interests (48) 60
Headline earnings 3,029 3,423
Amortisation of intangible assets (excluding computer software) 279 335
Transaction costs 160 –
Integration and restructuring costs (excluding impairment) (29) 87
Cost and efficiency programme costs 36 69
Loan guarantee provision 20 –
Net foreign exchange losses 54 –
Early redemption costs – 48
Recycling of foreign currency translation reserves – (33)
Tax effects of the above items (117) (167)
Non-controlling interests’ share of the above items (23) (6)
Share of associates’ and joint ventures’ other adjustments, net of tax and non-controlling interests 195 79
Adjusted earnings 3,604 3,835
9. Dividends
2016
US$m
2015
US$m
Equity
2015 Final dividend paid: 87.0 US cents (2014: 80.0 US cents) per ordinary share 1,404 1,289
2016 Interim dividend paid: 28.25 US cents (2015: 26.0 US cents) per ordinary share 456 416
1,860 1,705
In addition, the directors are proposing a final dividend of 93.75 US cents per share in respect of the financial year ended 31 March 2016, which
will absorb an estimated US$1,509 million of shareholders’ funds. If approved by shareholders, and if the proposed offer for the company
by AB InBev has not become effective prior to 12 August 2016, the dividend will be paid on 12 August 2016 to shareholders registered on the
London and Johannesburg registers as at 5 August 2016. The total dividend per share for the year is 122.0 US cents (2015: 113.0 US cents).
Treasury shares do not attract dividends and the employees’ benefit trusts have both waived their right to receive dividends (further information
can be found in note 26).
Notes to the consolidated financial statements continued
126 SABMiller plc Annual Report 2016
10. Goodwill
US$m
Cost
At 1 April 2014 18,843
Exchange adjustments (3,257)
Reclassification (see note 19) (293)
Acquisitions – through business combinations 1
At 31 March 2015 15,294
Exchange adjustments (555)
Acquisitions – through business combinations 79
At 31 March 2016 14,818
Accumulated impairment
At 1 April 2014 346
Exchange adjustments (84)
Impairment 286
At 31 March 2015 548
Exchange adjustments 2
At 31 March 2016 550
Net book amount
At 1 April 2014 18,497
At 31 March 2015 14,746
At 31 March 2016 14,268
2016
Provisional goodwill of US$79 million arose on the acquisition of Meantime Brewing Company Ltd, a modern craft brewer in the United Kingdom.
The fair value exercise in respect of this business combination is now complete.
2015
Provisional goodwill of US$1 million arose on the acquisition of a business in Africa. The fair value exercise in respect of this business combination
is now complete.
Goodwill is monitored principally on an individual country basis and the net book value is allocated by cash generating unit (CGU) as follows.
2016
US$m
2015
US$m
CGUs:
Latin America:
– Central America 766 777
– Colombia 2,881 3,367
– Peru 1,408 1,505
– Other Latin America 198 207
Africa:
– South Africa 321 391
– Other Africa 200 219
Asia Pacific:
– Australia 5,858 5,820
Europe:
– Czech Republic 761 707
– Netherlands 90 85
– Italy 368 347
– Poland 1,021 1,002
– United Kingdom 74 –
– Other Europe 66 63
North America 256 256
14,268 14,746
127SABMiller plc Annual Report 2016
FINANCIALSTATEMENTS
FINANCIAL STATEMENTS
10. Goodwill continued
Assumptions
The group uses both value in use and fair value less costs of disposal (FVLCD) calculations to determine the recoverable amounts for its CGUs.
See note 1 for the detailed accounting policy on how the group determines recoverable value. The key assumptions for the discounted cash flow
calculations are as follows.
Expected volume five-year compound annual growth rate (CAGR) – Cash flows are based on financial forecasts approved by management
for each CGU covering five-year periods and are dependent on management’s expected volume CAGRs which have been determined based on past
experience and planned initiatives, and with reference to external sources in respect of macro-economic assumptions. Expected growth rates over the
five-year forecast period are generally higher than the long-term average growth rates for the economies in which the CGUs operate as a steady state
is not necessarily expected to be reached in this period. The cash flow forecasts included in FVLCD calculations are based on management’s best
estimates of expected volume CAGRs and incorporate cash flows associated with enhancing the assets’ performance, such as capital expenditure,
where appropriate in order to determine the FVLCD from a market participant’s perspective.
Discount rate – The discount rate (weighted average cost of capital) is calculated using a methodology which reflects the returns from United States
Treasury notes with a maturity of 20 years, an equity risk premium adjusted for specific industry and country risks, and inflation differentials. The group
applies local post-tax discount rates to local post-tax cash flows. For a value in use calculation, where a potential impairment is identified on a post-tax
basis, the impairment review is reperformed on a pre-tax basis.
Long-term growth rate – Cash flows after the first five-year period are extrapolated using a long-term growth rate, in order to calculate the terminal
recoverable amount. The long-term growth rate is estimated using historical trends and expected future trends in inflation rates, based on external data.
The following table presents the key assumptions used in the discounted cash flow calculations in each of the group’s operating segments and relate
only to subsidiaries of the group.
Expected
volume CAGRs
2016-2021
%
Post-tax
discount rates
%
Long-term
growth rates
%
Latin America 2.9–3.9 8.4–12.7 1.9–3.7
Africa 3.7–11.3 12.2–19.3 5.4–8.6
Asia Pacific (0.1) 7.4 2.6
Europe (0.9)–3.2 6.9–9.0 1.4–2.3
North America1
22.2 6.7 1.9
1
Primarily the international business across the Americas.
Impairment reviews results
As a result of the annual impairment reviews, no impairment losses have been recognised in the year.
In 2015 an impairment charge of US$313 million was recognised in respect of the India CGU in Asia Pacific. This primarily reflected the group’s
assessment of the increasing regulatory and excise challenges in the operating environment in India and the proposed partial introduction of a
national goods and services tax (GST) which will not apply to beer so that GST on input costs is not expected to be recoverable. The impairment
loss was allocated to goodwill (US$286 million), property, plant and equipment (US$23 million), and intangible assets (US$4 million). The recoverable
amount of the CGU was based on its value in use, which was determined using a discounted cash flow calculation. In arriving at value in use,
a pre-tax discount rate of 14.1% was applied to pre-tax cash flows.
Sensitivities to assumptions
The group’s impairment reviews are sensitive to changes in the key assumptions described above.
The most material goodwill balance is in Australia. In addition to the volume CAGR, pricing and mix, and cost efficiencies are significant factors
influencing the recoverable value of the CGU, and therefore NPR and EBITA CAGRs were also considered key assumptions in the discounted cash
flow calculation. The estimated recoverable value was calculated on a FVLCD basis. Due to improved performance of the group’s business in Australia,
the recoverable amount has increased and is now approximately US$750 million (2015: US$650 million) higher than the carrying value of the CGU. For
the recoverable amount to reduce to a level such that it is equal to the carrying value of the CGU, the following would need to occur in isolation: the
future compound annual NPR growth over the five-year forecast period to reduce to a level such that the EBITA CAGR over the same period of 3.7%
would fall below the long-term growth rate of 2.6%; or the long-term growth rate of 2.6% in nominal terms to fall below 2.1%; or the discount rate to rise
from 7.4% to 7.8% or higher. These changes in assumptions are considered reasonably possible in the current operating environment.
Based on the group’s sensitivity analysis, a reasonably possible change in a single assumption will not cause an impairment loss in any of the group’s
other CGUs.
Notes to the consolidated financial statements continued
128 SABMiller plc Annual Report 2016
11. Intangible assets
Brands
US$m
Computer
software
US$m
Other
US$m
Total
US$m
Cost
At 1 April 2014 9,188 811 557 10,556
Exchange adjustments (1,596) (101) (101) (1,798)
Additions – separately acquired 14 172 – 186
Disposals – (8) – (8)
At 31 March 2015 7,606 874 456 8,936
Exchange adjustments (289) (22) 4 (307)
Additions – separately acquired – 91 – 91
Acquisitions – through business combinations 126 – – 126
Disposals – (33) (20) (53)
At 31 March 2016 7,443 910 440 8,793
Accumulated amortisation and impairment
At 1 April 2014 1,544 370 110 2,024
Exchange adjustments (301) (48) (25) (374)
Amortisation 301 75 34 410
Disposals – (8) – (8)
Impairment 4 2 – 6
At 31 March 2015 1,548 391 119 2,058
Exchange adjustments (83) (11) 2 (92)
Amortisation 254 73 25 352
Disposals – (31) (20) (51)
At 31 March 2016 1,719 422 126 2,267
Net book amount
At 1 April 2014 7,644 441 447 8,532
At 31 March 2015 6,058 483 337 6,878
At 31 March 2016 5,724 488 314 6,526
During 2016 no impairment charges in respect of intangible assets were recognised (2015: US$6 million).
At 31 March significant individual brands included within the carrying value of intangible assets are as follows.
2016
US$m
2015
US$m
Amortisation
period
remaining
(years)
Brand carrying value
Carlton (Australia) 1,452 1,481 36
Aguila (Colombia) 813 987 29
Victoria Bitter (Australia) 732 748 36
Cristal (Peru) 459 508 29
Grolsch (Netherlands) 342 332 32
129SABMiller plc Annual Report 2016
FINANCIALSTATEMENTS
FINANCIAL STATEMENTS
12. Property, plant and equipment
Assets in
course of
construction
US$m
Land and
buildings
US$m
Plant,
vehicles
and systems
US$m
Returnable
containers
US$m
Total
US$m
Cost
At 1 April 2014 606 3,665 8,394 2,051 14,716
Exchange adjustments (124) (712) (1,722) (362) (2,920)
Additions 828 30 216 345 1,419
Acquisitions – through business combinations – 3 1 – 4
Breakages and shrinkage – – – (140) (140)
Transfers (613) 123 476 14 –
Transfers to other assets – – (2) – (2)
Disposals (1) (63) (298) (39) (401)
At 31 March 2015 696 3,046 7,065 1,869 12,676
Exchange adjustments (65) (192) (640) (158) (1,055)
Additions 641 91 213 303 1,248
Acquisitions – through business combinations – 6 10 3 19
Breakages and shrinkage – – – (111) (111)
Transfers (709) 130 546 33 –
Disposals (3) (30) (203) (17) (253)
At 31 March 2016 560 3,051 6,991 1,922 12,524
Accumulated depreciation and impairment
At 1 April 2014 – 723 3,916 1,012 5,651
Exchange adjustments – (187) (1,015) (203) (1,405)
Provided during the year – 74 528 219 821
Breakages and shrinkage – – – (77) (77)
Impairment – 43 30 – 73
Disposals – (38) (275) (35) (348)
At 31 March 2015 – 615 3,184 916 4,715
Exchange adjustments – (35) (314) (75) (424)
Provided during the year – 68 470 205 743
Breakages and shrinkage – – – (54) (54)
Impairment – – 7 – 7
Disposals – (14) (190) (9) (213)
At 31 March 2016 – 634 3,157 983 4,774
Net book amount
At 1 April 2014 606 2,942 4,478 1,039 9,065
At 31 March 2015 696 2,431 3,881 953 7,961
At 31 March 2016 560 2,417 3,834 939 7,750
No impairment losses have been recognised in the year as a result of the annual goodwill impairment reviews (2015: US$23 million) (see note 10).
Included in land and buildings is freehold land with a cost of US$498 million (2015: US$560 million) which is not depreciated.
Included in plant, vehicles and systems are the following amounts relating to assets held under finance leases.
2016
US$m
2015
US$m
Net book amount 74 65
Notes to the consolidated financial statements continued
130 SABMiller plc Annual Report 2016
12. Property, plant and equipment continued
Included in the amounts above are the following amounts in respect of borrowing costs capitalised.
2016
US$m
2015
US$m
At 1 April 20 37
Exchange adjustments (3) (6)
Amortised during the year (8) (11)
At 31 March 9 20
No borrowing costs were capitalised during the year (2015: none).
Borrowings are secured by various of the group’s property, plant and equipment with an aggregate net book value of US$86 million
(2015: US$91 million).
13. Investments in joint ventures
A list of the group’s principal investments in joint ventures, including the name, country of incorporation and effective ownership interest is given
in note 33.
US$m
At 1 April 2014 5,581
Investments in joint ventures 216
Share of results retained 786
Share of other comprehensive loss (179)
Dividends received (976)
As at 31 March 2015 5,428
Investments in joint ventures 301
Share of results retained 746
Share of other comprehensive income 35
Dividends received (998)
At 31 March 2016 5,512
Summarised financial information for the group’s interest in joint ventures, on a 100% basis after adjustments to comply with the group’s accounting
policies, is shown below.
Summarised balance sheet
MillerCoors
2016
US$m
2015
US$m
Cash and cash equivalents 16 18
Other current assets 935 911
Total current assets 951 929
Non-current assets 5,030 5,022
Total assets 5,981 5,951
Financial liabilities (excluding trade payables) (72) (47)
Other current liabilities (945) (911)
Total current liabilities (1,017) (958)
Financial liabilities (58) (30)
Other non-current liabilities (1,311) (1,509)
Total liabilities (2,386) (2,497)
Non-controlling interests (38) (41)
Net assets attributable to owners 3,557 3,413
131SABMiller plc Annual Report 2016
FINANCIALSTATEMENTS
FINANCIAL STATEMENTS
13. Investments in joint ventures continued
Summarised statement of comprehensive income
MillerCoors
2016
US$m
2015
US$m
Revenue 8,866 8,966
Depreciation and amortisation (411) (322)
Interest expense (2) (1)
Profit before taxation 1,288 1,361
Taxation expense (3) (5)
Profit for the year 1,285 1,356
Other comprehensive income/(loss) 61 (309)
Total comprehensive income 1,346 1,047
Reconciliation of summarised financial information
A reconciliation of the summarised financial information to the carrying amount of the group’s interests in its joint ventures is as follows.
MillerCoors
2016
US$m
2015
US$m
Opening net assets 3,413 3,676
Total comprehensive income 1,346 1,047
Dividends paid (1,721) (1,683)
Funding to joint venture 519 373
Closing net assets 3,557 3,413
Interest in joint venture (%) 58 58
Interest in joint venture 2,063 1,979
Goodwill 3,449 3,449
Carrying value of investments in joint venture 5,512 5,428
14. Investments in associates
A list of the group’s principal investments in associates, including the name, country of incorporation and effective ownership interest is given
in note 33. Details of all the group’s investments in associates are provided in the related undertakings section of the annual report.
US$m
At 1 April 2014 5,787
Exchange adjustments (755)
Investments in associates 46
Disposals of investments in associates (368)
Share of results retained 297
Share of other comprehensive loss (119)
Share of movements in other reserves (6)
Dividends receivable (423)
At 31 March 2015 4,459
Exchange adjustments (50)
Impairment (see note 4) (372)
Share of results retained 380
Share of other comprehensive loss (52)
Share of movements in other reserves 2
Dividends receivable (253)
At 31 March 2016 4,114
2016
There have been no acquisitions or disposals of associates in the year.
An impairment charge of US$372 million was recognised in respect of the group’s investment in BIH Brasseries Internationales Holding (Angola) Ltd,
its associate with interests in Angola, as a result of the operations in Angola being significantly scaled down following the significant devaluation of the
local currency against the US dollar and the lack of availability of hard currency in Angola. The recoverable amount was based on the value in use,
determined using a discounted cash flow calculation with a pre-tax discount rate of 24.0%.
Notes to the consolidated financial statements continued
132 SABMiller plc Annual Report 2016
14. Investments in associates continued
2015
The group disposed of its investment in Tsogo Sun Holdings Ltd (Tsogo Sun), its hotels and gaming associate listed on the Johannesburg Stock
Exchange, in August 2014 through an institutional placing and share buyback. The group received net proceeds of US$971 million, and realised
a post-tax profit of US$239 million.
In January 2015 the group received net proceeds of US$7 million and realised a net profit of US$2 million, after associated costs, on the disposal
of its packaging associate in Panama, Latin America.
The analysis of associates between listed and unlisted investments is shown below.
2016
US$m
2015
US$m
Listed 1,446 1,470
Unlisted 2,668 2,989
4,114 4,459
Further details of the market value of listed investments in associates are given in note 21.
Summarised financial information
Summarised financial information for associates, which in the opinion of the directors are material to the group, on a 100% basis after adjustments
to comply with the group’s accounting policies, is as follows.
Castel1
Anadolu Efes CR Snow
2016
US$m
2015
US$m
2016
US$m
2015
US$m
2016
US$m
2015
US$m
Summarised balance sheet
Total current assets 3,963 3,388 1,411 1,478 1,641 1,523
Total non-current assets 3,699 2,972 6,282 6,390 4,888 5,032
Total assets 7,662 6,360 7,693 7,868 6,529 6,555
Total current liabilities (1,505) (1,257) (777) (920) (2,813) (2,869)
Total non-current liabilities (592) (409) (2,491) (2,402) (744) (659)
Total liabilities (2,097) (1,666) (3,268) (3,322) (3,557) (3,528)
Total non-controlling interests (825) (672) (1,782) (1,659) (20) (20)
Net assets attributable to owners 4,740 4,022 2,643 2,887 2,952 3,007
Summarised statement of comprehensive income/(loss)
Revenue 6,019 6,000 5,099 6,408 4,449 4,496
Profit/(loss) for the year attributable to owners 825 815 (65) (466) 262 199
Other comprehensive (loss)/income attributable to owners (92) (59) 158 (537) (172) 23
Total comprehensive income/(loss) attributable to
owners 733 756 93 (1,003) 90 222
Reconciliation of summarised financial information
A reconciliation of the summarised financial information to the carrying amount of the group’s interests in its associates is as follows.
Castel1
Anadolu Efes CR Snow
2016
US$m
2015
US$m
2016
US$m
2015
US$m
2016
US$m
2015
US$m
Opening net assets attributable to owners 4,022 5,212 2,887 4,571 3,007 3,267
Total comprehensive income/(loss) attributable to owners 733 756 93 (1,003) 90 222
Dividends paid (394) (359) (97) – (146) (465)
Exchange adjustments 379 (1,587) (240) (681) – 3
Other movements in reserves – – – – 1 (20)
Closing net assets attributable to owners 4,740 4,022 2,643 2,887 2,952 3,007
Interest in associates (%) 20–40 20–40 24 24 49 49
Interest in associates 1,053 925 634 693 1,446 1,473
Impairment (105) – – – – –
Goodwill 50 310 357 387 – –
Carrying value of investments in associates 998 1,235 991 1,080 1,446 1,473
1
BIH Brasseries Internationales Holding Ltd, Société des Brasseries et Glacières Internationales SA, Algerienne de Bavaroise Spa, BIH Brasseries Internationales Holding (Angola) Ltd,
Marocaine d’Investissements et de Services SA, Skikda Bottling Company SARL, Société de Boissons de I’Ouest Algerien SARL, and Société des Nouvelles Brasseries together make up
Castel’s African beverage operations. Details of individual ownership percentages are included in the related undertakings section of the annual report.
133SABMiller plc Annual Report 2016
FINANCIALSTATEMENTS
FINANCIAL STATEMENTS
14. Investments in associates continued
Individually immaterial associates
Summarised financial information for individually immaterial associates, in aggregate, is as follows.
2016
US$m
2015
US$m
Summarised statement of comprehensive income
Aggregate carrying amount of individually immaterial associates 679 671
Aggregate amounts of the group’s share of:
Profit for the year attributable to owners 126 124
Other comprehensive income attributable to owners 20 12
Total comprehensive income 146 136
15. Inventories
2016
US$m
2015
US$m
Raw materials and consumables 568 588
Work in progress 91 89
Finished goods and goods for resale 334 353
993 1,030
The following amount of inventories is expected to be utilised after 12 months.
2016
US$m
2015
US$m
Raw materials and consumables 33 38
There were no borrowings secured on the inventories of the group (2015: US$nil).
An impairment charge of US$19 million was recognised in respect of inventories during the year (2015: US$34 million).
16. Trade and other receivables
2016
US$m
2015
US$m
Trade receivables 1,448 1,412
Less: provision for impairment (129) (132)
Trade receivables – net 1,319 1,280
Other receivables 363 355
Less: provision for impairment (5) (12)
Other receivables – net 358 343
Amounts owed by associates 15 28
Amounts owed by joint ventures 8 4
Prepayments and accrued income 163 182
Total trade and other receivables 1,863 1,837
Analysed as:
Current
Trade receivables – net 1,308 1,265
Other receivables – net 269 259
Amounts owed by associates 4 17
Amounts owed by joint ventures 8 4
Prepayments and accrued income 153 166
1,742 1,711
Non-current
Trade receivables – net 11 15
Other receivables – net 89 84
Amounts owed by associates 11 11
Prepayments and accrued income 10 16
121 126
Notes to the consolidated financial statements continued
134 SABMiller plc Annual Report 2016
16. Trade and other receivables continued
The net carrying values of trade and other receivables are considered a close approximation of their fair values.
At 31 March 2016 trade and other receivables of US$462 million (2015: US$415 million) were past due but not impaired. These relate to customers
of whom there is no recent history of default. The ageing of these trade and other receivables is shown below.
Past due
Fully
performing
US$m
Within
30 days
US$m
30-60 days
US$m
60-90 days
US$m
90-180 days
US$m
Over
180 days
US$m
At 31 March 2016
Trade receivables 938 175 65 25 35 36
Other receivables 221 42 11 4 24 44
Amounts owed by associates 14 1 – – – –
Amounts owed by joint ventures 8 – – – – –
At 31 March 2015
Trade receivables 937 165 47 19 24 41
Other receivables 232 45 8 4 15 22
Amounts owed by associates 3 13 3 – 9 –
Amounts owed by joint ventures 4 – – – – –
The group holds collateral as security for past due trade receivables to the value of US$7 million (2015: US$9 million). Collateral held primarily includes
bank guarantees and charges over assets.
At 31 March 2016 trade receivables of US$174 million (2015: US$179 million) were determined to be specifically impaired and provided for. The
amount of the provision at 31 March 2016 was US$129 million (2015: US$132 million) and reflects trade receivables from customers which are
considered to be experiencing difficult economic situations. It was assessed that a portion of these receivables is expected to be recovered. The
group holds collateral as security against specifically impaired trade receivables with a fair value of US$2 million (2015: US$1 million).
At 31 March 2016 other receivables of US$17 million (2015: US$29 million) were determined to be specifically impaired and provided for. The amount
of the provision at 31 March 2016 was US$5 million (2015: US$12 million) and reflects loans to customers which are considered to be experiencing
difficult economic situations. It was assessed that a portion of these receivables is expected to be recovered. No collateral was held as security
against specifically impaired other receivables in either of the years ended 31 March 2016 and 2015.
The carrying amounts of trade and other receivables are denominated in the following currencies.
2016
US$m
2015
US$m
Australian dollars 190 161
British pound 100 112
Colombian peso 95 117
Czech koruna 80 76
Euro 206 169
Indian rupee 182 130
Polish zloty 136 143
SA rand 269 297
US dollars 171 183
Other currencies 434 449
1,863 1,837
Movements on the provisions for impairment of trade receivables and other receivables are as follows.
Trade receivables Other receivables
2016
US$m
2015
US$m
2016
US$m
2015
US$m
At 1 April (132) (144) (12) (12)
Provision for receivables impairment (26) (34) 1 –
Receivables written off during the year as uncollectible 26 21 5 (2)
Exchange adjustments 3 25 1 2
At 31 March (129) (132) (5) (12)
The creation of provisions for impaired receivables is included in net operating expenses in the income statement (see note 3).
135SABMiller plc Annual Report 2016
FINANCIALSTATEMENTS
FINANCIAL STATEMENTS
17. Cash and cash equivalents
2016
US$m
2015
US$m
Short-term deposits 996 528
Cash at bank and in hand 434 437
1,430 965
Cash and short-term deposits of US$109 million (2015: US$117 million) are held in certain African countries (including South Africa) and are subject
to local exchange control regulations. These local exchange control regulations provide for restrictions on exporting capital from those countries,
other than through normal dividends. As normal dividends are generally able to be paid, these restrictions are not expected to have a material impact
on the group’s ability to meet its ongoing obligations.
18. Trade and other payables
2016
US$m
2015
US$m
Trade payables 1,478 1,404
Accruals 704 651
Deferred income 8 8
Containers in the hands of customers 437 443
Amounts owed to associates 36 38
Amounts owed to joint ventures 14 18
Deferred consideration for acquisitions – 4
Excise duty payable 331 344
VAT and other taxes payable 212 221
Other payables 678 615
Total trade and other payables 3,898 3,746
Analysed as:
Current
Trade payables 1,478 1,404
Accruals 704 651
Deferred income 2 4
Containers in the hands of customers 437 443
Amounts owed to associates 36 38
Amounts owed to joint ventures 14 18
Deferred consideration for acquisitions – 4
Excise duty payable 331 344
VAT and other taxes payable 212 221
Other payables 656 601
3,870 3,728
Non-current
Deferred income 6 4
Other payables 22 14
28 18
Notes to the consolidated financial statements continued
136 SABMiller plc Annual Report 2016
19. Deferred taxation
The movement on the net deferred tax liability is shown below.
2016
US$m
2015
US$m
At 1 April 2,112 3,131
Exchange adjustments (131) (345)
Acquisitions – through business combinations 26 1
Rate change 1 5
Transfers from current tax 58 3
Reclassification1
– (293)
Credited to the income statement (36) (323)
Deferred tax on items (credited)/charged to other comprehensive loss:
– Financial instruments (18) 3
– Remeasurements of defined benefit plans 29 (70)
At 31 March 2,041 2,112
The movements in deferred tax assets and liabilities (after offsetting of balances as permitted by IAS 12) during the year are shown below.
Fixed asset
allowances
US$m
Tax losses
and credits
US$m
Intangibles
US$m
Financial
instruments
US$m
Investment in
MillerCoors
joint venture
US$m
Other timing
differences
US$m
Total
US$m
Deferred tax liabilities
At 1 April 2014 724 (413) 2,380 (48) 644 (41) 3,246
Exchange adjustments (113) 123 (419) (2) – 33 (378)
Acquisitions – through business combinations 1 – – – – – 1
Rate change (3) – 11 – – (3) 5
Transfers (from)/to deferred tax assets (38) 2 – 2 3 18 (13)
Reclassification1
– (293) – – – – (293)
Charged/(credited) to the income statement 29 (81) (100) 7 (5) (74) (224)
Deferred tax on items charged/(credited) to other
comprehensive loss:
– Financial instruments – – – 1 – – 1
– Remeasurements of defined benefit plans – – – – (68) (2) (70)
At 31 March 2015 600 (662) 1,872 (40) 574 (69) 2,275
Exchange adjustments (75) (3) (69) (1) – 20 (128)
Acquisitions – through business combinations 1 – 25 – – – 26
Rate change (3) – (1) – – – (4)
Transfers from current tax – 56 – – – 2 58
Transfers from deferred tax assets – – – – – (2) (2)
Charged/(credited) to the income statement 49 (8) (73) (9) 23 32 14
Deferred tax on items (credited)/charged to other
comprehensive loss:
– Financial instruments – – – (5) (13) – (18)
– Remeasurements of defined benefit plans – – – – 28 1 29
At 31 March 2016 572 (617) 1,754 (55) 612 (16) 2,250
1
Following clarification from the IFRS Interpretations Committee during 2014 regarding the recognition of deferred taxes, US$293 million was reclassified from goodwill to net deferred tax
liabilities, with no impact on results or net assets.
Fixed asset
allowances
US$m
Provisions
and accruals
US$m
Other timing
differences
US$m
Total
US$m
Deferred tax assets
At 1 April 2014 (16) 35 96 115
Exchange adjustments (3) (5) (25) (33)
Transfers from current tax – – (3) (3)
Transfers (to)/from deferred tax liabilities (38) 19 6 (13)
Credited to the income statement 89 8 2 99
Deferred tax on items charged to other comprehensive income:
– Financial instruments – – (2) (2)
At 31 March 2015 32 57 74 163
Exchange adjustments – – 3 3
Rate change (4) (1) – (5)
Transfers (to)/from deferred tax liabilities – (5) 3 (2)
(Charged)/credited to the income statement (25) 7 68 50
At 31 March 2016 3 58 148 209
137SABMiller plc Annual Report 2016
FINANCIALSTATEMENTS
FINANCIAL STATEMENTS
19. Deferred taxation continued
Deferred tax assets and liabilities are only offset where there is a legally enforceable right of offset and the deferred tax assets and liabilities relate
to income taxes levied by the same taxation authority on either the same taxable entity or different taxable entities where there is an intention to settle
the balances on a net basis.
The deferred tax asset arises due to timing differences in Corporate, Europe, Africa and Latin America. Given both recent and forecast trading, the
directors are of the opinion that the level of profits in the foreseeable future is more likely than not to be sufficient to recover these assets.
Deferred tax liabilities of US$1,784 million (2015: US$2,013 million) are expected to fall due after more than one year and deferred tax assets of
US$104 million (2015: US$115 million) are expected to be recovered after more than one year.
2016
US$m
2015
US$m
Unrecognised deferred tax assets
Deferred tax assets have not been recognised in respect of the following items:
Tax losses 158 281
Tax credits 1,477 1,355
Depreciation in excess of capital allowances 10 7
Share-based payments 51 47
1,696 1,690
Deferred tax assets in respect of tax losses are not recognised unless there is convincing evidence that existing taxable temporary differences will
reverse in the future or there will be sufficient taxable profits in future years to recover the assets. A material element of the tax losses arose in the UK.
A portion (US$53 million) has now been recognised due to the group’s growing UK business and increasing activities within the corporate head office,
which are reflected in the group’s future forecasts. US$102 million (2015: US$229 million) of the total unrecognised tax losses do not expire.
Deferred tax assets in respect of tax credits arising which are carried forward for offset against future profits are not recognised unless it is probable that
future profits will arise. US$1,468 million (2015: US$1,345 million) of these tax credits expire within 10 years.
Deferred tax is recognised on the unremitted earnings of overseas subsidiaries where there is an intention to distribute those reserves. A deferred tax
liability of US$10 million (2015: US$11 million) has been recognised. A deferred tax liability of US$48 million (2015: US$56 million) has been recognised
in respect of unremitted profits of associates where a dividend policy is not in place. Unremitted earnings of subsidiaries, associates and joint ventures
operating in lower tax jurisdictions do not result in a deferred tax liability where the reporting entity is able to control the timing of the reversal of temporary
differences and it is probable that the temporary differences will not reverse in the foreseeable future. Similarly no tax is provided where there are plans
to remit overseas earnings of subsidiaries but it is not expected that such distributions will give rise to a tax liability.
As a result of UK legislation which largely exempts overseas dividends from tax, the temporary differences arising on unremitted profits are unlikely to
lead to additional corporate taxes. However, remittance to the UK of those earnings may still result in a tax liability, principally as a result of withholding
taxes levied by the overseas tax jurisdictions in which those subsidiaries operate.
20. Borrowings
2016
US$m
2015
US$m
Current
Secured
Overdrafts 12 29
Obligations under finance leases 13 10
Other secured loans 4 –
29 39
Unsecured
Overdrafts 147 186
Unsecured bonds 2,324 712
Other unsecured loans 426 1,024
2,897 1,922
Total current borrowings 2,926 1,961
Notes to the consolidated financial statements continued
138 SABMiller plc Annual Report 2016
20. Borrowings continued
2016
US$m
2015
US$m
Non-current
Secured
Obligations under finance leases 48 43
Other secured loans 5 1
53 44
Unsecured
Unsecured bonds 8,521 10,203
Unsecured loans 240 336
8,761 10,539
Total non-current borrowings 8,814 10,583
Total current and non-current borrowings 11,740 12,544
Analysed as:
Overdrafts 159 215
Bank loans 675 1,361
Bonds 10,845 10,915
Obligations under finance leases 61 53
11,740 12,544
Maturity of non-current financial liabilities
The maturity profile of the carrying amount of the group’s non-current financial liabilities at 31 March was as follows.
Bank loans
US$m
Bonds
US$m
Finance
leases
US$m
Net
derivative
financial
assets¹
US$m
2016
Total
US$m
Bank loans
US$m
Bonds
US$m
Finance
leases
US$m
Net
derivative
financial
assets¹
US$m
2015
Total
US$m
Amounts falling due:
Between one and two years 190 67 13 (16) 254 96 2,327 10 (264) 2,169
Between two and three years 55 1,859 10 (104) 1,820 239 90 7 (23) 313
Between three and four years – 1,158 8 (22) 1,144 1 1,867 6 (122) 1,752
Between four and five years – 540 7 (7) 540 – 1,068 7 (19) 1,056
In five years or more – 4,897 10 (398) 4,509 1 4,851 13 (333) 4,532
245 8,521 48 (547) 8,267 337 10,203 43 (761) 9,822
¹ Net financing-related derivative financial instruments only (note 22).
2016
On 7 August 2015 FBG Treasury (Aust) Pty Ltd issued AUD700 million, 3.75% Notes due August 2020, guaranteed by SABMiller plc.
2015
There were no bonds issued during the year ended 31 March 2015.
In December 2014 US$850 million, 6.5% Notes due 2016 were redeemed early.
139SABMiller plc Annual Report 2016
FINANCIALSTATEMENTS
FINANCIAL STATEMENTS
20. Borrowings continued
Maturity of obligations under finance leases
Obligations under finance leases are as follows.
2016
US$m
2015
US$m
The minimum lease payments under finance leases fall due as follows.
Within one year 16 11
Between one and five years 45 36
In five years or more 12 15
73 62
Future finance charges (12) (9)
Present value of finance lease liabilities 61 53
21. Financial risk factors
Financial risk management
Overview
In the normal course of business, the group is exposed to the following financial risks:
− Market risk
− Credit risk
– Liquidity risk
This note explains the group’s exposure to each of the above risks, aided by quantitative disclosures included throughout these consolidated financial
statements, and it summarises the policies and processes that are in place to measure and manage the risks arising, including those related to the
management of capital.
The directors are ultimately responsible for the establishment and oversight of the group’s risk management framework. An essential part of this
framework is the role undertaken by the audit committee of the board, supported by the internal audit function, and by the Chief Financial Officer,
who in this regard is supported by the treasury committee and the group treasury function. Among other responsibilities, the audit committee reviews
the internal control environment and risk management systems within the group and it reports its activities to the board. The board also receives
a quarterly report on treasury activities, including confirmation of compliance with treasury risk management policies.
The group treasury function is responsible for the management of cash, borrowings and the financial risks arising in relation to interest rates, foreign
exchange rates and the price risk of some commodities. The responsibility for the management of the remaining commodities exposures primarily lies
with the group’s centralised procurement function, SABMiller Procurement GmbH (SABMiller Procurement). Some of the risk management strategies
include the use of derivatives in order to manage the currency, interest rate and commodities exposures arising from the group’s operations. It is the
policy of the group that no trading in financial instruments be undertaken.
The group’s treasury policies are established to identify and analyse the financial risks faced by the group, to set appropriate risk limits and controls
and to monitor exposures and adherence to limits.
a. Market risk
(i) Foreign exchange risk
The group is subject to exposure on the translation of the foreign currency denominated net assets of subsidiaries, associates and joint ventures
into the group’s US dollar reporting currency. The group seeks to mitigate this exposure, where cost effective, by borrowing in the same currencies
as the functional currencies of its main operating units or by achieving the same effect through the use of derivatives. An approximate nominal value
equivalent to US$2,519 million (2015: US$3,691 million) of borrowings has been swapped into currencies that match the currency of the underlying
operations of the group, including Australian dollar, Colombian peso, Czech koruna, Peruvian nuevo sol, Polish zloty and South African rand.
The group does not hedge currency exposures from the translation of profits earned in foreign currency subsidiaries, associates and joint ventures.
The group is also exposed to transactional currency risk on sales and purchases that are denominated in a currency other than the respective
functional currencies of group entities. These exposures are managed primarily by the group treasury function which, subject to regulatory
constraints or currency market limitations, hedges a proportion of the foreign currency exposures estimated to arise over a period of up to 18
months. Committed transactional exposures that are certain are hedged fully without limitation in time. The group principally uses forward exchange
derivatives to hedge currency risk.
The tables below set out the group’s currency exposures from financial assets and liabilities held by group companies in currencies other than their
functional currencies and resulting in exchange movements in the income statement and balance sheet. The sensitivity analysis has been prepared
on a basis consistent with the prior year, based on reasonably possible changes in exchange rates, and assumes all other variables are held constant.
Notes to the consolidated financial statements continued
140 SABMiller plc Annual Report 2016
21. Financial risk factors continued
Australian
dollars
US$m
Euro
US$m
Latin
American
currencies
US$m
Other
European
currencies
US$m
SA
rand
US$m
US dollars
US$m
Other
US$m
Total
US$m
Financial assets
Trade and other receivables 74 140 17 278 141 122 27 799
Derivative financial instruments¹ 55 3,047 24 831 55 1,209 54 5,275
Cash and cash equivalents – 22 – 32 6 48 – 108
Intra-group assets 37 1,088 18 448 29 127 1 1,748
166 4,297 59 1,589 231 1,506 82 7,930
Financial liabilities
Trade and other payables (72) (142) – (294) (63) (389) (4) (964)
Derivative financial instruments¹ (75) (2,640) (937) (1,650) (554) (163) (18) (6,037)
Borrowings (2) (1,164) – (5) – (775) (1) (1,947)
Intra-group liabilities (99) (37) (1) (180) (21) (329) – (667)
(248) (3,983) (938) (2,129) (638) (1,656) (23) (9,615)
At 31 March 2016 (82) 314 (879) (540) (407) (150) 59 (1,685)
Potential impact on profit for the year
– gain/(loss)
20% increase in functional currency 10 (1) (6) (1) 3 14 (10) 9
20% decrease in functional currency (12) 2 7 1 (3) (17) 12 (10)
Potential impact on other comprehensive
income – gain/(loss)
20% increase in functional currency 4 (51) 152 91 65 10 – 271
20% decrease in functional currency (4) 61 (183) (109) (78) (13) – (326)
¹ These represent the notional amounts of derivative financial instruments.
Australian
dollars
US$m
Euro
US$m
Latin
American
currencies
US$m
Other
European
currencies
US$m
SA
rand
US$m
US dollars
US$m
Other
US$m
Total
US$m
Financial assets
Trade and other receivables 1 82 – 121 150 36 42 432
Derivative financial instruments¹ 79 3,230 – 1,260 73 2,060 – 6,702
Cash and cash equivalents – 20 1 181 3 26 9 240
Intra-group assets 31 1,131 – 422 12 277 2 1,875
111 4,463 1 1,984 238 2,399 53 9,249
Financial liabilities
Trade and other payables (25) (195) – (190) (46) (348) (3) (807)
Derivative financial instruments¹ (563) (3,009) (884) (2,041) (787) (286) – (7,570)
Borrowings – (1,071) – (5) (1) (1,497) (19) (2,593)
Intra-group liabilities (44) (31) (1) (142) (25) (177) (2) (422)
(632) (4,306) (885) (2,378) (859) (2,308) (24) (11,392)
At 31 March 2015 (521) 157 (884) (394) (621) 91 29 (2,143)
Potential impact on profit for the year
– gain/(loss)
20% increase in functional currency 1 3 32 (11) (4) 43 (5) 59
20% decrease in functional currency (1) (4) (38) 13 5 (52) 6 (71)
Potential impact on other comprehensive
income – gain/(loss)
20% increase in functional currency 86 (29) 116 77 107 (58) – 299
20% decrease in functional currency (103) 35 (139) (92) (129) 70 – (358)
¹ These represent the notional amounts of derivative financial instruments.
141SABMiller plc Annual Report 2016
FINANCIALSTATEMENTS
FINANCIAL STATEMENTS
21. Financial risk factors continued
The group holds foreign currency cash flow hedges totalling US$2,388 million at 31 March 2016 (2015: US$1,892 million). The foreign exchange
gains or losses on these contracts are recorded in the cash flow hedging reserve until the hedged transactions occur, at which time the respective
gains and losses are transferred to inventory, property, plant and equipment, goodwill or to the income statement as appropriate.
The group holds net investment hedges totalling US$2,220 million at 31 March 2016 (2015: US$3,111 million). The foreign exchange gains or losses
on these instruments are recorded in the net investment hedging reserve and partially offset the foreign currency translation risk on the group’s
foreign currency net assets.
(ii) Interest rate risk
Interest rate risk is monitored based on net debt exposures. As at 31 March 2016 40% (2015: 57%) of net debt was in fixed rates taking into account
interest rate derivatives.
The group’s practice is to borrow (direct or synthetically) in floating rates, reflecting the fact that floating rates are generally lower than fixed rates
over the medium term. The extent to which group borrowings may be in floating rates is restricted by policy such that the impact of a 1% increase
in interest rates on finance costs can be no more than an agreed proportion of adjusted EBITDA. The policy excludes borrowings arising from
acquisitions in the previous six months. Exposure to movements in interest rates on group borrowings is managed through interest rate derivatives.
The cash flow interest rate risk sensitivities on variable debt and interest rate swaps are shown in the table below. This analysis assumes all other
variables, in particular foreign currency rates, remain constant. The analysis was performed on the same basis in the prior year, based on reasonably
possible changes in interest rates.
2016
US$m
2015
US$m
Net debt 9,638 10,465
Less: fixed rate debt (7,814) (9,550)
Variable rate debt 1,824 915
Adjust for:
Financial derivatives 3,916 3,545
Net variable rate debt exposure 5,740 4,460
+/- 100 bps change
Potential impact on profit for the year 57 45
+/- 100 bps change
Potential impact on other comprehensive income – –
Fair value sensitivity analysis for fixed income instruments
Changes in the market interest rates of non-derivative financial instruments with fixed interest rates only affect income if these are measured at their
fair value. As such, all financial instruments with fixed rates of interest that are accounted for at amortised cost are not subject to interest rate risk as
defined in IFRS 7.
The group holds derivative contracts with a nominal value of US$5,416 million as at 31 March 2016 (2015: US$4,204 million) which are designated as
fair value hedges. In the case of these instruments and the underlying fixed rate bonds, changes in the fair values of the hedged item and the hedging
instrument attributable to interest rate movements materially net off in the income statement in the same period.
(iii) Price risk
Commodity price risk
The group is exposed to variability in the price of commodities used in the production or in the packaging of finished products, such as the price of
malt, barley, sugar, diesel and aluminium. Commodity price risk is managed within minimum and maximum guard rails principally through multi-year
fixed price contracts with suppliers and, where appropriate, derivative contracts.
At 31 March 2016 the notional value of commodity derivatives amounted to US$184 million (2015: US$142 million). No sensitivity analysis has been
provided on these outstanding contracts as the impact is considered to be immaterial.
Equity securities price risk
The group is exposed to equity securities price risk because of investments held by the group and classified on the balance sheet as available
for sale investments. No sensitivity analysis has been provided on these outstanding contracts as the impact is considered to be immaterial.
b. Credit risk
Credit risk is the risk of financial loss to the group if a customer or counterparty to a financial instrument fails to meet its contractual obligations.
Financial instruments
The group limits its exposure to financial institutions by setting credit limits on a sliding scale based on their credit ratings and generally dealing
only with counterparties with a minimum credit rating of BBB- from S&P and Fitch, and Baa3 from Moody’s. For banks with a lower credit rating,
or with no international credit rating, a maximum limit of US$5 million is applied, unless specific approval is obtained from either the Chief
Financial Officer or the audit committee of the board. The utilisation of credit limits is regularly monitored. To reduce credit exposures, the
group has ISDA Master Agreements with most of its counterparties for financial derivatives, which permit net settlement of assets and liabilities
in certain circumstances.
Notes to the consolidated financial statements continued
142 SABMiller plc Annual Report 2016
21. Financial risk factors continued
Trade and other receivables
There is no significant concentration of credit risk with respect to trade receivables as the group has a large number of customers which are
internationally dispersed. The type of customers range from wholesalers and distributors to smaller retailers. The group has implemented policies
that require appropriate credit checks on potential customers before sales commence. Credit risk is managed by limiting the aggregate amount
of exposure to any one counterparty.
The group considers its maximum credit risk to be US$3,884 million (2015: US$3,760 million) which is the total of the group’s financial assets.
c. Liquidity risk
Liquidity risk is the risk that the group will not be able to meet its financial obligations as they fall due.
The group finances its operations through cash generated by the business and a mixture of short-term and medium-term bank credit facilities,
bank loans, corporate bonds and commercial paper with a range of maturity dates. In this way, the group ensures that it is not overly reliant on any
particular liquidity source or that maturities of borrowings sourced in this way are not overly concentrated.
Subsidiaries have access to local bank credit facilities, but are principally funded by the group.
Liquidity risk faced by the group is mitigated by having diverse sources of finance available to it and by maintaining substantial unutilised banking
facilities and reserve borrowing capacity, as indicated by the level of undrawn facilities.
Undrawn borrowing facilities
The group had the following undrawn committed borrowing facilities available at 31 March in respect of which all conditions precedent had been
met at that date.
2016
US$m
2015
US$m
Amounts expiring:
Within one year 108 65
Between one and two years 5 76
Between two and five years 3,500 3,503
3,613 3,644
At 31 March 2016 the group had the following core lines of credit that were available for general corporate purposes.
SABMiller plc:
– US$2,500 million committed syndicated revolving credit facility, which is due to expire in May 2020.
SABMiller Holdings Inc:
– US$1,000 million committed syndicated revolving credit facility, which is due to expire in May 2020.
In April 2016 the group extended its existing US$2,500 million and US$1,000 million committed syndicated facilities, both shown as undrawn in the
table above, by one year to May 2021, with the exception of US$117 million for which the maturity remains May 2020.
The table below analyses the group’s financial liabilities into relevant maturity groupings based on the remaining period at the balance sheet date to
the contractual settlement date. The amounts disclosed in the table are the contractual undiscounted cash flows. The amounts disclosed for financial
guarantee contracts represent the maximum possible cash outflows for guarantees provided in respect of associates’ and third party bank facilities,
which would only be payable upon the occurrence of certain default events. Should such events occur, certain remedies are available that could
mitigate the impact.
Less than
1 year
US$m
Between
1 and 2 years
US$m
Between
2 and 5 years
US$m
Over
5 years
US$m
At 31 March 2016
Borrowings (3,305) (598) (4,305) (6,771)
Net settled derivative financial instruments (92) (9) (2) –
Gross settled derivative financial instruments – inflows 2,596 114 5 –
Gross settled derivative financial instruments – outflows (2,715) (120) (6) –
Trade and other payables (3,325) (17) (1) (4)
Financial guarantee contracts (120) – – –
At 31 March 2015
Borrowings (2,355) (2,853) (3,940) (6,978)
Net settled derivative financial instruments (32) (6) (2) –
Gross settled derivative financial instruments – inflows 1,570 79 – –
Gross settled derivative financial instruments – outflows (1,653) (80) – –
Trade and other payables (3,158) (14) – –
Financial guarantee contracts (122) – – –
143SABMiller plc Annual Report 2016
FINANCIALSTATEMENTS
FINANCIAL STATEMENTS
21. Financial risk factors continued
Capital management
The capital structure of the group consists of net debt (see note 27c) and shareholders’ equity.
The group’s policy is to maintain a strong capital base so as to maintain investor, creditor and market confidence and to sustain future development
of the business.
Besides the minimum capitalisation rules that may apply to subsidiaries in different countries, the group’s only externally imposed capital requirement
relates to the group’s core lines of credit which include a net debt to EBITDA financial covenant which was complied with throughout the year.
The group monitors its financial capacity and credit ratings by reference to a number of key financial ratios and cash flow metrics including net debt
to adjusted EBITDA and interest cover. These provide a framework within which the group’s capital base is managed including dividend policy.
If the group fails to meet the financial targets required by the ratings agencies, a credit rating downgrade could impact the average interest rate
of borrowings and the future availability of credit to the group.
The group is currently rated A3 under review for downgrade by Moody’s Investors Service and A-/stable outlook by S&P Global Ratings.
Fair value estimation
The following tables present the group’s financial assets and liabilities that are measured at fair value on a recurring basis, and the fair values of other
assets and liabilities that are not measured at fair value, but where the fair value is required to be disclosed in the financial statements.
Recurring fair value measurements
Level 1
US$m
Level 2
US$m
Level 3
US$m
Total
US$m
At 31 March 2016
Assets
Derivative financial instruments – 846 – 846
Available for sale investments – 6 13 19
Total assets – 852 13 865
Liabilities
Derivative financial instruments – (239) – (239)
Total liabilities – (239) – (239)
At 31 March 2015
Assets
Derivative financial instruments – 1,233 – 1,233
Available for sale investments – 9 12 21
Total assets – 1,242 12 1,254
Liabilities
Derivative financial instruments – (111) – (111)
Total liabilities – (111) – (111)
Notes to the consolidated financial statements continued
144 SABMiller plc Annual Report 2016
21. Financial risk factors continued
Assets and liabilities for which fair values are disclosed
Carrying
amount
US$m
Level 1
US$m
Level 2
US$m
Level 3
US$m
Total
US$m
At 31 March 2016
Assets
Investments in listed associates
– Anadolu Efes 991 1,081 – – 1,081
– Distell Group 209 624 – – 624
– Delta Corporation 246 281 – – 281
Total assets 1,446 1,986 – – 1,986
Liabilities
Current borrowings (2,926) (2,340) (610) – (2,950)
Non-current borrowings (8,814) (8,818) (299) – (9,117)
Total liabilities (11,740) (11,158) (909) – (12,067)
At 31 March 2015
Assets
Investments in listed associates
– Anadolu Efes 1,080 1,187 – – 1,187
– Distell Group 211 741 – – 741
– Delta Corporation 179 324 – – 324
Total assets 1,470 2,252 – – 2,252
Liabilities
Current borrowings (1,961) (717) (1,253) – (1,970)
Non-current borrowings (10,583) (10,688) (390) – (11,078)
Total liabilities (12,544) (11,405) (1,643) – (13,048)
There have been no material transfers between levels during the year ended 31 March 2016 (2015: none).
The levels of the fair value hierarchy and its application to the group’s assets and liabilities are described below.
Level 1: Quoted prices (unadjusted) in active markets for identical assets or liabilities.
The fair value of assets and liabilities traded in active markets is based on quoted market prices at the balance sheet date. A market is regarded as
active if quoted prices are readily and regularly available from an exchange, dealer, broker, industry group, pricing service, or regulatory agency, and
those prices represent actual and regularly occurring market transactions on an arm’s length basis. The quoted market price used for financial assets
held by the group is the current bid price.
Level 2: Inputs other than quoted prices that are observable for the asset or liability, either directly (i.e. as prices) or indirectly (i.e. derived from prices).
The fair values of financial instruments that are not traded in an active market (for example, over the counter derivatives or infrequently traded listed
investments) are determined by using valuation techniques. These valuation techniques maximise the use of observable market data where it is
available and rely as little as possible on entity specific estimates. If all significant inputs required to fair value an instrument are observable, the
instrument is included in level 2.
The fair values of derivatives included in level 2 incorporate various inputs including the credit quality of counterparties, spot and forward foreign
exchange rates, and interest rate curves.
The fair values of borrowings included in level 2 are based on the net present value of the anticipated future cash flows associated with these
instruments, using rates currently available for debt on similar terms, credit risk and remaining maturities.
Valuation techniques for other level 2 instruments could include standard valuation models based on market parameters for interest rates, yield
curves or foreign exchange rates quotes for similar instruments from financial counterparties or the use of comparable arm’s length transactions,
and discounted cash flows.
Level 3: Inputs for the asset or liability that are not based on observable market data.
Specific valuation techniques, such as discounted cash flow analysis, are used to determine fair value of the remaining financial instruments.
Valuation process
The group’s treasury function is responsible for performing fair value measurements for financial instruments. The fair value measurement
calculations are subject to review procedures and are performed in accordance with policies defined by the treasury committee.
Other fair value measurements are performed by the group’s finance department. Significant level 3 valuations are reviewed and approved by the
finance, control and assurance committee in the relevant region on a by exception basis. Valuations falling into this category are usually immaterial.
145SABMiller plc Annual Report 2016
FINANCIALSTATEMENTS
FINANCIAL STATEMENTS
22. Derivative financial instruments
Current derivative financial instruments
2016 2015
Notional value
US$m
Assets
US$m
Liabilities
US$m
Notional value
US$m
Assets
US$m
Liabilities
US$m
Fair value hedges
Interest rate swaps 1,500 16 (5) 700 11 –
Cash flow hedges
Forward foreign currency contracts 2,207 13 (43) 1,757 51 (30)
Cross currency swaps 212 89 – 492 208 –
Commodity contracts 103 1 (10) 97 3 (7)
Net investment hedges
Forward foreign currency contracts 1,534 4 (104) 2,080 109 (11)
Cross currency swaps 171 114 (2) 241 30 (2)
Held for trading
Interest rate swaps 1,000 15 (2) – – –
Forward foreign currency contracts 1,509 27 (43) 1,439 51 (51)
Cross currency swaps 34 1 – – – –
Commodity contracts 13 1 (4) – – –
8,283 281 (213) 6,806 463 (101)
Financing-related current derivative financial instruments amount to a net asset of US$125 million (2015: US$353 million).
Non-current derivative financial instruments
2016 2015
Notional value
US$m
Assets
US$m
Liabilities
US$m
Notional value
US$m
Assets
US$m
Liabilities
US$m
Fair value hedges
Interest rate swaps 3,916 347 (11) 3,504 289 (1)
Cash flow hedges
Forward foreign currency contracts 181 – (2) 135 1 (1)
Cross currency swaps 210 99 – 420 206 –
Commodity contracts 64 – (5) 45 2 (3)
Net investment hedges
Cross currency swaps 84 17 – 264 123 –
Held for trading
Interest rate swaps 600 24 (5) 1,600 64 (5)
Cross currency swaps 274 78 (2) 170 85 –
Commodity contracts 4 – (1) – – –
5,333 565 (26) 6,138 770 (10)
Financing-related non-current derivative financial instruments amount to a net asset of US$547 million (2015: US$761 million).
Derivatives designated as hedging instruments
(i) Fair value hedges
The group has entered into interest rate swaps to pay floating and receive fixed interest which have been designated as fair value hedges to hedge
exposure to changes in the fair value of its US dollar, euro and Australian dollar fixed rate borrowings. Borrowings are designated as the hedged item
as part of the fair value hedge. The borrowings and the interest rate swaps have the same critical terms.
As at 31 March 2016 the carrying value of the hedged borrowings was US$5,782 million (2015: US$4,363 million).
(ii) Cash flow hedges
The group has entered into forward exchange contracts designated as cash flow hedges to manage short-term foreign currency exposures
to expected net operating costs including future trade imports and exports.
The group has entered into cross currency swaps designated as cash flow hedges to manage foreign currency exposures on interest payments.
The group has entered into commodity contracts designated as cash flow hedges to manage the future price of commodities. As at 31 March 2016
the notional amount of forward contracts for the purchase price of aluminium was US$128 million (2015: US$115 million), of corn was US$26 million
(2015: US$21 million), of sugar was US$9 million (2015: US$4 million) and of diesel was US$4 million (2015: US$2 million).
Notes to the consolidated financial statements continued
146 SABMiller plc Annual Report 2016
22. Derivative financial instruments continued
The following table indicates the period in which the cash flows associated with derivatives that are cash flow hedges are expected to occur and
impact the income statement.
Carrying
amount
US$m
Expected
cash flows
US$m
Less than
1 year
US$m
Between
1 and 2 years
US$m
Between
2 and 5 years
US$m
Over 5 years
US$m
At 31 March 2016
Forward foreign currency contracts (32) (62) (56) (6) – –
Commodity contracts (14) (18) (13) (5) – –
Cross currency swaps 188 193 88 (2) (1) 108
142 113 19 (13) (1) 108
At 31 March 2015
Forward foreign currency contracts 21 7 8 (1) – –
Commodity contracts (5) (9) (6) (2) (1) –
Cross currency swaps 414 407 202 89 4 112
430 405 204 86 3 112
(iii) Hedges of net investments in foreign operations
The group has entered into several forward foreign currency contracts and cross currency swaps which it has designated as hedges of net
investments in its foreign subsidiaries in South Africa, the Czech Republic, Poland, Colombia and Peru to hedge the group’s exposure to foreign
exchange risk on these investments, and in Australia in 2015.
Analysis of notional amounts of derivative financial instruments designated as net investment hedges is as follows. Notional amounts have been
translated to US dollars at the closing rate at 31 March.
2016
US$m
2015
US$m
Forward foreign currency contracts:
Australian dollar – 515
Colombian peso 455 439
Czech koruna 208 192
Peruvian nuevo sol 304 257
Polish zloty 189 164
South African rand 378 513
Cross currency swaps:
Czech koruna 160 297
Polish zloty – 92
South African rand 95 116
1,789 2,585
Held for trading derivative financial instruments
(i) Interest rate swaps
The group has entered into interest rate swaps to manage exposures to fluctuations in interest rates. The derivatives are fair valued based on
discounted future cash flows with gains and losses taken to the income statement.
(ii) Forward foreign currency contracts
The group has entered into forward foreign currency contracts to manage short-term foreign currency exposures to expected future trade imports
and exports and to manage foreign currency exposures on intercompany loan balances. The derivatives are fair valued based on discounted future
cash flows with gains and losses taken to the income statement.
(iii) Cross currency swaps
The group has entered into cross currency swaps to manage foreign currency exposures on intercompany loan balances. These derivatives are fair
valued based on discounted future cash flows with gains and losses taken to the income statement.
(iv) Commodity contracts
The group has entered into commodity contracts to manage the future price of commodities. These derivatives are fair valued based on discounted
future cash flows with gains and losses taken to the income statement.
147SABMiller plc Annual Report 2016
FINANCIALSTATEMENTS
FINANCIAL STATEMENTS
22. Derivative financial instruments continued
Fair value (loss)/gain on financial instruments recognised in the income statement
2016
US$m
2015
US$m
Derivative financial instruments:
Interest rate swaps (37) (39)
Interest rate swaps designated as fair value hedges 28 428
Forward foreign currency contracts (117) 48
Fair value (loss)/gain on forward foreign currency contracts transferred from other comprehensive loss (17) 8
Cross currency swaps 136 52
Cross currency swaps designated as fair value hedges – (5)
Ineffectiveness arising from cross currency swaps designated as net investment hedges (5) (7)
Other fair value losses (1) –
(13) 485
Other financial instruments:
Early redemption costs (see note 4) – (48)
Other fair value gains 16 17
Non-current borrowings designated as the hedged item in a fair value hedge (28) (428)
Total fair value (loss)/gain on financial instruments recognised in the income statement (25) 26
Fair value gains and losses on borrowings and financing-related derivative financial instruments were recognised as part of net finance costs.
Fair value gains and losses on all other derivative financial instruments were recognised in operating profit.
23. Other financial instruments disclosures
Reconciliation of total financial instruments
The table below reconciles the group’s accounting categorisation of financial assets and liabilities (based on initial recognition) to the classes of assets
and liabilities as shown on the face of the balance sheet.
Fair value
through
income
statement
US$m
Loans and
receivables
US$m
Available
for sale
US$m
Financial
liabilities held
at amortised
cost
US$m
Not
categorised
as a financial
instrument
US$m
Total
US$m
Non-
current
US$m
Current
US$m
At 31 March 2016
Assets
Available for sale investments – – 19 – – 19 19 –
Derivative financial instruments 846 – – – – 846 565 281
Trade and other receivables – 1,589 – – 274 1,863 121 1,742
Cash and cash equivalents – 1,430 – – – 1,430 – 1,430
Liabilities
Derivative financial instruments (239) – – – – (239) (26) (213)
Borrowings – – – (11,740) – (11,740) (8,814) (2,926)
Trade and other payables – – – (3,347) (551) (3,898) (28) (3,870)
At 31 March 2015
Assets
Available for sale investments – – 21 – – 21 21 –
Derivative financial instruments 1,233 – – – – 1,233 770 463
Trade and other receivables – 1,541 – – 296 1,837 126 1,711
Cash and cash equivalents – 965 – – – 965 – 965
Liabilities
Derivative financial instruments (111) – – – – (111) (10) (101)
Borrowings – – – (12,544) – (12,544) (10,583) (1,961)
Trade and other payables – – – (3,173) (573) (3,746) (18) (3,728)
Notes to the consolidated financial statements continued
148 SABMiller plc Annual Report 2016
23. Other financial instruments disclosures continued
Offsetting financial assets and financial liabilities
The following table provides details of financial assets and liabilities that are subject to offsetting, enforceable master netting arrangements,
or similar agreements.
Gross amounts
of financial
assets
US$m
Gross amounts
of financial
liabilities
US$m
Net amounts
recognised in
the balance
sheet
US$m
Related
amounts of
financial
instruments
not set off in
the balance
sheet
US$m
Net amount
US$m
At 31 March 2016
Assets
Derivative financial instruments 846 – 846 (166) 680
Cash and cash equivalents 1,446 (16) 1,430 – 1,430
Liabilities
Borrowings 16 (11,756) (11,740) – (11,740)
Derivative financial instruments – (239) (239) 166 (73)
At 31 March 2015
Assets
Derivative financial instruments 1,233 – 1,233 (111) 1,122
Cash and cash equivalents 982 (17) 965 – 965
Liabilities
Borrowings 17 (12,561) (12,544) – (12,544)
Derivative financial instruments – (111) (111) 111 –
For the financial assets and liabilities subject to enforceable master netting arrangements or similar arrangements above, each party to the
agreement will have the option to settle the amounts on a net basis in the event of default of the other party. A default event includes failure by a party
to make a payment when due; failure by a party to perform any other obligation required by the agreement if such failure is not remedied within the
periods defined in each contract; or bankruptcy.
The group holds other receivables and borrowings balances with the same financial counterparties. Where these arrangements meet the set-off rules
under IFRS, the balances have been reported net on the balance sheet.
24. Provisions
Demerged
entities and
litigation
US$m
Post-
retirement
benefits
US$m
Taxation-
related
US$m
Restructuring
US$m
Payroll-
related
US$m
Onerous
contracts
US$m
Other
US$m
Total
US$m
At 1 April 2014 113 246 216 82 55 109 62 883
Exchange adjustments (17) (51) (14) (14) (9) (15) (5) (125)
Charged/(credited) to the income
statement
– Additional provision in year 6 27 14 29 8 7 10 101
– Amounts reversed (5) – (29) (7) – (8) (16) (65)
Utilised in the year (6) (24) (4) (17) (9) (33) (12) (105)
Remeasurements of defined
benefit plans recorded in other
comprehensive loss – 7 – – – – – 7
At 31 March 2015 91 205 183 73 45 60 39 696
Exchange adjustments (1) (26) (1) (1) (3) (1) – (33)
Charged/(credited) to the income
statement
– Additional provision in year 4 23 9 3 19 – 34 92
– Amounts reversed (16) – (18) (29) – – (12) (75)
Utilised in the year (5) (18) (39) (13) (8) (22) (11) (116)
Remeasurements of defined
benefit plans recorded in other
comprehensive loss – (5) – – – – – (5)
Transfers to trade and other
payables – – – – – (15) – (15)
At 31 March 2016 73 179 134 33 53 22 50 544
149SABMiller plc Annual Report 2016
FINANCIALSTATEMENTS
FINANCIAL STATEMENTS
24. Provisions continued
2016
US$m
2015
US$m
Analysed as:
Current 270 358
Non-current 274 338
544 696
Demerged entities and litigation
During the year ended 31 March 1998 the group recognised a provision of US$73 million for the disposal of certain demerged entities in relation to equity
injections which were not regarded as recoverable, as well as potential liabilities arising on warranties and the sale agreements. During the year ended
31 March 2016 US$1 million (2015: US$1 million) of this provision was utilised in regard to costs associated with SAB Ltd’s previously disposed of
remaining retail interests. The residual balance of US$4 million relates mainly to the disposal of OK Bazaars (1929) Ltd to Shoprite Holdings Ltd (Shoprite).
As disclosed in previous annual reports, a number of claims were made by Shoprite in relation to the valuation of the net assets of OK Bazaars at the
time of the sale and for alleged breaches by SAB Ltd of warranties contained in the sale agreements. These claims are being contested by SAB Ltd.
There are US$69 million (2015: US$85 million) of provisions in respect of outstanding litigation within various operations, based on management’s
expectation that the outcomes of these disputes are expected to be resolved within the forthcoming four years.
While a provision for claims has been recorded, the actual outcome of the disputes and the timing of the resolution cannot be estimated by the directors
at this time. The further information ordinarily required by IAS 37, ‘Provisions, contingent liabilities and contingent assets’ has not been disclosed on the
grounds that it can be expected to seriously prejudice the outcome of the disputes.
Post-retirement benefits
The provision for post-retirement benefits represents the provision for medical benefits for retired employees and their dependants in South Africa,
for post-retirement medical and life insurance benefits for eligible employees and their dependants in Europe, medical and other benefits in Latin
America, and pension provisions for employees primarily in Latin America, Asia Pacific and Europe. The principal assumptions on which these
provisions are based are disclosed in note 30.
Taxation-related
The group has recognised various provisions in relation to taxation exposures it believes may arise. The provisions principally relate to non-corporate
taxation and interest and penalties on corporate taxation in respect of a number of group companies. Any settlement in respect of these amounts
will occur as and when the assessments are finalised with the respective tax authorities.
Restructuring
This includes the remaining provision for restructuring costs in Australia and Europe which are expected to be utilised over the course of the next
three years.
Payroll-related
This principally relates to employee entitlement provisions of US$24 million (2015: US$23 million) in Asia Pacific and employee long service awards
of US$13 million (2015: US$15 million) in South Africa.
Onerous contracts
This includes provisions for unfavourable supply contracts for malt, glass, aluminium cans and concentrated fruit juice for non-alcoholic beverages,
as well as provisions for surplus property leases in Australia which management expects to be utilised within four years.
Other provisions
Included within other provisions are environmental provisions and other provisions. These are primarily expected to be utilised within four years.
Notes to the consolidated financial statements continued
150 SABMiller plc Annual Report 2016
25. Share capital
2016
US$m
2015
US$m
Group and company
Called up, allotted and fully paid share capital
1,679,641,620 ordinary shares of 10 US cents each (2015: 1,675,670,012) 168 168
50,000 deferred shares of £1.00 each (2015: 50,000) – –
168 168
Ordinary
shares of
10 US cents
each
Deferred
shares of
£1 each
Nominal
value
US$m
At 1 April 2014 1,672,647,930 50,000 167
Issue of shares – share incentive plans 3,022,082 – 1
At 31 March 2015 1,675,670,012 50,000 168
Issue of shares – share incentive plans 3,971,608 – –
At 31 March 2016 1,679,641,620 50,000 168
Changes to authorised share capital
With effect from 1 October 2009 the company adopted new articles of association which removed any previous limit on the authorised share capital.
Directors are still limited as to the number of shares they can at any time allot because allotment authority continues to be required under the
Companies Act 2006, save in respect of employee share plans.
Changes to issued share capital
During the year the company issued 3,971,608 (2015: 3,022,082) new ordinary shares of 10 US cents to satisfy the exercise of options granted under
the group’s share purchase, option and award schemes, for consideration of US$97 million (2015: US$62 million).
Rights and restrictions relating to share capital
Convertible participating shares
Convertible participating shares were originally issued to Altria as part of the Miller Brewing Company transaction in 2002 but were subsequently
converted into ordinary shares. There are no convertible participating shares currently in issue. Altria is however entitled to require the company
to convert its ordinary shares back into convertible participating shares so as to ensure that Altria’s voting shareholding does not exceed 24.99%
of the total voting shareholding.
If Altria’s ordinary shares were converted into convertible participating shares, the convertible participating shares would rank pari passu with the
ordinary shares of the company in relation to a distribution of the profits of the company and a return of capital. On a poll vote at general meetings of
the company, Altria would be entitled to vote in respect of its convertible participating shares on the basis of one-tenth of a vote for every convertible
participating share on all resolutions other than a resolution:
(i) proposed by any person other than Altria, to wind up the company;
(ii) proposed by any person other than Altria, to appoint an administrator or to approve any arrangement with the company’s creditors;
(iii) proposed by the board, to sell all or substantially all of the undertaking of the company; or
(iv) proposed by any person other than Altria, to alter any of the class rights attaching to the convertible participating shares or to approve the creation
of any new class of shares, in which case Altria would be entitled on a poll to vote on the resolution on the basis of one vote for each convertible
participating share.
151SABMiller plc Annual Report 2016
FINANCIALSTATEMENTS
FINANCIAL STATEMENTS
25. Share capital continued
Conversion into ordinary shares
If Altria’s ordinary shares are converted into convertible participating shares, the provisions governing possible conversion back into ordinary shares
would apply. These state that upon a transfer of convertible participating shares by Altria to any person other than to an affiliate of Altria, such convertible
participating shares shall convert into ordinary shares. In addition, Altria is entitled to require the company to convert its convertible participating shares
into ordinary shares in the event of a takeover offer for the company, or a third party acquiring more than a 24.99% voting shareholding, provided certain
conditions are met.
The company must use its best endeavours to procure that the ordinary shares arising on conversion of the convertible participating shares are
admitted to the Official List and to trading on the London Stock Exchange’s market for listed securities, admitted to listing and trading on the JSE Ltd,
and admitted to listing and trading on any other stock exchange upon which the ordinary shares are from time to time listed and traded, but no
admission to listing or trading need be sought for the convertible participating shares while they remain convertible participating shares.
Deferred shares
The deferred shares do not carry any voting rights and do not entitle their holders to receive any dividends or other distributions. In the event of
a winding up deferred shareholders would receive no more than the nominal value. Deferred shares represent the only non-equity share capital
of the group.
Share-based incentives
The group operates various share incentive plans. The share incentives outstanding are summarised as follows.
Scheme
2016
Number
2015
Number
GBP share options 8,052,528 10,620,013
ZAR share options 4,511,775 7,301,172
GBP stock appreciation rights (SARs) 9,185,858 7,083,490
ZAR stock appreciation rights (SARs) 2,479,045 1,846,842
GBP performance share awards 6,502,184 6,289,875
GBP value share awards 13,611,179 11,269,028
Total share incentives outstanding1
44,342,569 44,410,420
1
Total share incentives outstanding exclude shares relating to the BBBEE scheme.
Based on the TSR performance to 31 March 2016, only 858,391 of the theoretical maximum 13,611,179 GBP value share awards would vest.
Incentives involving 7,778,764 shares were granted, and 5,201,439 share incentives were exercised, released or lapsed after 31 March 2016 and
before the date of signing of these financial statements.
Further details relating to all of the share incentive schemes can be found in the directors’ remuneration report on pages 74 to 92.
The exercise prices of incentives outstanding at 31 March 2016 ranged from £0 to £35.64 and ZAR96.95 to ZAR651.00 (2015: £0 to £35.64 and
ZAR96.95 to ZAR611.99). The movement in share awards outstanding is summarised in the following tables.
GBP share options
GBP share options include share options granted under the Executive Share Option Plan 2008, the Approved Executive Share Option Plan 2008,
the Executive Share Option (No.2) Scheme, the Approved Executive Share Option Scheme and the International Employee Share Scheme.
No further grants can be made under the now closed Executive Share Option (No.2) Scheme, the Approved Executive Share Option Scheme,
or the International Employee Share Scheme, although outstanding grants may still be exercised until they reach their expiry date.
Number
of options
Weighted
average
exercise price
GBP
Weighted
average fair
value at grant
date
GBP
Outstanding at 1 April 2014 16,035,174 19.36 –
Granted 240,700 33.13 5.62
Lapsed (416,624) 23.47 –
Exercised (5,239,237) 17.03 –
Outstanding at 31 March 2015 10,620,013 20.66 –
Granted 248,108 34.94 5.60
Lapsed (490,200) 24.24 –
Exercised (2,325,393) 18.02 –
Outstanding at 31 March 2016 8,052,528 21.64 –
Notes to the consolidated financial statements continued
152 SABMiller plc Annual Report 2016
25. Share capital continued
ZAR share options
Share options designated in ZAR include share options granted under the South African Executive Share Option Plan 2008 and the Mirror Executive
Share Purchase Scheme (South Africa). No further grants can be made under the Mirror Executive Share Purchase Scheme (South Africa), although
outstanding grants may still be exercised until they reach their expiry date.
Number
of options
Weighted
average
exercise price
ZAR
Weighted
average fair
value at grant
date
ZAR
Outstanding at 1 April 2014 10,108,718 277.52 –
Lapsed (242,037) 381.69 –
Exercised (2,565,509) 224.27 –
Outstanding at 31 March 2015 7,301,172 292.77 –
Lapsed (133,368) 389.06 –
Exercised (2,656,029) 261.89 –
Outstanding at 31 March 2016 4,511,775 308.10 –
GBP SARs
GBP SARs include stock appreciation rights granted under the Stock Appreciation Rights Plan 2008 and the International Employee Stock
Appreciation Rights Scheme. No further grants can be made under the now closed International Employee Stock Appreciation Rights Scheme,
although outstanding grants may still be exercised until they reach their expiry date.
Number
of SARs
Weighted
average
exercise price
GBP
Weighted
average fair
value at grant
date
GBP
Outstanding at 1 April 2014 5,170,646 27.25 –
Granted 2,971,414 33.13 5.65
Lapsed (537,598) 31.96 –
Exercised (520,972) 13.91 –
Outstanding at 31 March 2015 7,083,490 30.34 –
Granted 3,033,727 34.94 5.55
Lapsed (377,901) 33.44 –
Exercised (553,458) 16.90 –
Outstanding at 31 March 2016 9,185,858 32.54 –
ZAR SARs
ZAR SARs include stock appreciation rights granted under the South African Stock Appreciation Rights Sub-Plan 2008.
Number
of SARs
Weighted
average
exercise price
ZAR
Weighted
average fair
value at grant
date
ZAR
Outstanding at 1 April 2014 1,178,200 527.49 –
Granted 824,378 590.38 160.13
Lapsed (133,946) 554.28 –
Exercised (21,790) 578.78 –
Outstanding at 31 March 2015 1,846,842 553.02 –
Granted 841,690 651.00 170.09
Lapsed (192,787) 569.99 –
Exercised (16,700) 550.64 –
Outstanding at 31 March 2016 2,479,045 584.98 –
153SABMiller plc Annual Report 2016
FINANCIALSTATEMENTS
FINANCIAL STATEMENTS
25. Share capital continued
GBP performance share awards
GBP performance share awards include awards made under the Executive Share Award Plan 2008, the Performance Share Award Scheme and
the International Performance Share Award Sub-Scheme. No further awards can be made under the Performance Share Award Scheme and the
International Performance Share Award Sub-Scheme, although outstanding awards remain and will vest, subject to the achievement of their
respective performance conditions on their vesting date.
Number
of awards
Weighted
average
exercise price
GBP
Weighted
average fair
value at grant
date
GBP
Outstanding at 1 April 2014 6,802,427 – –
Granted 2,148,339 – 30.81
Lapsed (1,455,340) – –
Released to participants (1,205,551) – –
Outstanding at 31 March 2015 6,289,875 – –
Granted 3,057,295 – 34.18
Lapsed (2,840,638) – –
Released to participants (4,348) – –
Outstanding at 31 March 2016 6,502,184 – –
GBP value share awards
The 3,167,663 (2015: 3,295,212) value share awards granted during the year ended 31 March 2016 represent the theoretical maximum number
of awards that could possibly vest in the future, although in practice it is extremely unlikely that this number of awards would be released.
Number of
value shares
(per £10 million
of additional
value)
Theoretical
maximum
shares at cap
Weighted
average
exercise price
GBP
Weighted
average fair
value at grant
date
GBP
Outstanding at 1 April 2014 2,848 11,297,444 – –
Granted 680 3,295,212 – 8.18
Lapsed (368) (3,011,712) – –
Released to participants (485) (311,916) – –
Outstanding at 31 March 2015 2,675 11,269,028 – –
Granted 563 3,167,663 – 6.84
Lapsed – (705,472) – –
Released to participants (148) (120,040) – –
Outstanding at 31 March 2016 3,090 13,611,179 – –
Of the value share awards released, 37,503 (2015: 328,554) shares were deferred and remain subject to a risk of forfeiture.
Notes to the consolidated financial statements continued
154 SABMiller plc Annual Report 2016
25. Share capital continued
Outstanding share incentives
The following table summarises information about share incentives outstanding at 31 March.
Range of exercise prices
Number
2016
Weighted
average
remaining
contractual life
in years
2016
Number
2015
Weighted
average
remaining
contractual life
in years
2015
GBP share options
£8 – £9 – – 7,650 0.1
£9 – £10 – – 12,500 3.6
£10 – £11 58,150 2.1 439,100 1.8
£11 – £12 359,543 1.1 535,643 2.1
£12 – £13 1,226,071 2.8 1,637,418 3.8
£19 – £20 1,249,098 4.2 1,544,924 5.2
£20 – £21 23,200 4.7 23,200 5.7
£22 – £23 1,803,948 5.2 2,112,785 6.2
£23 – £24 2,385,125 6.2 3,545,118 7.2
£28 – £29 35,400 6.7 67,739 7.7
£31 – £32 3,804 7.7 3,804 8.7
£33 – £34 662,112 7.5 688,280 8.5
£34 – £35 244,225 9.2 – –
£35 – £36 1,852 8.7 1,852 9.7
8,052,528 5.1 10,620,013 5.8
ZAR share options
R90 – R100 – – 13,000 0.1
R120 – R130 – – 201,243 1.0
R140 – R150 278,900 2.2 426,900 3.2
R150 – R160 82,300 3.1 307,450 3.9
R160 – R170 93,000 1.1 126,950 2.1
R180 – R190 307,150 1.9 450,600 2.9
R210 – R220 425,500 3.8 723,400 4.8
R220 – R230 486,900 4.7 719,200 5.7
R250 – R260 141,100 5.2 256,350 6.2
R290 – R300 771,501 5.7 1,216,459 6.7
R310 – R320 255,650 6.2 485,300 7.2
R400 – R410 1,169,474 6.7 1,845,320 7.7
R510 – R520 500,300 7.2 529,000 8.2
4,511,775 5.2 7,301,172 6.0
GBP SARs
£8 – £9 – – 2,000 0.1
£10 – £11 11,167 0.3 248,625 1.1
£11 – £12 249,918 1.1 354,751 2.1
£12 – £13 194,501 2.3 256,968 3.3
£13 – £14 8,700 1.6 8,700 2.6
£19 – £20 37,300 4.2 40,000 5.2
£22 – £23 43,600 5.2 46,600 6.2
£23 – £24 48,000 6.2 53,100 7.2
£31 – £32 20,196 7.7 31,496 8.7
£33 – £34 5,601,273 7.6 6,011,659 8.6
£34 – £35 2,949,105 9.2 7,493 9.9
£35 – £36 22,098 8.7 22,098 9.7
9,185,858 7.8 7,083,490 7.8
155SABMiller plc Annual Report 2016
FINANCIALSTATEMENTS
FINANCIAL STATEMENTS
25. Share capital continued
Range of exercise prices
Number
2016
Weighted
average
remaining
contractual life
in years
2016
Number
2015
Weighted
average
remaining
contractual life
in years
2015
ZAR SARs
R520 – R530 985,000 7.7 1,097,800 8.7
R580 – R590 677,488 8.2 732,556 9.2
R610 – R620 16,486 8.7 16,486 9.7
R650 – R660 800,071 9.2 – –
2,479,045 8.3 1,846,842 8.9
GBP performance share awards
£0 6,502,184 1.5 6,289,875 1.2
GBP value share awards
£0 13,611,179 1.7 11,269,028 2.2
Total share incentives outstanding 44,342,569 4.3 44,410,420 4.7
Exercisable share incentives
The following table summarises information about exercisable share incentives outstanding at 31 March.
Number
2016
Weighted
average
exercise
price
2016
Number
2015
Weighted
average
exercise
price
2015
GBP share options 6,772,525 19.93 6,106,401 17.28
ZAR share options 4,029,175 283.79 4,503,152 221.77
GBP SARs 689,386 16.89 1,053,044 14.36
ZAR SARs 34,100 567.08 11,500 545.96
Share incentives exercised or released
The weighted average market prices of the group’s shares at the date of exercise or release for share incentives exercised or released during the
year were as follows.
Number
2016
Weighted
average
market
price
2016
Number
2015
Weighted
average
market
price
2015
Share incentives designated in GBP 3,003,239 37.69 7,277,676 34.46
Share incentives designated in ZAR 2,672,729 807.93 2,587,299 618.50
Total share incentives exercised or released during the year 5,675,968 9,864,975
Broad-Based Black Economic Empowerment (BBBEE) scheme
On 9 June 2010 the initial allocation of participation rights was made in relation to the BBBEE scheme in South Africa. A total of 46.2 million new
shares in The South African Breweries (Pty) Ltd (SAB), representing 8.45% of SAB’s enlarged issued share capital, were issued. The shares in
SAB will be exchanged at the end of the estimated 10-year scheme term for shares in SABMiller plc based on a repurchase formula linked, inter
alia, to the operating performance of SAB. No performance conditions and exercise prices are attached to these shares, although the employee
component has a four-year vesting period. The weighted average fair value of each SAB share at the grant date was ZAR40.
Weighted average fair value assumptions
The fair value of services received in return for share awards granted is measured by reference to the fair value of share awards granted. The
estimate of the fair value of the services received is measured based on a binomial model approach except for the awards under Performance Share
Award schemes, the Executive Share Award Plan 2008 (including value share awards) and the BBBEE scheme which have been valued using
Monte Carlo simulations.
The Monte Carlo simulation methodology is necessary for valuing share-based payments with TSR performance hurdles. This is achieved by
projecting SABMiller plc’s share price forwards, together with those of companies in the same comparator group, over the vesting period and/or
life of the awards after considering their respective volatilities.
Notes to the consolidated financial statements continued
156 SABMiller plc Annual Report 2016
25. Share capital continued
The following weighted average assumptions were used in these option pricing models during the year.
2016 2015
Share price¹
– South African share option scheme (ZAR) 645.35 583.97
– All other schemes (GBP) 35.27 32.77
Exercise price¹
– South African share option scheme (ZAR) 651.00 590.36
– All other schemes (GBP) 12.07 12.18
Expected volatility (all schemes)² (%) 21.3 21.3
Dividend yield (all schemes) (%) 2.1 2.1
Annual forfeiture rate
– South African share option scheme (%) 5.0 5.0
– All other schemes (%) 3.0 3.0
Risk-free interest rate
– South African share option scheme (%) 7.2 7.5
– All other schemes (%) 1.3 1.7
¹ The calculation is based on the weighted fair value of issues made during the year.
² Expected volatility is calculated by assessing the historical share price data in the United Kingdom and South Africa from seven years prior to the grant date.
26. Retained earnings and other reserves
a. Retained earnings
Treasury and
EBT shares
US$m
Retained
earnings
US$m
Total
US$m
At 1 April 2014 (659) 16,544 15,885
Profit for the year – 3,299 3,299
Other comprehensive loss – (153) (153)
Remeasurements of defined benefit plans taken to other comprehensive loss – (7) (7)
Share of associates’ and joint ventures’ other comprehensive loss – (216) (216)
Deferred tax credit on items taken to other comprehensive loss – 70 70
Dividends paid – (1,705) (1,705)
Utilisation of merger relief reserve – 358 358
Share of associates’ and joint ventures’ other reserves moves – (6) (6)
Payment for purchase of own shares for share trusts (146) – (146)
Utilisation of treasury and EBT shares 125 (28) 97
Credit entry relating to share-based payments – 117 117
At 31 March 2015 (680) 18,426 17,746
Profit for the year – 2,699 2,699
Other comprehensive income – 48 48
Remeasurements of defined benefit plans taken to other comprehensive income – 5 5
Share of associates’ and joint ventures’ other comprehensive income – 72 72
Deferred tax charge on items taken to other comprehensive income – (29) (29)
Dividends paid – (1,860) (1,860)
Utilisation of merger relief reserve – 335 335
Share of associates’ and joint ventures’ other reserves moves – 2 2
Payment for purchase of own shares for share trusts (149) – (149)
Utilisation of treasury and EBT shares 28 (12) 16
Transfer between reserves – 78 78
Credit entry relating to share-based payments – 90 90
At 31 March 2016 (801) 19,806 19,005
157SABMiller plc Annual Report 2016
FINANCIALSTATEMENTS
FINANCIAL STATEMENTS
26. Retained earnings and other reserves continued
Treasury and EBT shares reserve
On 26 February 2009 77,368,338 SABMiller plc non-voting convertible shares were converted into ordinary shares and then acquired by the
company to be held as treasury shares. While the purchase price for each share was £10.54, the whole amount of the consideration was paid
between group companies. During 2016, 1,041,915 treasury shares (2015: 3,320,906 shares) were used to directly satisfy share awards and
1,426 treasury shares were transferred to the ESPP Trust (ESPPT). As at 31 March 2016 a total of 58,258,926 shares (2015: 59,302,267 shares)
were held in treasury.
There are three employee benefit trusts currently in operation, being the SABMiller Employees’ Benefit Trust (the EBT), the ESPPT and the SABMiller
Associated Companies’ Employees’ Benefit Trust (the AC-EBT). The EBT holds shares in SABMiller plc for the purposes of the various share
incentive plans, further details of which are disclosed in the directors’ remuneration report. At 31 March 2016 the EBT held 11,476,675 shares (2015:
8,997,945 shares) which cost US$357 million (2015: US$228 million) and had a market value of US$701 million (2015: US$471 million). These shares
have been treated as a deduction in arriving at shareholders’ funds. The EBT used funds provided by SABMiller plc to purchase such of the shares
as were purchased in the market. The costs of funding and administering the scheme are charged to the income statement in the period to which
they relate.
The AC-EBT holds shares in SABMiller plc for the purposes of providing share incentives for employees of companies in which SABMiller has a
significant economic and strategic interest but over which it does not have management control. At 31 March 2016 and 31 March 2015 the AC-EBT
did not hold any shares. The costs of funding and administering the scheme are charged to the income statement in the period to which they relate.
Shares currently held in each EBT rank pari passu with all other ordinary shares, but in both cases the trustees have elected to waive dividends and
decline from voting shares, except in circumstances where they may be holding shares beneficially owned by a participant. There were no beneficially
owned shares in either EBT as at 31 March 2016 (2015: nil).
The ESPPT holds shares in SABMiller plc for the benefit of participants in the UK Employee Share Purchase Plan which is a UK broad-based share
incentive plan that was established and operated for the first time during the year. At 31 March 2016 the ESPPT held 1,426 matching shares which
were transferred from treasury shares during the year. These shares have been treated as a deduction in arriving at shareholders’ funds. Shares
currently held in the ESPPT rank pari passu with all other ordinary shares. The costs of funding and administering the scheme are charged to the
income statement in the period to which they relate.
b. Other reserves
The analysis of other reserves is as follows.
Foreign
currency
translation
reserve
US$m
Cash flow
hedging
reserve
US$m
Net
investment
hedging
reserve
US$m
Available
for sale
reserve
US$m
Total
US$m
At 1 April 2014 (539) 11 (176) 2 (702)
Currency translation differences (5,308) – – – (5,308)
Net investment hedges – – 608 – 608
Cash flow hedges – 30 – – 30
Deferred tax on items taken to other comprehensive loss – (3) – – (3)
Share of associates’ and joint ventures’ other comprehensive loss (79) (3) – – (82)
At 31 March 2015 (5,926) 35 432 2 (5,457)
Currency translation differences (1,176) – – – (1,176)
Net investment hedges – – 88 – 88
Cash flow hedges – (64) – – (64)
Transfer between reserves (78) – – – (78)
Deferred tax on items taken to other comprehensive income – 18 – – 18
Share of associates’ and joint ventures’ other comprehensive loss (54) (35) – – (89)
At 31 March 2016 (7,234) (46) 520 2 (6,758)
Foreign currency translation reserve
The foreign currency translation reserve comprises all translation exchange differences arising on the retranslation of opening net assets together
with differences between income statements translated at average and closing rates.
Notes to the consolidated financial statements continued
158 SABMiller plc Annual Report 2016
27a. Reconciliation of profit for the year to net cash generated from operations
2016
US$m
2015
US$m
Profit for the year 2,922 3,557
Taxation 1,152 1,273
Share of post-tax results of associates and joint ventures (1,126) (1,083)
Net finance costs 506 637
Operating profit 3,454 4,384
Depreciation:
– Property, plant and equipment 538 602
– Containers 205 219
Container breakages, shrinkages and write-offs 41 57
Profit on disposal of businesses – (45)
Profit on disposal of available for sale investments – (1)
Profit on disposal of investments in associates – (403)
Gain on dilution of investment in associates – (2)
Profit on disposal of property, plant and equipment (34) (18)
Loss on disposal of intangibles 2 –
Amortisation of intangible assets 352 410
Impairment of goodwill – 286
Impairment of intangible assets – 6
Impairment of property, plant and equipment 7 73
Impairment of investment in associate 372 –
Impairment of working capital balances 44 68
Amortisation of advances to customers 34 35
Unrealised net fair value losses/(gains) on derivatives included in operating profit 20 (15)
Dividends received from other investments – (1)
Charge with respect to share options 83 112
Charge with respect to Broad-Based Black Economic Empowerment scheme 7 5
Other non-cash movements (70) (92)
Net cash generated from operations before working capital movements 5,055 5,680
Increase in inventories (112) (30)
Increase in trade and other receivables (204) (218)
Increase in trade and other payables 422 396
Decrease in provisions (41) (13)
Decrease in post-retirement benefit provisions (4) (3)
Net cash generated from operations 5,116 5,812
27b. Reconciliation of net cash generated from operating activities to free cash flow
2016
US$m
2015
US$m
Net cash generated from operating activities 3,415 3,722
Purchase of property, plant and equipment (1,210) (1,394)
Proceeds from sale of property, plant and equipment 74 68
Purchase of intangible assets (103) (178)
Investments in joint ventures (301) (216)
Investments in associates (4) (3)
Dividends received from joint ventures 998 976
Dividends received from associates 253 430
Dividends received from other investments – 1
Dividends paid to non-controlling interests (153) (173)
Free cash flow 2,969 3,233
159SABMiller plc Annual Report 2016
FINANCIALSTATEMENTS
FINANCIAL STATEMENTS
27c. Analysis of net debt
Cash and cash equivalents on the balance sheet are reconciled to cash and cash equivalents on the cash flow statement as follows.
2016
US$m
2015
US$m
Cash and cash equivalents (balance sheet) 1,430 965
Overdrafts (159) (215)
Cash and cash equivalents (cash flow statement) 1,271 750
Net debt is analysed as follows.
Cash and cash
equivalents
(excluding
overdrafts)
US$m
Overdrafts
US$m
Borrowings
US$m
Derivative
financial
instruments
US$m
Finance
leases
US$m
Gross
debt
US$m
Net
debt
US$m
At 1 April 2014 2,081 (213) (16,783) 663 (51) (16,384) (14,303)
Exchange adjustments (157) 40 713 (51) 6 708 551
Principal-related cash flows (959) (42) 3,819 (243) 10 3,544 2,585
Other movements – – (25) 745 (18) 702 702
At 31 March 2015 965 (215) (12,276) 1,114 (53) (11,430) (10,465)
Exchange adjustments (134) 19 27 4 4 54 (80)
Principal-related cash flows 598 37 783 (547) 10 283 881
Acquisitions – through business combinations 1 – (7) – (3) (10) (9)
Other movements – – (47) 101 (19) 35 35
At 31 March 2016 1,430 (159) (11,520) 672 (61) (11,068) (9,638)
27d. Major non-cash transactions
Major non-cash transactions included the following.
In 2016 impairments relating to the group’s investment in Castel’s operations in Angola and property, plant and equipment in South Sudan.
In 2016 the loan guarantee provision in Angola.
In 2016 the release of provisions following the successful resolution of certain claims in Australia.
In 2016 accelerated depreciation incurred in relation to the closure of MillerCoors’ Eden brewery.
In 2016 the group’s share of the gain realised on the change of control arising from Castel’s acquisition of further interests in its Tunisian operation.
In 2015 impairment charges relating to the group’s business in India in Asia Pacific and the group’s share of the impairment charges taken by Anadolu
Efes in relation to its beer businesses in Russia and Ukraine. Additionally, impairment charges in Australia including those in 2015 relating to the
pending closure of the Campbelltown cidery and Port Melbourne brewery.
Additional profit realised in 2015 on the disposal of the group’s Angolan operations to Castel in Africa in 2012.
In 2015 the recycling of foreign currency translation reserves following the repayment of an intercompany loan.
28. Acquisitions and disposals
Acquisitions
In June 2015, the group acquired 100% of Meantime Brewing Company Ltd, a modern UK craft brewer, with a brewery in Greenwich, London and
a number of retail sites for consideration of US$191 million net of cash acquired. The business combination has been accounted for using the
acquisition method.
Notes to the consolidated financial statements continued
160 SABMiller plc Annual Report 2016
29. Commitments, contingencies and guarantees
a. Operating lease commitments
The minimum lease rentals to be paid under non-cancellable leases at 31 March are as follows.
2016
US$m
2015
US$m
Land and buildings
Within one year 66 67
Later than one year and less than five years 78 134
After five years 18 24
162 225
Plant, vehicles and systems
Within one year 42 43
Later than one year and less than five years 59 79
After five years 3 11
104 133
b. Other commitments
2016
US$m
2015
US$m
Capital commitments not provided in the financial information
Contracts placed for future expenditure for property, plant and equipment 190 151
Contracts placed for future expenditure for intangible assets 1 1
Share of capital commitments of joint ventures 65 66
Other commitments not provided in the financial information
Contracts placed for future expenditure 1,294 1,799
Share of joint ventures’ other commitments 512 390
Contracts placed for future expenditure in 2016 primarily relate to minimum purchase commitments for raw materials and packaging materials, which
are principally due between 2016 and 2021.
The group’s share of joint ventures’ other commitments primarily relate to MillerCoors’ various long-term non-cancellable advertising and promotion
commitments.
c. Contingent liabilities and guarantees
2016
US$m
2015
US$m
Guarantees to third parties¹ 11 9
Other contingent liabilities 6 6
17 15
¹ Guarantees to third parties
Theseprimarily relate to guarantees given by Grolsch and Nile Breweries Ltd to banks in relation to loans taken out by third party trade customers and suppliers respectively, and by
SABMiller plc in relation to loans taken out by non-controlling interests in Ethiopia.
Other
SABMiller and Altria entered into a tax matters agreement (the Agreement) on 30 May 2002 to regulate the conduct of tax matters between them
with regard to the acquisition of Miller and to allocate responsibility for contingent tax costs. SABMiller has agreed to indemnify Altria against any
taxes, losses, liabilities and costs that Altria incurs arising out of or in connection with a breach by SABMiller of any representation, agreement or
covenant in the Agreement, subject to certain exceptions.
The group has a number of activities in a wide variety of geographic areas and is subject to certain legal claims incidental to its operations. In the
opinion of the directors, after taking appropriate legal advice, these claims are not expected to have, either individually or in aggregate, a material
adverse effect upon the group’s financial position, except insofar as already provided in the consolidated financial statements.
The group has exposures to various environmental risks. Although it is difficult to predict the group’s liability with respect to these risks, future
payments, if any, would be expected to be made over a period of time in amounts that would not be material to the group’s financial position, except
insofar as already provided in the consolidated financial statements.
As a result of the AB InBev offer, the group has various commitments which are contingent on the completion of the transaction, including advisers’
fees and staff-related costs, principally reflecting the impact of accelerated vesting of share-based compensation. These contingent liabilities, which
have not been recognised in the group’s results for the year ended 31 March 2016, are estimated to range from US$250 million to US$300 million.
161SABMiller plc Annual Report 2016
FINANCIALSTATEMENTS
FINANCIAL STATEMENTS
30. Pensions and post-retirement benefits
The group operates a number of pension schemes throughout the world. These schemes have been designed and are administered in accordance
with local conditions and practices in the countries concerned and include both defined contribution and defined benefit schemes. The majority
of the schemes are funded and the schemes’ assets are held independently of the group’s finances. The assets of the schemes do not include any
of the group’s own financial instruments, nor any property occupied by or other assets used by the group. Pension and post-retirement benefit costs
are assessed in accordance with the advice of independent professionally qualified actuaries. Generally, the projected unit method is applied to
measure the defined benefit scheme liabilities.
The group also provides medical benefits, which are mainly unfunded, for retired employees and their dependants in South Africa, the Netherlands
and Latin America.
The total pension and post-retirement medical benefit costs recognised in the income statement are as follows.
2016
US$m
2015
US$m
Defined contribution scheme costs 89 98
Defined benefit pension plan costs 18 19
Post-retirement medical and other benefit costs 5 8
The amounts recognised in the balance sheet are determined as follows.
2016
US$m
2015
US$m
Portion of defined benefit obligation that is partly or wholly funded (405) (405)
Fair value of plan assets 473 457
Surplus of funded plans 68 52
Impact of asset ceiling (73) (57)
Deficit of funded plans (5) (5)
Portion of defined benefit obligation that is unfunded (109) (124)
Medical and other post-retirement benefits (65) (76)
Provisions for defined benefit plans (179) (205)
Accruals for defined contribution plans (4) (4)
The group operates various defined contribution and defined benefit schemes. Details of the main defined benefit schemes are provided below.
Latin America pension plans
The group operates a number of pension plans throughout Latin America. Details of the major plan are provided below.
The Colombian Labour Code Pension Plan is an unfunded plan of the defined benefit type and covers all salaried and hourly employees in Colombia
who are not covered by social security or who have at least 10 years of service prior to 1 January 1967. The plan is financed entirely through
company reserves and there are no external assets. The most recent actuarial valuation of the Colombian Labour Code Pension Plan was carried out
by independent professionally qualified actuaries at 28 February 2016 using the projected unit credit method. All salaried employees are now covered
by social security or private pension fund provisions. The principal economic assumptions used in the preparation of the pension valuations are
shown below and take into consideration changes in the Colombian economy.
Grolsch pension scheme
The Grolsch pension scheme, named Stichting Pensioenfonds van de Grolsche Bierbrouwerij, is a funded plan of the defined benefit type, based on
average salary with assets held in separately administered funds. The pension scheme is managed through a separate entity with its own board. The
latest valuation of the Grolsch pension scheme was carried out at 31 March 2016 by an independent actuary using the projected unit credit method.
Carlton & United Breweries pension scheme
The Carlton & United Breweries pension scheme is a superannuation fund that provides accumulation style and defined benefits to employees. The
company funds the defined benefits, administration and insurance costs of the scheme as a benefit to employees who elect to be members of this
scheme. The board of trustees is responsible for the governance of the scheme on behalf of the members. The latest actuarial valuation of the
Carlton & United Breweries pension scheme was carried out at 30 June 2014 by an independent actuary using the projected unit credit method.
The valuation update for the scheme was carried out at 31 March 2016 by an independent actuary. The defined benefits section is now closed
to new members.
Notes to the consolidated financial statements continued
162 SABMiller plc Annual Report 2016
30. Pensions and post-retirement benefits continued
South Africa pension schemes
The group operates a number of pension schemes throughout South Africa. Details of the major schemes are provided below.
The ABI Pension Fund, Suncrush Pension Fund and Suncrush Retirement Fund are funded schemes of the defined benefit type based on average
salary with assets held in separately administered funds. The governance of the schemes is the responsibility of the boards of trustees on behalf of
the members, subject to the provisions of local legislation and the rules for each scheme.
The ABI Pension Fund no longer has any active or pensioner members. There are surplus assets remaining in the scheme that will be distributed
to former members.
The Suncrush Pension Fund has pensioners where the pension liabilities have been outsourced to an insurance provider. The trustees have made
a provision in the fund rules for the active members such that benefits will be paid to members on exit for their benefits valued as at 1 July 2005.
No further benefits are being accrued for active members.
The Suncrush Retirement Fund has no liabilities and is in the process of being closed down.
Risks
The most significant risks the group is exposed to through its defined benefit pension plans and post-employment medical plans are as follows.
Volatility of investment returns
Those schemes that hold assets are exposed to volatility in investment returns on those assets, which may be higher or lower than the assumed
expected return on those assets. Asset mix is varied for each individual scheme to ensure investment volatility risk is appropriately managed.
Salary, pension and healthcare cost inflation risk
Scheme liabilities for the defined benefit pension and post-retirement medical plans are calculated based on assumed rates of salary, pension and/or
healthcare cost inflation. Increases in these inflation rates will lead to higher liabilities.
Change in discount rate
A decrease in corporate bond yields will result in a decrease in the discount rate and therefore an increase in scheme liabilities. This will be partially
offset by an increase in the value of plan assets where the scheme holds bonds.
Mortality rates
The majority of the group’s obligations to provide benefits under both the defined benefit pension plans and medical and other post-retirement benefits
are for the life of the member. Increases in life expectancy will result in increases in the scheme liabilities associated with the schemes. The group
ensures mortality rate assumptions incorporated in the actuarial calculations of the present value of scheme liabilities are from reliable sources.
Principal actuarial assumptions at 31 March (expressed as weighted averages)
Defined benefit pension plans
Medical and other
post-retirement benefits
Latin America Grolsch Other South Africa Other
At 31 March 2016
Discount rate (%) 8.5 2.1 2.8 10.2 7.1
Salary inflation (%) 4.3 1.0 2.5 – –
Pension inflation (%) 4.3 0.7 2.7 – –
Healthcare cost inflation (%) – – – 9.1 4.0
Mortality rate assumptions
– Retirement age: Males 56 67 65 63 59
Females 52 67 65 63 55
– Life expectations on retirement age:
Retiring today: Males 30 22 15 16 27
Females 38 24 19 20 34
Retiring in 20 years: Males 30 24 15 16 27
Females 38 26 19 20 34
At 31 March 2015
Discount rate (%) 6.9 1.9 2.4 8.0 6.0
Salary inflation (%) 3.0 1.0 2.6 – –
Pension inflation (%) 3.0 0.7 3.2 – –
Healthcare cost inflation (%) – – – 7.1 2.9
Mortality rate assumptions
– Retirement age: Males 56 67 65 63 58
Females 51 67 65 63 55
– Life expectations on retirement age:
Retiring today: Males 23 21 15 16 22
Females 32 24 20 20 29
Retiring in 20 years: Males 23 24 16 16 22
Females 32 26 20 20 29
163SABMiller plc Annual Report 2016
FINANCIALSTATEMENTS
FINANCIAL STATEMENTS
30. Pensions and post-retirement benefits continued
The movements in the defined benefit pension plan liabilities are as follows.
Defined benefit pension plans
Latin
America Grolsch Other Total
Present
value of
scheme
liabilities
US$m
Present
value of
scheme
liabilities
US$m
Fair value
of plan
assets
US$m
Total
US$m
Present
value of
scheme
liabilities
US$m
Fair value
of plan
assets
US$m
Total
US$m
Present
value of
scheme
liabilities
US$m
Fair value
of plan
assets
US$m
Total
US$m
At 1 April 2014 (141) (338) 408 70 (81) 71 (10) (560) 479 (81)
Benefits paid 13 11 (11) – 16 (14) 2 40 (25) 15
Contributions paid by plan participants – (2) – (2) (1) – (1) (3) – (3)
Employer contributions – – 7 7 – 1 1 – 8 8
Current service cost (1) (4) – (4) (3) – (3) (8) – (8)
Past service cost (1) – – – – – – (1) – (1)
Interest (costs)/income (9) (10) 12 2 (3) 3 – (22) 15 (7)
Remeasurements: (6) (105) 95 (10) (2) 2 – (113) 97 (16)
– Return on plan assets, excluding amounts
included in interest income – – 95 95 – – – – 95 95
– Gain/(loss) from change in demographic
assumptions 6 (2) – (2) – – – 4 – 4
– Loss from change in financial assumptions – (107) – (107) (2) – (2) (109) – (109)
– Experience (losses)/gains (12) 4 – 4 – 2 2 (8) 2 (6)
Exchange adjustments 32 92 (106) (14) 14 (11) 3 138 (117) 21
At 31 March 2015 (113) (356) 405 49 (60) 52 (8) (529) 457 (72)
Benefits paid 9 10 (10) – 5 (4) 1 24 (14) 10
Contributions paid by plan participants – (2) – (2) – – – (2) – (2)
Employer contributions – – 6 6 – – – – 6 6
Current service cost (1) (5) – (5) (3) – (3) (9) – (9)
Past service cost (1) – – – – – – (1) – (1)
Interest (costs)/income (7) (7) 7 – (1) 1 – (15) 8 (7)
Remeasurements: – 22 (6) 16 – – – 22 (6) 16
– Return on plan assets, excluding amounts
included in interest income – – (6) (6) – – – – (6) (6)
– Gain from change in financial assumptions 3 22 – 22 – – – 25 – 25
– Experience losses (3) – – – – – – (3) – (3)
Exchange adjustments 15 (21) 24 3 2 (2) – (4) 22 18
At 31 March 2016 (98) (359) 426 67 (57) 47 (10) (514) 473 (41)
Notes to the consolidated financial statements continued
164 SABMiller plc Annual Report 2016
30. Pensions and post-retirement benefits continued
The fair values of assets in pension schemes are as follows.
Defined benefit pension plans
Latin America
US$m
Grolsch
US$m
Other
US$m
Total
US$m
At 31 March 2016
Equities – quoted – 139 11 150
Bonds – quoted – 269 12 281
Cash and cash equivalents – – 18 18
Property and other – 18 6 24
Total fair value of assets – 426 47 473
Present value of scheme liabilities (98) (359) (57) (514)
(Deficit)/surplus in the scheme (98) 67 (10) (41)
Unrecognised pension asset due to limit – (67) (6) (73)
Pension liability recognised (98) – (16) (114)
At 31 March 2015
Equities – quoted – 138 12 150
Bonds – quoted – 248 16 264
Cash and cash equivalents – 2 22 24
Property and other – 17 2 19
Total fair value of assets – 405 52 457
Present value of scheme liabilities (113) (356) (60) (529)
(Deficit)/surplus in the scheme (113) 49 (8) (72)
Unrecognised pension asset due to limit – (49) (8) (57)
Pension liability recognised (113) – (16) (129)
In respect of defined benefit pension plans in South Africa, which are included in ‘Other’, the pension asset recognised is limited to the extent that
the employer is able to recover a surplus either through reduced contributions in the future or through refunds from the scheme. Pension fund assets
have not been recognised as the surplus apportionment exercise required in terms of the South African legislation has not yet been completed.
The pension asset recognised in respect of Grolsch is limited to the extent that the employer is able to recover a surplus either through reduced
contributions in the future or through refunds from the scheme. The limit has been set equal to nil due to the terms of the pension agreement with
the pension fund.
165SABMiller plc Annual Report 2016
FINANCIALSTATEMENTS
FINANCIAL STATEMENTS
30. Pensions and post-retirement benefits continued
The movements in the asset ceiling are as follows.
Defined benefit pension plans
Grolsch
US$m
Other
US$m
Total
US$m
Asset ceiling at 1 April 2014 (70) (8) (78)
Interest costs (2) (1) (3)
Change in the asset ceiling, excluding amounts included in interest costs 9 (1) 8
Exchange adjustments 14 2 16
Asset ceiling at 31 March 2015 (49) (8) (57)
Interest costs (1) – (1)
Change in the asset ceiling, excluding amounts included in interest costs (12) – (12)
Exchange adjustments (5) 2 (3)
Asset ceiling at 31 March 2016 (67) (6) (73)
The movements in the post-employment medical benefit liabilities are as follows. The obligations are wholly unfunded.
Medical and other post-retirement benefits
South Africa
US$m
Other
US$m
Total
US$m
Present value of scheme liabilities at 1 April 2014 (46) (41) (87)
Benefits paid – 2 2
Employer contributions 2 – 2
Current service cost (1) (2) (3)
Interest costs (4) (1) (5)
Remeasurements: 1 – 1
– Loss from change in demographic assumptions – (1) (1)
– Loss from change in financial assumptions (1) – (1)
– Experience gains 2 1 3
Exchange adjustments 6 8 14
Present value of scheme liabilities at 31 March 2015 (42) (34) (76)
Benefits paid – 2 2
Employer contributions 2 – 2
Current service cost (1) – (1)
Interest costs (3) (1) (4)
Remeasurements: 4 (3) 1
– Gain from change in financial assumptions 1 1 2
– Experience gains/(losses) 3 (4) (1)
Exchange adjustments 7 4 11
Present value of scheme liabilities at 31 March 2016 (33) (32) (65)
Notes to the consolidated financial statements continued
166 SABMiller plc Annual Report 2016
30. Pensions and post-retirement benefits continued
The sensitivity of the pension plan and medical and other post-retirement benefit liabilities at 31 March 2016 to changes in the principal actuarial
assumptions is as follows.
Defined benefit pension plans
Medical and other
post-retirement benefits
Change in
assumption
Increase
US$m
Decrease
US$m
Increase
US$m
Decrease
US$m
Discount rate 1% 69 90 5 6
Salary growth rate 1% 7 6 – –
Pension growth rate 1% 83 47 – –
Life expectancy 1 year 11 11 2 2
Healthcare cost inflation 1% – – 6 5
The above sensitivity analyses assume a change in a single assumption while all other assumptions are held constant. When calculating the
sensitivities, the present value of the defined benefit obligation has been calculated using the projected unit credit method at the end of the reporting
period, consistent with the method used to calculate the defined benefit obligation recognised in the balance sheet. The methods and assumptions
used to prepare the sensitivity analyses are consistent with those used in the prior year.
For funded defined benefit plans, the group is required to provide funding where the fair value of the assets of the scheme are not sufficient to meet
the defined benefit obligations. The South Africa pension schemes no longer have any active members, therefore, funding will only be required in the
event that the scheme becomes less than 100% funded. The remaining funded defined benefit plans are funded using recommendations provided
by the scheme’s actuaries.
Contributions expected to be paid into the group’s major defined benefit schemes during the year ending 31 March 2017 are US$18 million.
The weighted average duration of the defined benefit obligation is 16 years.
31. Related party transactions
a. Parties with significant influence over the group: Altria Group, Inc (Altria) and the Santo Domingo Group (SDG)
Altria is considered to be a related party of the group by virtue of its 26.7% equity shareholding. There were no transactions with Altria during the year.
SDG is considered to be a related party of the group by virtue of its 14.0% equity shareholding in SABMiller plc. During the year the group made
purchases of logistics services and natural gas from SDG companies totalling US$5 million (2015: US$nil). At 31 March 2016 US$1 million (2015: US$nil)
was owing to SDG companies.
b. Associates and joint ventures
Details relating to transactions with associates and joint ventures are analysed below.
2016
US$m
2015
US$m
Purchases from associates1
(165) (173)
Purchases from joint ventures2
(103) (88)
Sales to associates3
38 9
Sales to joint ventures4
19 21
Dividends received from associates5
253 423
Dividends received from joint ventures6
998 976
Royalties received from associates7
16 18
Royalties received from joint ventures8
14 1
Management fees, guarantee fees and other recoveries received from associates9
14 14
Marketing fees paid to associates10
(1) (1)
Management fees paid to joint ventures11
(2) (2)
Management fees received from joint ventures12
1 –
1
The group purchased canned Coca-Cola products for resale from Coca-Cola Canners of Southern Africa (Pty) Ltd (Coca-Cola Canners); inventory from Distell Group Ltd (Distell), Associated
Fruit Processors (Pty) Ltd (AFP) and Delta Corporation Ltd (Delta); and in 2015 accommodation from Tsogo Sun Holdings Ltd (Tsogo Sun).
2
The group purchased lager from MillerCoors LLC (MillerCoors).
3
The group made sales of lager to Delta, Anadolu Efes Biracılık ve Malt Sanayii AS¸ (Anadolu Efes), International Trade and Supply Ltd (ITSL) and Distell, and in 2015 to Tsogo Sun.
4
The group made sales to MillerCoors.
5
The group had dividends receivable from China Resources Snow Breweries Ltd (CR Snow) of US$71 million (2015: US$228 million), Castel of US$89 million (2015: US$108 million), Coca-Cola
Canners of US$10 million (2015: US$5 million), Distell of US$15 million (2015: US$18 million), Tsogo Sun of US$nil (2015: US$24 million), Delta of US$19 million (2015: US$18 million), ITSL of
US$24 million (2015: US$21 million), Grolsch (UK) Ltd of US$1 million (2015: US$1 million) and Anadolu Efes of US$24 million (2015: US$nil).
6
The group received dividends from MillerCoors.
7
The group received royalties from Delta and Anadolu Efes.
8
The group received royalties from MillerCoors.
9
The group received management fees from Delta, Anadolu Efes and Castel and other recoveries from AFP.
10
The group paid marketing fees to ITSL.
11
The group paid management fees to MillerCoors.
12
The group received management fees from MillerCoors.
167SABMiller plc Annual Report 2016
FINANCIALSTATEMENTS
FINANCIAL STATEMENTS
31. Related party transactions continued
At 31 March
2016
US$m
2015
US$m
Amounts owed by associates1
15 28
Amounts owed by joint ventures2
8 4
Amounts owed to associates3
(36) (38)
Amounts owed to joint ventures4
(14) (18)
1
Amounts owed by AFP, Delta, Coca-Cola Canners, Castel and Anadolu Efes.
2
Amounts owed by MillerCoors.
3
Amounts owed to AFP and Castel.
4
Amounts owed to MillerCoors.
Guarantees provided in respect of associates’ bank facilities are detailed in note 21.
c. Transactions with key management
The group has a related party relationship with the directors of the group and members of the excom as key management. Key management
compensation is provided in note 6c.
32. Post balance sheet events
In May 2016 the South African Competition Tribunal approved, with agreed conditions, the formation of Coca-Cola Beverages Africa, Africa’s largest
soft drinks operation. The transaction is expected to complete in early July 2016.
Notes to the consolidated financial statements continued
168 SABMiller plc Annual Report 2016
33. Principal subsidiaries, associates and joint ventures
The principal subsidiary undertakings of the group as at 31 March were as follows.
Effective interest
Name Country of incorporation Principal activity 2016 2015
Corporate
SABMiller Holdings Ltd United Kingdom Holding company 100% 100%
SABMiller International Brands Ltd United Kingdom Trademark owner 100% 100%
SABMiller Procurement GmbH Switzerland Procurement 100% 100%
SABSA Holdings Ltd South Africa Holding company 100% 100%
Latin American operations
Bavaria SA Colombia Brewing/Soft drinks 99% 99%
Cervecería Hondureña, SA de CV Honduras Brewing/Soft drinks 99% 99%
Cervecería Nacional (CN) SA1
Ecuador Brewing 96% 96%
Cervecería Nacional SA1
Panama Brewing 97% 97%
Industrias La Constancia, SA de CV El Salvador Brewing/Soft drinks 100% 100%
Unión de Cervecerías Peruanas Backus y Johnston SAA1
Peru Brewing 94% 94%
African operations
SABMiller Africa BV Netherlands Holding company 62% 62%
SABMiller Botswana BV Netherlands Holding company 62% 62%
Accra Brewery Ltd Ghana Brewing 60% 60%
Cervejas de Moçambique SA1
Mozambique Brewing 49% 49%
Intafact Beverages Ltd Nigeria Brewing 38% 38%
International Breweries plc1
Nigeria Brewing 36% 36%
Kgalagadi Breweries (Pty) Ltd Botswana Brewing/Soft drinks 31% 31%
Nile Breweries Ltd Uganda Brewing 62% 62%
Tanzania Breweries Ltd1
Tanzania Brewing 36% 36%
The South African Breweries (Pty) Ltd South Africa Brewing/Holding company 100% 100%
Zambian Breweries plc1
Zambia Brewing/Soft drinks 54% 54%
Asia Pacific operations
Foster’s Group Pty Ltd Australia Holding company 100% 100%
CUB Pty Ltd Australia Brewing 100% 100%
FBG Finance Pty Ltd Australia Financing 100% 100%
FBG Treasury (Aust) Pty Ltd Australia Financing 100% 100%
SABMiller Breweries Private Ltd India Brewing 100% 100%
European operations
Birra Peroni Srl Italy Brewing 100% 100%
Grolsche Bierbrouwerij Nederland BV Netherlands Brewing 100% 100%
Kompania Piwowarska SA Poland Brewing 100% 100%
Miller Brands (UK) Ltd United Kingdom Sales and distribution 100% 100%
Pivovary Topvar as Slovakia Brewing 100% 100%
Plze ˇnský Prazdroj as Czech Republic Brewing 100% 100%
Ursus Breweries SA Romania Brewing 99% 99%
North American operations
SABMiller Holdings Inc USA Holding company/Financing 100% 100%
1
Listed in country of incorporation.
The group comprises a large number of companies. The list above includes those subsidiary undertakings which materially affect the profit or net
assets of the group, or a business segment. The principal country in which each of the above subsidiary undertakings operates is the same as the
country in which each is incorporated. A complete list of all subsidiary undertakings is set out in the related undertakings section in this annual report.
Where the group’s nominal interest in the equity share capital of an undertaking is less than 50%, the basis on which the undertaking is a subsidiary
undertaking of the group is as follows.
African operations
The group’s effective interest in the majority of its African operations was diluted as a result of the disposal of a 38% interest in SABMiller Africa BV
and SABMiller Botswana BV on 1 April 2001, in exchange for a 20% interest in the Castel group’s African beverage interests. The operations continue
to be consolidated due to the group’s majority shareholdings, and ability to control the operations.
Kgalagadi Breweries (Pty) Ltd (KBL)
SABMiller Botswana holds a 40% interest in Kgalagadi Breweries (Pty) Ltd with the remaining 60% interest held by Sechaba Brewery Holdings Ltd.
SABMiller Botswana’s shares entitle the holder to twice the voting rights of those shares held by Sechaba Brewery Holdings Ltd. SABMiller Africa
BV’s 10.1% indirect interest is held via a 16.8% interest in Sechaba Brewery Holdings Ltd.
169SABMiller plc Annual Report 2016
FINANCIALSTATEMENTS
FINANCIAL STATEMENTS
33. Principal subsidiaries, associates and joint ventures continued
Associates and joint ventures
The principal associates and joint ventures of the group as at 31 March are as set out below. Where the group’s interest in an associate or a joint
venture is held by a subsidiary undertaking which is not wholly owned by the group, the subsidiary undertaking is indicated in a note below.
Effective interest
Name Country of incorporation Nature of relationship Principal activity 2016 2015
African operations
BIH Brasseries Internationales Holding Ltd1
Gibraltar Associate Holding company for subsidiaries
principally located in Africa
20% 20%
Société des Brasseries et Glacières
Internationales SA1
France Associate Holding company for subsidiaries
principally located in Africa
20% 20%
BIH Brasseries Internationales Holding
(Angola) Ltd1
Gibraltar Associate Holding company for subsidiaries
principally located in Africa
27% 27%
Delta Corporation Ltd2,3
Zimbabwe Associate Brewing/Soft drinks 25% 25%
Distell Group Ltd2,4
South Africa Associate Wines and spirits 27% 27%
Asia Pacific operations
China Resources Snow Breweries Ltd1
British Virgin Islands Associate Holding company for brewing
subsidiaries located in China
49% 49%
European operations
Anadolu Efes Biracılık ve Malt Sanayii AS¸ 1,2
Turkey Associate Brewing/Soft drinks 24% 24%
North American operations
MillerCoors LLC1,5
USA Joint venture Brewing 58% 58%
1
These entities report their financial results for each 12-month period ending 31 December.
2
Listed in country of incorporation.
3
Interests in this company are held by SABMiller Africa BV which is held 62% by SABMiller Holdings Ltd.
4
This entity reports its financial results for each 12-month period ending 30 June.
5
SABMiller shares joint control of MillerCoors with Molson Coors Brewing Company under a shareholders’ agreement. Voting interests are shared equally between SABMiller and Molson Coors,
and each of SABMiller and Molson Coors has equal board representation. Under the agreement SABMiller has a 58% economic interest in MillerCoors and Molson Coors has a 42%
economic interest.
The principal country in which each of the above associated undertakings operates is the same as the country in which each is incorporated.
However, Société des Brasseries et Glacières Internationales SA, BIH Brasseries Internationales Holding Ltd’s (Castel) and BIH Brasseries
Internationales Holding (Angola) Ltd’s principal subsidiaries are in Africa, China Resources Snow Breweries Ltd operates in Hong Kong and
its principal subsidiaries are in the People’s Republic of China.
A complete list of all associate and joint venture undertakings is set out in the related undertakings section in this annual report.
Notes to the consolidated financial statements continued
170 SABMiller plc Annual Report 2016
Balance sheet of SABMiller plc
at 31 March
Notes
2016
US$m
2015
US$m
Assets
Fixed assets
Intangible assets 3 133 133
Property, plant and equipment 4 48 44
Investments in subsidiaries 5 14,128 14,069
14,309 14,246
Current assets
Loans and other financial assets due after more than one year 6 2,091 5,762
Trade and other receivables due after more than one year 7 15 20
Derivative financial instruments due after more than one year 8 248 388
Loans and other financial assets due within one year 6 4,639 1,142
Trade and other receivables due within one year 7 39 59
Derivative financial instruments due within one year 8 125 20
Cash and cash equivalents 9 878 449
8,035 7,840
Total assets 22,344 22,086
Liabilities
Creditors due within one year
Derivative financial instruments 8 (19) (32)
Borrowings 10 (1,126) (460)
Trade and other payables 11 (188) (125)
Other financial liabilities 13 (65) (50)
(1,398) (667)
Net current assets 6,637 7,173
Total assets less current liabilities 20,946 21,419
Creditors due after more than one year
Derivative financial instruments 8 (6) (5)
Borrowings 10 (1,215) (1,223)
Trade and other payables 11 (10) (10)
Other financial liabilities 13 (188) (231)
(1,419) (1,469)
Net assets 19,527 19,950
Equity
Share capital 168 168
Share premium 6,848 6,752
Merger relief reserve 14 3,628 3,963
Other reserves (1,281) (1,186)
Retained earnings 10,164 10,253
Total equity 19,527 19,950
The notes on pages 173 to 185 are an integral part of these financial statements.
The financial statements on pages 171 to 185 were approved by the board of directors on 10 June 2016 and were signed on its behalf by
Alan Clark Domenic De Lorenzo
Chief Executive Chief Financial Officer
Advantage has been taken of the provisions of section 408(3) of the Companies Act 2006 which permit the omission of a separate income statement
for SABMiller plc. The profit for the company for the year was US$1,367 million (2015: US$2,141 million).
171SABMiller plc Annual Report 2016
FINANCIALSTATEMENTS
FINANCIAL STATEMENTS
Statement of changes in the company’s equity
for the year ended 31 March
Share
capital
US$m
Share
premium
US$m
Merger
relief
reserve
US$m
Cashflow
hedging
reserve
US$m
EBT
reserve
US$m
Treasury
shares
US$m
Retained
earnings
US$m
Total
equity
US$m
At 1 April 2014 167 6,648 4,321 12 (168) (1,008) 9,400 19,372
Total comprehensive (loss)/income – – – (38) – – 2,141 2,103
Profit for the year – – – – – – 2,141 2,141
Other comprehensive loss – cash flow hedges fair value losses – – – (38) – – – (38)
Dividends paid – – – – – – (1,696) (1,696)
Issue of ordinary shares 1 61 – – – – – 62
Transfer into EBT – – – – (53) 53 – –
Purchase of EBT shares – – – – (146) – – (146)
Utilisation of EBT shares – – – – 112 – (112) –
Utilisation of treasury shares – 43 – – – 50 – 93
Utilisation of merger relief reserve – – (358) – – – 358 –
Credit entry relating to share-based payments – – – – – – 113 113
Capital contribution relating to share-based payments – – – – – – 49 49
At 31 March 2015 168 6,752 3,963 (26) (255) (905) 10,253 19,950
Total comprehensive income – – – 16 – – 1,367 1,383
Profit for the year – – – – – – 1,367 1,367
Other comprehensive income – cash flow hedges fair value gain – – – 16 – – – 16
Dividends paid – – – – – – (1,852) (1,852)
Issue of ordinary shares – 84 – – – – – 84
Purchase of EBT shares – – – – (149) – – (149)
Utilisation of EBT shares – – – – 22 – (22) –
Utilisation of treasury shares – 12 – – – 16 – 28
Utilisation of merger relief reserve – – (335) – – – 335 –
Credit entry relating to share-based payments – – – – – – 24 24
Capital contribution relating to share-based payments – – – – – – 59 59
At 31 March 2016 168 6,848 3,628 (10) (382) (889) 10,164 19,527
172 SABMiller plc Annual Report 2016
Notes to the company financial statements
a) Basis of preparation
SABMiller plc (the company) is a public limited company incorporated
in Great Britain and registered in England and Wales. The address of
its registered office is SABMiller House, Church Street West, Woking,
Surrey, England, GU21 6HS.
These financial statements have been prepared in accordance with
Financial Reporting Standard 101 Reduced Disclosure Framework
(FRS 101).
In preparing these financial statements, the company applies the
recognition, measurement and disclosure requirements of International
Financial Reporting Standards as adopted by the EU (Adopted IFRSs),
but makes amendments where necessary in order to comply with the
Companies Act 2006 and has set out below where advantage of the
FRS 101 disclosure exemptions has been taken.
In these financial statements, the company has adopted FRS 101 for the
first time. In the transition to FRS 101, the company has applied IFRS 1
‘First-time adoption of International Financial Reporting Standards’ while
ensuring that its assets and liabilities are measured in compliance with
FRS 101.
An explanation of how the transition to FRS 101 has affected the
reported financial position, financial performance and cash flows of the
company is provided in note 18.
IFRS 1 grants certain exemptions from the full requirements of Adopted
IFRSs in the transition period. These are not considered to have a material
impact on the company’s financial statements.
In these financial statements, the company has applied the exemptions
available under FRS 101 in respect of the following disclosures:
− Paragraph 38 of IAS 1, ‘Presentation of financial statements’
comparative information requirements in respect of:
− Paragraph 79(a)(iv) of IAS 1;
− Paragraph 73(e) of IAS 16, ‘Property, plant and equipment’; and
− Paragraph 118(e) of IAS 38, ‘Intangible assets’.
− The following paragraphs of IAS 1, ‘Presentation of financial
statements’:
− 10(d) (statement of cash flows);
− 10(f) (a balance sheet as at the beginning of the preceding period
when an entity applies an accounting policy retrospectively or
makes a retrospective restatement of items in its financial
statements, or when it reclassifies items in its financial statements);
− 16 (statement of compliance with all IFRS);
− 38A (requirement for minimum of two primary statements,
including cash flow statements);
− 38B-D (additional comparative information);
− 40A-D (requirements for a third balance sheet);
− 111 (cash flow statement information); and
− 134-136 (capital management disclosures).
− IAS 7, ‘Statement of cash flows’.
− Paragraphs 30 and 31 of IAS 8 ‘Accounting policies, changes in
accounting estimates and errors’ (requirement for the disclosure of
information when an entity has not applied a new IFRS that has been
issued but is not yet effective).
− The requirements in IAS 24, ‘Related party disclosures’ to disclose
related party transactions entered into with wholly-owned members
of the group.
As the consolidated financial statements include the equivalent
disclosures, the company has also taken the exemptions under FRS 101
available in respect of the following disclosures:
− Paragraphs 45(b) and 46 to 52 of IFRS 2, ‘Share-based payment’;
− Certain disclosures required by IFRS 13 ‘Fair value measurement’
and the disclosures required by IFRS 7 ‘Financial instrument
disclosures’; and
− Paragraph 17 of IAS 24, ‘Related party disclosures’ (key management
compensation).
The accounting policies set out below have, unless otherwise stated,
been applied consistently to all years presented in these financial
statements and in preparing an opening FRS 101 balance sheet at
1 April 2014 for the purposes of the transition to FRS 101.
Judgements made by the directors in the application of those accounting
policies that have a significant effect on the financial statements and
estimates with a significant risk of material adjustment in the next year
are detailed in note 2.
The financial statements are prepared on the going concern basis,
under the historical cost convention, as modified by certain financial
assets and financial liabilities (including derivative instruments) at fair
value through profit and loss. The principal accounting policies, which
have been applied consistently throughout the year, are set out below.
b) Foreign exchange
The financial statements are presented in US dollars which is the
company’s functional and presentational currency.
The South African rand (ZAR) and British pound (GBP) exchange rates to
the US dollar used in preparing the company’s financial statements were
as follows.
Weighted average rate Closing rate
ZAR GBP ZAR GBP
Year ended 31 March 2016 13.78 0.66 14.77 0.70
Year ended 31 March 2015 11.08 0.62 12.13 0.67
The financial statements have been prepared on the basis that
transactions in foreign currencies are recorded in their functional
currency at the rate of exchange ruling at the date of the transaction.
Monetary items denominated in foreign currencies are retranslated at
the rate of exchange ruling at the balance sheet date with the resultant
translation differences being included in operating profit in the income
statement, other than those arising on financial assets and liabilities
which are recorded within net finance costs and those which are
deferred in equity as qualifying cash flow hedges.
Translation differences on non-monetary assets and liabilities that are
measured in terms of historical cost in a foreign currency are translated
using the exchange rate at the date of the transaction. Translation
differences on non-monetary assets and liabilities denominated in foreign
currencies that are stated at fair value are retranslated to the functional
currency at foreign exchange rates ruling at the dates the fair value
was determined.
c) Investments in subsidiaries
Investments in subsidiaries are stated at cost, together with subsequent
capital contributions, less provisions for impairment.
The issue by the company to employees of its subsidiaries of a grant
over the company’s shares represents an additional capital contribution
by the company to its subsidiaries, except to the extent the company
is reimbursed. An additional investment in subsidiaries results in a
corresponding increase in shareholders’ equity. The additional capital
contribution is based on the fair value of the grant issued allocated over
the underlying grant’s vesting period.
d) Financial instruments
Financial assets and financial liabilities are initially recorded at fair value
(plus any directly attributable transaction costs except in the case of
those classified at fair value through profit or loss). For those financial
instruments that are not subsequently held at fair value, the company
assesses whether there is any objective evidence of impairment at each
balance sheet date.
1. Accounting policies
173SABMiller plc Annual Report 2016
FINANCIALSTATEMENTS
FINANCIAL STATEMENTS
Financial assets are recognised when the company has rights or other
access to economic benefits. Such assets consist of cash, equity
instruments, a contractual right to receive cash or another financial asset,
or a contractual right to exchange financial instruments with another
entity on potentially favourable terms. Financial assets are derecognised
when the rights to receive cash flows from the asset have expired or
have been transferred and the company has transferred substantially
all risks and rewards of ownership.
Financial liabilities are recognised when there is an obligation to transfer
benefits and that obligation is a contractual liability to deliver cash or
another financial asset or to exchange financial instruments with
another entity on potentially unfavourable terms. Financial liabilities are
derecognised when they are extinguished, that is discharged, cancelled
or expired. If a legally enforceable right exists to set off recognised
amounts of financial assets and liabilities, which are in determinable
monetary amounts, and there is the intention to settle net, the relevant
financial assets and liabilities are offset.
Interest costs are charged to the income statement in the year in
which they accrue. Premiums or discounts arising from the difference
between the net proceeds of financial instruments purchased or issued
and the amounts receivable or repayable at maturity are included in the
effective interest calculation and taken to net finance costs over the life
of the instrument.
The company holds four categories of financial assets and liabilities.
These are described as follows.
(i) Financial assets and financial liabilities at fair value through
profit or loss
Financial assets and financial liabilities at fair value through profit or loss
include derivative assets and derivative liabilities not designated as
effective hedging instruments. All gains or losses arising from changes
in the fair value of financial assets or financial liabilities within this
category are recognised in the income statement.
Derivative financial assets and financial liabilities
Derivative financial assets and financial liabilities are financial instruments
the value of which changes in response to an underlying variable, require
little or no initial investment and are settled in the future.
Derivative financial assets and liabilities are analysed between current
and non-current assets and liabilities on the face of the balance sheet,
depending on when they are expected to mature.
For derivatives that have not been designated to a hedging relationship,
all fair value movements are recognised immediately in the income
statement. (See note (e) for the company’s accounting policy on
hedge accounting).
(ii) Loans and receivables
Loans and receivables are non-derivative financial assets with fixed or
determinable payments that are not quoted on an active market. They
arise when the company provides money, goods or services directly
to a debtor with no intention of trading the receivable. They are included
in current assets. Loans and receivables are initially recognised at fair
value including originating fees and transaction costs, and subsequently
measured at amortised cost using the effective interest method less
provision for impairment.
Loans and receivables include trade receivables, loans owed by
subsidiary undertakings, amounts owed by subsidiary undertakings,
amounts owed by associates, other receivables and cash and
cash equivalents.
a. Loans and receivables other than cash and cash equivalents
Loans and receivables other than cash and cash equivalents are initially
recognised at fair value and subsequently measured at amortised cost
less provision for impairment.
A provision for impairment is established when there is objective
evidence that the company will not be able to collect all amounts due
according to the terms of the receivables. The amount of the provision is
the difference between the asset’s carrying value and the present value
of the estimated future cash flows discounted at the original effective
interest rate. This provision is recognised in the income statement.
b. Cash and cash equivalents
In the balance sheet, cash and cash equivalents include cash in hand,
bank deposits repayable on demand and other short-term highly liquid
investments with original maturities of three months or less.
(iii) Financial liabilities held at amortised cost
Financial liabilities held at amortised cost include trade payables,
accruals, other payables and borrowings (such as loans and amounts
owed to subsidiary undertakings and unsecured bonds).
a. Trade payables
Trade payables are initially recognised at fair value and subsequently
measured at amortised cost using the effective interest method.
Trade payables are analysed between current and non-current liabilities
on the face of the balance sheet, depending on when the obligation
to settle will be realised.
b. Borrowings
Borrowings are recognised initially at fair value, net of transaction costs
and are subsequently stated at amortised cost and include accrued
interest and prepaid interest. Borrowings are classified as current
liabilities unless the company has an unconditional right to defer
settlement of the liability for at least 12 months from the balance sheet
date. Borrowings classified as hedged items are subject to hedge
accounting requirements (see note e).
(iv) Financial guarantee contracts
Financial guarantee contracts are defined in IAS 39 as contracts that
require the issuer to make specified payments to reimburse the holder
for a loss it incurs because a specified debtor fails to make payment
when due in accordance with the original or modified terms of a
debt instrument.
Issued financial guarantee contracts are initially recognised at their fair
value and subsequently measured at the higher of the amount initially
recognised less cumulative amortisation recognised and the amount
determined in accordance with IAS 37 ‘Provisions, contingent liabilities
and contingent assets’.
Financial guarantees are amortised over the life of the guarantee, or
accelerated if the third party obligation is settled early. The amortisation
is taken to the income statement.
e) Derivative financial instruments – hedge accounting
Financial assets and financial liabilities at fair value through profit or loss
include all derivative financial instruments. The derivative instruments
used by the company, which are used solely for hedging purposes
(i.e. to offset foreign exchange, commodity price and interest rate risks),
comprise interest rate swaps, cross currency swaps, forward foreign
exchange contracts and other specific instruments as necessary under
the approval of the board. Such derivative instruments are used to alter
the risk profile of an existing underlying exposure of the company in line
with the group’s risk management policies.
Derivatives are initially recorded at fair value on the date a derivative
contract is entered into and are subsequently remeasured at their fair
value. The method of recognising the resulting gain or loss depends on
whether the derivative is designated as a hedging instrument, and, if so,
the nature of the hedging relationship.
In order to qualify for hedge accounting, the company is required to
document at inception the relationship between the hedged item and
the hedging instrument as well as its risk management objectives and
strategy for undertaking hedging transactions. The company is also
required to document and demonstrate that the relationship between
1. Accounting policies continued
Notes to the company financial statements continued
174 SABMiller plc Annual Report 2016
the hedged item and the hedging instrument will be highly effective.
This effectiveness test is reperformed at each period end to ensure
that the hedge has remained and will continue to remain highly effective.
The company designates certain derivatives as either: hedges of the
fair value of recognised assets or liabilities or a firm commitment (fair
value hedge); or hedges of highly probable forecast transactions or
commitments (cash flow hedge).
(i) Fair value hedges
Fair value hedges comprise derivative financial instruments designated
in a hedging relationship to manage the company’s interest rate risk to
which the fair value of certain assets and liabilities are exposed. Changes
in the fair value of the derivative offset the relevant changes in the fair
value of the underlying hedged item attributable to the hedged risk
in the income statement in the period incurred.
Gains or losses on fair value hedges that are regarded as highly effective
are recorded in the income statement together with the gain or loss on
the hedged item attributable to the hedged risk.
(ii) Cash flow hedges
Cash flow hedges comprise derivative financial instruments designated
in a hedging relationship to manage currency and interest rate risk to
which the cash flows of certain assets and liabilities are exposed.
The effective portion of changes in the fair value of the derivative that
is designated and qualifies for hedge accounting is recognised in
other comprehensive income. The ineffective portion is recognised
immediately in the income statement. Amounts accumulated in equity
are reclassified to the income statement in the period in which the
hedged item affects profit or loss. However, where a forecasted
transaction results in a non-financial asset or liability, the accumulated
fair value movements previously deferred in equity are included in the
initial cost of the asset or liability.
f) Interest income
Interest income is recognised on an accruals basis using the effective
interest method.
When a receivable is impaired the company reduces the carrying
amount to its recoverable amount by discounting the estimated future
cash flows at the original effective interest rate, and continuing to unwind
the discount as interest income.
g) Dividend income
Dividend income is recognised when the right to receive payment
is established.
h) Tax
The tax expense for the year comprises current and deferred tax.
Tax is recognised in the income statement, except to the extent that
it relates to items recognised in other comprehensive income or directly
in equity, in which case it is recognised in other comprehensive income
or directly in equity, respectively.
Current tax expense is based on the results for the year as adjusted
for items that are not taxable or not deductible. The company’s liability
for current taxation is calculated using tax rates and laws that have
been enacted or substantively enacted by the balance sheet date.
Deferred tax is provided in full using the liability method, in respect
of all temporary differences arising between the tax bases of assets
and liabilities and their carrying values, except where the temporary
difference arises from goodwill (in the case of deferred tax liabilities)
or from the initial recognition (other than a business combination)
of other assets and liabilities in a transaction that affects neither
accounting nor taxable profit.
Deferred tax liabilities are recognised where the carrying value of an
asset is greater than its tax base, or where the carrying value of a liability
is less than its tax base. Deferred tax is recognised in full on temporary
differences arising from investment in subsidiaries, associates and joint
ventures, except where the timing of the reversal of the temporary
difference is controlled by the company and it is probable that the
temporary difference will not reverse in the foreseeable future.
This includes taxation in respect of the retained earnings of overseas
subsidiaries only to the extent that, at the balance sheet date, dividends
have been accrued as receivable or a binding agreement to distribute
past earnings in future periods has been entered into by the subsidiary.
Deferred income tax is also recognised in respect of the unremitted
retained earnings of overseas associates and joint ventures as the
company is not able to determine when such earnings will be remitted
and when such additional tax such as withholding taxes might
be payable.
A net deferred tax asset is regarded as recoverable and therefore
recognised only when, on the basis of all available evidence, it is
expected that sufficient existing taxable temporary differences will
reverse in the future or there will be sufficient taxable profit available
against which the temporary differences (including carried forward tax
losses) can be utilised.
Deferred tax is measured at the tax rates expected to apply in the
periods in which the timing differences are expected to reverse based
on tax rates and laws that have been enacted or substantively enacted
at balance sheet date. Deferred tax is measured on a non-
discounted basis.
i) Dividend distributions
Dividend distributions are recognised as a liability in the company’s
financial statements in the period in which the dividends are approved
by the company’s shareholders. Interim dividends are recognised
when paid. Dividends declared after the balance sheet date are not
recognised, as there is no present obligation at the balance sheet date.
j) Property, plant and equipment and depreciation
Property, plant and equipment are stated at cost net of accumulated
depreciation and any impairment losses. Cost includes expenditure that
is directly attributable to the acquisition of the assets. Subsequent costs
are included in the asset’s carrying value or recognised as a separate
asset as appropriate, only when it is probable that future economic
benefits associated with the specific asset will flow to the company
and the cost can be measured reliably.
Repairs and maintenance costs are charged to the income statement
during the financial period in which they are incurred.
(i) Assets in the course of construction
Assets in the course of construction are carried at cost less any
impairment loss. Cost includes professional fees and for qualifying
assets certain borrowing costs as determined below. When these assets
are ready for their intended use, they are transferred into the appropriate
category. At this point, depreciation commences on the same basis as
on other property, plant and equipment.
(ii) Depreciation
No depreciation is provided for assets in the course of construction.
In respect of all other property, plant and equipment, depreciation is
provided on a straight-line basis at rates calculated to write off the cost,
less the estimated residual value, of each asset over its expected useful
life as follows.
Office equipment 2 – 10 years
Short leasehold buildings Shorter of the lease term or 50 years
The company regularly reviews all of its depreciation rates and residual
values to take account of any changes in circumstances. When setting
useful economic lives, the principal factors the company takes into
account are the expected rate of technological developments, expected
market requirements for the equipment and the intensity at which the
assets are expected to be used.
The profit or loss on the disposal of an asset is the difference between
the disposal proceeds and the net book amount.
1. Accounting policies continued
175SABMiller plc Annual Report 2016
FINANCIALSTATEMENTS
FINANCIAL STATEMENTS
(iii) Capitalisation of borrowing costs
Financing costs incurred, before tax, on major capital projects during the
period of development or construction that necessarily take a substantial
period of time to be developed for their intended use, are capitalised up
to the time of completion of the project.
k) Intangible assets and amortisation
Intangible assets are stated at cost less accumulated amortisation on
a straight-line basis (if applicable) and impairment losses. Cost is usually
determined as the amount paid by the company, unless the asset has
been acquired as part of a business combination. Intangible assets
acquired as part of a business combination are recognised at their fair
value at the date of acquisition. Amortisation is included within net
operating expenses in the income statement. Internally generated
intangibles are not recognised except for computer software and applied
development costs referred to under computer software and research
and development below.
Intangible assets with finite lives are amortised over their estimated useful
economic lives, and only tested for impairment where there is a triggering
event. The company regularly reviews all of its amortisation rates and
residual values to take account of any changes in circumstances.
The directors’ assessment of the useful life of intangible assets is based
on the nature of the asset acquired, the durability of the products to
which the asset attaches and the expected future impact of competition
on the business.
(i) Computer software
Where computer software is not an integral part of a related item of
property, plant and equipment, the software is capitalised as an
intangible asset. Acquired computer software licences are capitalised
on the basis of the costs incurred to acquire and bring them to use.
Direct costs associated with the production of identifiable and unique
internally generated software controlled by the company that will
probably generate economic benefits exceeding costs beyond one year
are capitalised. Direct costs include software development employment
costs (including those of contractors used), capitalised interest and
an appropriate portion of overheads. Capitalised computer software,
licence and development costs are amortised over their useful economic
lives of between three and eight years. Internally generated costs
associated with maintaining computer software programmes are
expensed as incurred.
(ii) Research and development
Research and general development expenditure is written off in the
period in which it is incurred. Certain applied development costs are
only capitalised as internally generated intangible assets where there
is a clearly defined project, separately identifiable expenditure, an
outcome assessed with reasonable certainty (in terms of feasibility
and commerciality), expected revenues exceed expected costs and
the company has the resources to complete the task. Such assets
are amortised on a straight-line basis over their useful lives once the
project is complete.
l) Employee benefits
(i) Wages and salaries
Wages and salaries for current employees are recognised in the income
statement as the employees’ services are rendered.
(ii) Vacation and long-term service awards costs
The company recognises a liability and an expense for accrued vacation
pay when such benefits are earned and not when these benefits are
paid. The company recognises a liability and an expense for long-term
service awards where cash is paid to the employee at certain milestone
dates in a career with the company. Such accruals are appropriately
discounted to reflect the future payment dates at discount rates
determined by reference to local high-quality corporate bonds.
(iii) Profit-sharing and bonus plans
The company recognises a liability and an expense for bonuses and
profit-sharing, based on a formula that takes into consideration the profit
attributable to the company’s shareholders after certain adjustments.
The company recognises a provision where contractually obliged or
where there is a past practice that has created a constructive obligation.
(iv) Share-based compensation
The company operates a variety of equity-settled share-based
compensation plans.
The equity-settled plans comprise share option and stock appreciation
rights plans (with and without market performance conditions attached),
performance share award plans (with and without market performance
conditions attached) and awards related to the employee element of
the Broad-Based Black Economic Empowerment (BBBEE) scheme
in South Africa. An expense is recognised to spread the fair value of
each award over the vesting period on a straight-line basis, after
considering an estimate of the share awards that will eventually vest.
A corresponding adjustment is made to equity over the remaining
vesting period. The estimate of the level of vesting is reviewed at least
annually, with any impact on the cumulative charge being recognised
immediately. In addition the company has granted an equity-settled
share-based payment to retailers in relation to the retailer element
of the BBBEE scheme.
The charges are based on the fair value of the awards as at the date
of grant, as calculated by various binomial model calculations and
Monte Carlo simulations. The charges are not reversed if the options
and awards are not exercised because the market value of the shares
is lower than the option price at the date of grant. The proceeds received
net of any directly attributable transaction costs are credited to share
capital (nominal value) and share premium when the options are
exercised unless the options are satisfied by the transfer of treasury
or other Employee Benefit Trust (EBT) shares.
The issue by the company to employees of its subsidiaries of a grant
over the company’s shares represents additional capital contributions
by the company to its subsidiaries, except to the extent the company
is reimbursed. An additional investment in subsidiaries results in a
corresponding increase in shareholders’ equity. The additional capital
contribution is based on the fair value of the grant issued allocated
over the underlying grant’s vesting period.
The company has an employee benefit trust, the SABMiller Associated
Companies’ Employees’ Benefit Trust (AC-EBT). The AC-EBT may hold
shares in SABMiller plc for the purposes of providing share incentives
for employees of companies in which SABMiller has a significant
economic and strategic interest but over which it does not have
management control.
Shares held by EBTs and in treasury are treated as a deduction from
equity until the shares are utilised.
(v) Pension obligations
The contributions to defined contribution plans are recognised as an
expense as the costs become payable. The contributions are recognised
as employee benefit expense when they are due. Prepaid contributions
are recognised as an asset to the extent that a cash refund or
a reduction in the future payments is available.
m) Operating leases
Rentals paid and incentives received on operating leases are charged
or credited to the income statement on a straight-line basis over the
lease term.
n) Impairment of non-financial assets
This policy covers all assets except financial assets (see note d) and
deferred tax assets (see note h).
1. Accounting policies continued
Notes to the company financial statements continued
176 SABMiller plc Annual Report 2016
Impairment reviews are performed by comparing the carrying value of
the fixed asset with its recoverable amount, being the higher of the fair
value less costs of disposal and value in use. The fair value less costs
of disposal is considered to be the amount that could be obtained on
disposal of the asset, and therefore is determined from a market
participant perspective. The recoverable amount under both calculations
is determined by discounting the future post-tax cash flows generated
from continuing use of the cash generating unit (CGU) using a post-tax
discount rate. For value in use, this closely approximates applying
pre-tax discount rates to pre-tax cash flows. Where a potential
impairment is identified using post-tax cash flows and post-tax discount
rates, the impairment review is reperformed on a pre-tax basis in order
to determine the impairment loss to be recorded.
Where the asset does not generate cash flows that are independent
from the cash flows of other assets, the company estimates the
recoverable amount of the CGU to which the asset belongs. For the
purpose of conducting impairment reviews, CGUs are considered
to be groups of assets that have separately identifiable cash flows.
They also include those assets and liabilities directly involved in
producing the income and a suitable proportion of those used to
produce more than one income stream.
When the carrying values of fixed assets are written down by any
impairment amount, the loss is recognised in the income statement
in the period in which it is incurred.
Should circumstances or events change and give rise to a reversal
of a previous impairment loss, the reversal is recognised in the income
statement in the period in which it occurs and the carrying value of the
asset is increased. The increase in the carrying value of the asset
is restricted to the amount that it would have been had the original
impairment not occurred.
Assets subject to amortisation or depreciation are reviewed for
impairment if circumstances or events change to indicate that the
carrying value may not be fully recoverable.
o) Share capital
Ordinary shares are classified as equity. Incremental costs directly
attributable to the issue of new shares or options are shown in equity
as a deduction, net of tax, from the proceeds.
p) Investments in own shares (treasury and shares held by
employee benefit trusts)
Shares held by employee share ownership plans, employee benefit
trusts and in treasury are treated as a deduction from equity until the
shares are cancelled, reissued, or disposed. Where such shares are
subsequently sold or reissued, any consideration received, net of any
directly attributable incremental costs and related tax effects, is included
in equity attributable to the company’s equity shareholders.
2. Key estimates and judgements
In determining and applying accounting policies, judgement is often
required where the choice of specific policy, assumption or accounting
estimate to be followed could materially affect the reported results or net
position of the company, should it later be determined that a different
choice be more appropriate.
Management considers the following to be areas of significant
judgement and estimation for the company due to greater complexity
and/or particularly subject to the exercise of judgement. Management
has reconsidered the significant judgements and estimates applied,
and has not assumed the completion of the AB InBev transaction.
(i) Impairment reviews
Impairment reviews are performed if events indicate that this is
necessary. Impairment reviews are based on future cash flows
discounted using the weighted average cost of capital with terminal
values calculated applying a long-term growth rate. The future cash flows
which are based on business forecasts, the long-term growth rates and
the discount rates used are dependent on management estimates and
judgements. Future events could cause the assumptions used in these
impairment reviews to change with a consequent adverse impact on the
results and net position of the company.
(ii) Taxation
Significant judgement is required in determining the provision for taxes
as the tax treatment is often by its nature complex, and cannot be finally
determined until a formal resolution has been reached with the relevant
tax authority which may take several years to conclude. Amounts
provided are accrued based on management’s interpretation of country
specific tax laws and the likelihood of settlement. Actual liabilities could
differ from the amount provided which could have a consequent adverse
impact on the results and net position of the company.
(iii) Share-based compensation
Accounting for share-based compensation requires certain assumptions
to be made in order to determine the amounts to be recognised in the
income statement in accordance with IFRS 2. The income statement
charge spreads the fair value of each award at the grant date over the
vesting period on a straight-line basis, after considering an estimate of
the share awards that will eventually vest. The estimate of the level of
vesting is reviewed at least annually, with any impact on the cumulative
charge recognised immediately. The completion of the proposed
AB InBev transaction has not been assumed in determining the extent
and timing of the vesting of awards. Details of the assumptions used in
determining fair values of grants in the year are set out in note 25 to the
consolidated financial statements of the group.
1. Accounting policies continued
177SABMiller plc Annual Report 2016
FINANCIALSTATEMENTS
FINANCIAL STATEMENTS
3. Intangible assets
Assets in
course of
construction
US$m
Software
US$m
Total
US$m
Cost
At 1 April 2015 51 210 261
Additions 9 18 27
Transfers (41) 38 (3)
At 31 March 2016 19 266 285
Accumulated depreciation
At 1 April 2015 – 128 128
Charge for the year – 24 24
At 31 March 2016 – 152 152
Net book amount
At 1 April 2015 51 82 133
At 31 March 2016 19 114 133
4. Property, plant and equipment
Assets in
course of
construction
US$m
Short
leasehold
land and
buildings
US$m
Office
equipment
US$m
Total
US$m
Cost
At 1 April 2015 23 36 22 81
Additions 4 – 5 9
Disposals – (2) (2) (4)
Transfers (15) – 18 3
At 31 March 2016 12 34 43 89
Accumulated depreciation
At 1 April 2015 – 24 13 37
Disposals – (2) (1) (3)
Charge for the year – 3 4 7
At 31 March 2016 – 25 16 41
Net book amount
At 1 April 2015 23 12 9 44
At 31 March 2016 12 9 27 48
5. Investments in subsidiaries
2016
US$m
2015
US$m
Cost
At 1 April 14,305 14,242
Additions – 14
Capital contributions relating to share-based payments 59 49
At 31 March 14,364 14,305
Accumulated impairment
At 1 April 236 140
Impairment – 96
At 31 March 236 236
Net book value
At 1 April 14,069 14,102
At 31 March 14,128 14,069
Notes to the company financial statements continued
178 SABMiller plc Annual Report 2016
5. Investments in subsidiaries continued
The net book value of investments in subsidiaries at 31 March 2016 of US$14,128 million (2015: US$14,069 million) includes US$633 million
(2015: US$574 million) from capital contributions relating to share-based payments as well as US$5 million (2015: US$5 million) relating
to a contribution of ZAR 36 million towards the cost of a guarantee fee to SABSA Holdings Ltd, a fellow group undertaking.
The directors consider that the carrying values of the investments are supported by their underlying net assets.
The direct investments in subsidiary undertakings are as follows (all interests are 100% unless stated otherwise).
Name Country of incorporation Principal activity Share class
2016
US$m
2015
US$m
SABMiller Holdings Ltd United Kingdom Holding company US$1 ordinary 10,633 10,633
Miller Brands (UK) Ltd United Kingdom Sales and distribution US$1 ordinary 39 39
SABMiller Management BV Netherlands Management services €1 ordinary – –
SABMiller Africa & Asia BV¹ Netherlands Holding company €1 ordinary 195 195
Appletiser International BV Netherlands Holding company €1 ordinary – –
SABMiller (Safari) United Kingdom Finance company US$1 ordinary 506 506
Pilsner Urquell International BV Netherlands Holding company €1 ordinary – –
SABMiller Holdings Europe Ltd United Kingdom Holding company £1 ordinary 2,117 2,117
Racetrack Colombia Finance SAS Colombia Dormant company COP1,000 ordinary – –
SABMiller Horizon Ltd United Kingdom Agent company US$1 ordinary – –
SABSA Holdings Ltd² South Africa Holding company n/a 5 5
SABMiller Capital UK Ltd United Kingdom Holding company US$1 ordinary – –
SABMiller Asia Capital LLP³ United Kingdom Partnership US$1 ordinary – –
SA Breweries Ltd United Kingdom Dormant company £1 ordinary – –
South Africa Breweries Ltd United Kingdom Dormant company £1 ordinary – –
South African Breweries Ltd United Kingdom Dormant company £1 ordinary – –
13,495 13,495
Capital contribution relating to share-based payments 633 574
14,128 14,069
1
Operates and resident for tax purposes in the United Kingdom.
2
SABMiller plc contributed ZAR36 million towards the cost of guarantee fee to SABSA Holdings Ltd, a fellow group undertaking. It has no direct interest in the share capital of that company.
3
1% direct interest and 100% effective interest.
Indirect investments held by the company, such as subsidiaries, associates and joint ventures of the company’s direct investments, are detailed
in the related undertakings section of the annual report.
6. Loans and other financial assets
2016
US$m
2015
US$m
Due after more than one year
Loans owed by subsidiary undertakings 1,886 5,529
Amounts owed by subsidiary undertakings 205 231
Financial guarantee asset – 2
2,091 5,762
Due within one year
Loans owed by subsidiary undertakings 4,446 938
Amounts owed by subsidiary undertakings 190 200
Amounts owed by associated undertakings 1 1
Financial guarantee asset 2 3
4,639 1,142
Interest on the loan owed by subsidiary undertakings due after more than one year is charged at floating rates. The floating rate is one month LIBOR
plus 180 basis points (bps) and the loan is repayable in 2017.
Interest on loans owed by subsidiary undertakings due within one year is charged at either fixed or floating rates. The fixed rate is 1.72%. The floating
rate is one month LIBOR or equivalent depending on the location of the subsidiary undertaking. Spreads range from plus 10 bps to 80 bps.
All amounts owed by subsidiary undertakings are non-interest bearing with a fixed repayment date.
179SABMiller plc Annual Report 2016
FINANCIALSTATEMENTS
FINANCIAL STATEMENTS
7. Trade and other receivables
2016
US$m
2015
US$m
Due after more than one year
Prepayments 15 20
Due within one year
Other debtors 39 31
Corporation tax – 28
39 59
8. Derivative financial instruments
2016 2015
Notional
amounts
US$m
Assets
US$m
Liabilities
US$m
Notional
amounts
US$m
Assets
US$m
Liabilities
US$m
Derivative financial instruments due after more
than one year
Forward foreign currency contracts – – – 1 – –
Forward foreign currency contracts designated as cash
flow hedges 40 – (1) 46 – (1)
Interest rate swaps 600 24 (5) 1,600 64 (4)
Interest rate swaps designated as fair value hedges 300 150 – 300 146 –
Cross currency swaps 180 74 – 286 178 –
1,120 248 (6) 2,233 388 (5)
Derivative financial instruments due within one year
Forward foreign currency contracts 134 – (4) 563 20 (7)
Forward foreign currency contracts designated as cash
flow hedges 276 1 (11) 290 – (25)
Interest rate swaps 1,000 15 (2) – – –
Cross currency swaps 95 109 (2) – – –
1,505 125 (19) 853 20 (32)
Derivatives designated as hedging instruments
(i) Cash flow hedges
The company has entered into forward exchange contracts designated as cash flow hedges to manage short-term foreign currency exchange
exposures to future creditor payments.
(ii) Fair value hedges
The company has entered into interest rate swaps to pay floating and receive fixed interest which have been designated as fair value hedges to
manage changes in the fair value of its fixed rate borrowings. The borrowings and interest rate swaps have the same critical terms.
As at 31 March 2016, the carrying value of the hedged borrowings was US$471 million (2015: US$460 million).
Held for trading derivative financial instruments
(i) Forward foreign currency contracts
The company has entered into several forward foreign currency contracts to manage the group’s exposure to foreign exchange risk on the
investments in subsidiaries and fellow group undertakings in South Africa (2015: South Africa and Poland) and also GBP-denominated balance
sheet exposures.
(ii) Cross currency swaps
The company has entered into several cross currency swaps to manage the group’s exposure to foreign exchange risk relating to subsidiaries
and fellow group undertakings in South Africa and the Netherlands (2015: South Africa and the Netherlands).
(iii) Interest rate swaps
The company has entered into interest rate swaps to manage exposures to fluctuations in interest rates. The derivatives are fair valued based
on discounted future cash flows with gains and losses taken to the income statement.
Notes to the company financial statements continued
180 SABMiller plc Annual Report 2016
9. Cash and cash equivalents
2016
US$m
2015
US$m
Short-term deposits 878 449
The company has short-term deposits in US dollars and British pounds. The effective interest rate was 0.24% (2015: 0.18%).
10. Borrowings
2016
US$m
2015
US$m
Due within one year
Loans owed to subsidiary undertakings 1,106 434
Amounts owed to subsidiary undertakings 20 26
1,126 460
Due after more than one year
Amounts owed to subsidiary undertakings – 3
Unsecured bonds 1,215 1,220
1,215 1,223
The maturity of borrowings due after more than one year is as follows:
Between one and two years – 2
Between two and five years 745 761
After five years 470 460
1,215 1,223
Interest on loans owed to subsidiary undertakings due within one year is charged at floating rates. The floating rates are one or six month LIBOR
or equivalent depending on the location of the subsidiary undertaking. Spreads range from minus 13 bps to plus 80 bps. All amounts owed to
subsidiary undertakings are unsecured and repayable on demand.
The amount due after five years consists of a bond. The bond matures in 2033 with a fixed interest rate of 6.625%.
11. Trade and other payables
2016
US$m
2015
US$m
Due within one year
Trade and other payables 79 35
Taxation and social security 37 25
Accruals and deferred income 72 64
Dividends payable to shareholders – 1
188 125
Due after more than one year
Other creditors 6 5
Deferred income 4 5
10 10
The maturity of trade and other payables due after more than one year is as follows:
Between one and two years 6 5
Between two and five years 3 3
After five years 1 2
10 10
181SABMiller plc Annual Report 2016
FINANCIALSTATEMENTS
FINANCIAL STATEMENTS
12. Fair values of financial assets and financial liabilities
Book value
2016
US$m
Fair value
2016
US$m
Book value
2015
US$m
Fair value
2015
US$m
Non-current borrowings (1,215) (1,161) (1,220) (1,202)
Non-current loans 1,886 1,919 5,529 6,044
All financial assets and liabilities, other than those included in the table above, have a book value which approximates to their fair value.
The fair values of financial instruments that are traded in active markets are based on quoted market prices at the balance sheet date. A market
is regarded as active if quoted prices are readily and regularly available from an exchange, dealer, broker, industry company, pricing service or
regulatory agency and these prices represent actual and regularly occurring transactions on arm’s length basis.
The fair values of financial instruments that are not traded in an active market are based on the net present value of the anticipated future cash flows
associated with these instruments, using rates currently available for debt on similar terms, credit risk and remaining maturity.
Fair value gain on financial instruments recognised in profit and loss
2016
US$m
2015
US$m
Derivative financial instruments:
Forward foreign currency contracts (6) 40
Fair value gain on forward foreign currency contracts transferred from other comprehensive loss (23) 1
Interest rate swaps (34) (33)
Interest rate swaps designated as fair value hedges 11 40
Cross currency swaps 2 66
(50) 114
Other financial instruments:
Guarantee fees 54 58
Early repayment costs – (48)
Other fair value gains 16 11
Borrowings designated as the hedged item in a fair value hedge (11) (38)
59 (17)
Total fair value gain on financial instruments recognised in profit and loss 9 97
13. Other financial liabilities
2016
US$m
2015
US$m
Due within one year
Financial guarantee in respect of subsidiary borrowings 45 50
Loan guarantee provision 20 –
65 50
Due after more than one year
Financial guarantees in respect of subsidiary borrowings 188 231
The company has guaranteed the bank overdrafts and drawn components of bank loans and issued bonds of a number of subsidiaries. Under the
terms of the financial guarantee contracts, the company will make payments to reimburse the lenders upon failure of the guaranteed entity to make
payments when due.
Terms and notional values of the liabilities guaranteed were as follows.
2016
US$m
2015
US$m
Financial year of maturity
2016 – 640
2017 2,350 2,251
2018 232 257
2019 1,100 1,100
2020 1,138 1,073
2021 536 –
2022 2,500 2,500
2042 1,500 1,500
9,356 9,321
Additionally the company has recorded a provision of US$20 million in relation to loan guarantees in Angola.
Notes to the company financial statements continued
182 SABMiller plc Annual Report 2016
14. Reserves
Foreign exchange differences recognised in the profit for the year, except for those arising on financial instruments measured at fair value under
IAS 39, were gains of US$55 million (2015: losses of US$70 million).
Retained earnings include US$nil of non-distributable reserves (2015: US$3,645 million). During the year, upon realisation of qualifying consideration,
the company recognised US$3,645 million of non-distributable reserves as distributable.
Merger relief reserve
At 1 April 2015 the merger relief reserve comprised US$3,395 million in respect of the excess of value attributed to the shares issued as consideration
for Miller Brewing Company over the nominal value of those shares and US$568 million relating to the merger relief arising on the issue of SABMiller
plc ordinary shares for the buyout of non-controlling interests in the group’s Polish business. During the year ended 31 March 2016, the company
transferred US$335 million of the reserve relating to the Polish business to retained earnings upon realisation of qualifying consideration.
Further information relating to the share capital, share premium, the treasury shares and the EBT reserve of the company is detailed in notes 25
and 26 to the consolidated financial statements of the group. Details of share incentive schemes are provided in note 25 to the consolidated
financial statements of the group. Details of dividends paid and proposed for the year are provided in note 9 to the consolidated financial statements
of the group.
15. Profit and loss information
Information relating to directors’ remuneration is included in the directors’ remuneration report on pages 74 to 92.
The fee charged for the statutory audit was US$0.1 million (2015: US$0.1 million).
The average monthly number of employees for the year is shown on a full-time equivalent basis and includes executive directors.
2016 2015
Number of employees 716 676
The aggregate payroll costs were as follows.
2016
US$m
2015
US$m
Wages and salaries 142 125
Share-based payments (2) 4
Social security costs 2 2
Contributions to defined contribution plans 11 9
153 140
Details of key management remuneration are provided in note 6 to the consolidated financial statements of the group.
Operating leases
Operating lease charges recognised in the income statement during the year were as follows.
2016
US$m
2015
US$m
Plant and machinery 5 4
Other 6 6
183SABMiller plc Annual Report 2016
FINANCIALSTATEMENTS
FINANCIAL STATEMENTS
16. Other information
a. Deferred tax assets have not been recognised in respect of the following.
2016
US$m
2015
US$m
Tax losses 63 58
Depreciation in excess of capital allowances 10 6
Accruals and provisions – 1
Share-based payments 51 47
124 112
b. Contingent liabilities and guarantees
The company has guaranteed borrowings in respect of certain subsidiary undertakings. Guarantee fees received from 100% owned subsidiaries
were US$53 million (2015: US$57 million).
Guarantees provided on behalf of related parties in respect of bank facilities were US$373 million (2015: US$525 million). Note 17 details guarantee
fees received from and paid to related parties.
Guarantees provided on behalf of third parties in respect of bank facilities were US$49 million (2015: US$54 million). A loan guarantee provision
of US$20 million is held by the company against guarantees related to third party loans.
As a result of the AB InBev offer, the company has various commitments which are contingent on the completion of the transaction, including
advisers’ fees and staff-related costs, principally reflecting the impact of accelerated vesting of share-based compensation. These contingent
liabilities, which have not been recognised in the company’s results for the year ended 31 March 2016, are estimated to range from US$250 million
to US$300 million.
At 31 March 2016 the company had total annual commitments under non-cancellable operating leases as follows.
2016
US$m
2015
US$m
Land and buildings
Within one year 6 6
Between two and five years 14 18
After five years – 1
Other
Within one year 1 3
Between two and five years 2 3
17. Related party transactions
Transactions with undertakings which are not wholly owned
The company has taken advantage of the exemption provided under FRS 101.8j not to disclose transactions with subsidiaries which are wholly
owned. During the year the company had transactions with undertakings in which it does not hold a 100% interest as follows.
2016
US$m
2015
US$m
Guarantee fee income from group subsidiaries 1 3
Guarantee fees paid to subsidiary undertakings (2) (1)
31 March
2016
US$m
2015
US$m
Amounts owed by subsidiary undertakings falling due within one year 5 1
Amounts owed by associated undertakings falling due within one year 1 1
Amounts owed by subsidiary undertakings falling due after more than one year – 4
Amounts owed to subsidiary undertakings falling due within one year (3) (4)
Amounts owed to subsidiary undertakings falling due after more than one year – (3)
Notes to the company financial statements continued
184 SABMiller plc Annual Report 2016
18. Explanation of transition to FRS 101 from old UK GAAP
As stated in note 1, these are the company’s first financial statements prepared in accordance with FRS 101.
The accounting policies set out in note 1 have been applied in preparing the financial statements for the year ended 31 March 2016 and the
comparative information presented in these financial statements for the year ended 31 March 2015.
In preparing its FRS 101 balance sheet, the company has reclassified amounts reported previously in financial statements prepared in accordance
with its old basis of accounting (UK GAAP). An explanation of how the transition from UK GAAP to FRS 101 has affected the company’s financial
position and financial performance is set out in the following tables and the notes that accompany the tables. There was no impact on total
comprehensive income for the year ended 31 March 2015 and no impact on net assets as at 31 March 2015 or 1 April 2014.
31 March 2015 1 April 2014
UK GAAP
US$m
Cumulative
effect of
transition to
FRS 101
US$m
FRS 101
US$m
UK GAAP
US$m
Cumulative
effect of
transition to
FRS 101
US$m
FRS 101
US$m
Assets
Fixed assets
Intangible assets¹ – 133 133 – 119 119
Property, plant and equipment¹ 177 (133) 44 158 (119) 39
Investments in subsidiaries 14,069 – 14,069 14,102 – 14,102
14,246 – 14,246 14,260 – 14,260
Current assets
Debtors – due after more than one year² 5,782 (5,782) – 5,412 (5,412) –
Loans and other financial assets due after more than one year² – 5,762 5,762 – 5,405 5,405
Trade and other receivables due after more than one year² – 20 20 – 7 7
Derivatives – due after more than one year² 388 (388) – 301 (301) –
Derivative financial instruments due after more than one year² – 388 388 – 301 301
Debtors – due within one year² 1,201 (1,201) – 2,293 (2,293) –
Loans and other financial assets due within one year² – 1,142 1,142 – 2,171 2,171
Trade and other receivables² – 59 59 – 122 122
Derivative financial instruments² 20 – 20 52 – 52
Cash and cash equivalents 449 – 449 1,532 – 1,532
7,840 – 7,840 9,590 – 9,590
Total assets 22,086 – 22,086 23,850 – 23,850
Liabilities
Current liabilities
Creditors – due within one year² (667) 667 – (2,091) 2,091 –
Derivative financial instruments² – (32) (32) – (11) (11)
Borrowings² – (460) (460) – (1,858) (1,858)
Trade and other payables² – (125) (125) – (166) (166)
Other financial liabilities² – (50) (50) – (56) (56)
(667) – (667) (2,091) – (2,091)
Net current assets 7,173 – 7,173 7,499 – 7,499
Total assets less current liabilities 21,419 – 21,419 21,759 – 21,759
Non-current liabilities
Creditors – due after more than one year² (1,469) 1,469 – (2,387) 2,387 –
Derivative financial instruments² – (5) (5) – (1) (1)
Borrowings² – (1,223) (1,223) – (2,089) (2,089)
Trade and other payables² – (10) (10) – (16) (16)
Other financial liabilities² – (231) (231) – (281) (281)
(1,469) – (1,469) (2,387) – (2,387)
Net assets 19,950 – 19,950 19,372 – 19,372
Total equity 19,950 – 19,950 19,372 – 19,372
¹ Reclassification of software balances of US$133 million (2014: US$119 million) from tangible assets to intangible assets.
² The balance sheet has been represented under FRS 101 to show separate categories on the face of the balance sheet.
185SABMiller plc Annual Report 2016
FINANCIALSTATEMENTS
FINANCIAL STATEMENTS
Related undertakings
Name of undertaking
Country
of incorporation Share class
A.C.N. 087 233 154 Pty Ltd Australia AUD Ordinary–No par value
Amayana Pty. Ltd. Australia AUD1.00 Ordinary
Anglemaster Limited United Kingdom £0.25 Ordinary
Appletise Hong Kong Limited Hong Kong HKD1.00 Ordinary
Appletiser Limited United Kingdom £1.00 Ordinary
Austindia Pty Ltd Australia AUD Ordinary–No par value
Axin y Cia LTDA Colombia COP2.00 Ordinary
BCA–Bebidas de Calidad Para
Argentina S.A.
Argentina ARS1.00 Ordinary
Bevco Limited Corp. Panama US$1.00 Ordinary
Bevman Services AG Switzerland CHF100.00 Ordinary
BHG Brewing Licence Company
Limited
Cyprus €1.71 Ordinary
Bier Beteiligungserwerbs GmbH Austria ATS1.00 Ordinary
Birra Peroni S.r.l. Italy € Share capital
Bisa Beteiligungs GmbH Germany € Share capital
Bluetongue Brewery Pty Limited Australia AUD1.00 Ordinary
Bourse du Vin Limited United Kingdom £1.00 Ordinary
Brewing Holdings Pty Ltd Australia AUD0.50 Ordinary
Brewing Investments Pty Ltd Australia AUD1.00 Ordinary
Brewman Group Limited United Kingdom £0.25 Ordinary
Bright Star Investments Pty Ltd Australia US$1.00 Ordinary
Browar Dojlidy S.A. Poland PLN50.00 Ordinary
Bulmer Australia Pty Ltd Australia AUD Ordinary
Cantab Holdings N.V. Curaçao US$1,000.00 B ordinary
US$1,000.00 Preference
Canterbury Overseas Inc. British Virgin Islands US$1.00 Ordinary
Carlton and United Breweries Holdings
(UK) Limited
United Kingdom £1.00 Ordinary
Cascade Brewery Company Pty Ltd Australia AUD1.00 Ordinary
AUD1.00 Redeemable
preference
Cerveceria Argentina Sociedad
Anomima Isenbeck
Argentina ARS1.00 Ordinary
Cervejas de Angola LDA Angola AOA 200,000 Ordinary
CNAB Pty Ltd Australia AUD Ordinary
AUD Ordinary-A
AUD Ordinary-B
AUD Special
Coca-Cola Beverages Africa Limited United Kingdom US$1.00 Ordinary
Craigburn Land Co. Pty. Ltd. Australia AUD1.00 Ordinary
CUB (New Zealand) Limited New Zealand NZD1.00 Ordinary
CUB (NZ) Holding Co Pty Ltd Australia AUD1.00 Ordinary
CUB People Pty Ltd Australia AUD1.00 Ordinary
CUB Pty Ltd Australia AUD1.00 CLASS A
AUD1.00 Ordinary
De Antilope B.V. Netherlands €1.00 Ordinary
De Giraffe B.V. Netherlands €1.00 Ordinary
De Klok Dranken B.V. Netherlands €1.00 Ordinary
Dismin Investments Pty. Ltd. Australia AUD1.00 Ordinary
Dreamgame Limited United Kingdom £0.25 8% Cumulative
Redeemable Preference
£0.25 Ordinary
East West Oriental Brewing Company
Limited
United Kingdom £1.00 Ordinary
EFG Australia Pty Ltd Australia AUD1.00 ‘A’ Ordinary
AUD1.00 ‘B’ Ordinary
EFG Finance Leasing Pty Ltd Australia AUD2.00 Ordinary
EFG Investments Pty Ltd Australia AUD1.00 Non-cumulative
preference
AUD1.00 Ordinary
EFG Securities Pty Ltd Australia AUD1.00 A Ordinary
AUD1.00 B Ordinary
AUD1.00 Non-cumulative
preference
EFG Treasury Pty Limited Australia AUD1.00 Ordinary
ELFIC Pty Ltd Australia AUD1.00 A Ordinary
AUD1.00 B Ordinary
Elstone Developments Pty. Ltd. Australia AUD1.00 Ordinary
FBG Brewery Holdings UK Limited United Kingdom £1.00 Ordinary
FBG Finance Pty Ltd Australia AUD1.00 Ordinary
FBG Holdings (UK) Limited United Kingdom £1.00 Ordinary
FBG International Limited United Kingdom £1.00 Ordinary
FBG Treasury (Aust.) Pty Ltd Australia AUD1.00 Ordinary
FBG Treasury (UK) Limited United Kingdom £1.00 Ordinary
Foster’s Brands Limited United Kingdom £1.00 Ordinary
Foster’s Brewing Group Pty. Ltd. Australia AUD1.00 Ordinary
Foster’s Group Pty Ltd Australia AUD Ordinary
Gardwell Limited British Virgin Islands US$1.00 Ordinary
Grolsch Agencies B.V. Netherlands €1.00 Ordinary
Grolsch Canada Inc Canada CAD1.00 C1 Ordinary
CAD20.00 C2 Ordinary
CAD1.00 C3 Ordinary
Grolsch International B.V. Netherlands €1.00 Ordinary
Grolsch Monumenten B.V. Netherlands €100.00 Ordinary
The direct related undertakings of the company as at 31 March 2016 are shown in note 5 to the company financial statements.
(a) Indirect wholly owned subsidiaries
Unless indicated all shares are 100% held by group companies and effective interests are 100%.
Name of undertaking
Country
of incorporation Share class
Grolsch Vastgoed B.V. Netherlands €100.00 Ordinary
Grolsche Bierbrouwerij Nederland B.V. Netherlands €1.00 Ordinary
Hotel Solutions Inc British Virgin Islands USD1.00 Ordinary
Industrias La Constancia S.A. de C.V. El Salvador US$1.00 Ordinary
I-NOVA Consulting Pty Ltd Australia AUD Ordinary
Kangaroo Ridge Wines Europe Limited United Kingdom £1.00 Ordinary
Kompania Piwowarska S.A. Poland PLN2.50 Ordinary
Koninklijke Grolsch N.V. Netherlands €1.00 Ordinary
Liana Cottage Pty Ltd Australia 1.00 Ordinary
Linser N.V. Curaçao US$1.00 Ordinary
US$1.00 Preference
Linton Brewing Pty Ltd Australia AUD Ordinary
Lion Enterprises Singapore Pte. Ltd. Singapore SGD1.00 Ordinary
Marshville Associates Inc. Panama Ordinary
MBBC Pty Ltd Australia 1.00 Ordinary
MBL Breweries Limited India INR100.00 Ordinary
Meantime Brewing Company (Retail)
Limited
United Kingdom £1.00 Ordinary
Meantime Brewing Company Limited United Kingdom £1.00 Ordinary
Miller Brewing 1855, Inc. USA US$1.00 Common Stock
Miller Brewing Company USA Common Stock
Miller Brewing International Inc. Chile
Limitada
Chile Partnership interest
Miller Brewing International, Inc. USA US$1.00 Common stock
Miller Brewing Trading Company
Limited
Canada Common
Miller Servicios Mexicanos S.A. de C.V. Mexico US$1.00 Series B ordinary
US$1.00 Series BB ordinary
Miller Trading Company S.A. de C.V. Mexico US$1.00 Minimum Fixed Capital
Series B
US$1.00 Variable Capital Series
BB
MUBEX Mauritius US$1.00 Ordinary
MUFIN Mauritius US$1.00 Ordinary
Negocios Inmobiliarios Agroindustriales
S.A. de C.V.
El Salvador US$1.00 Ordinary
New Crest Investments Pty. Ltd. Australia AUD1.00 Ordinary
Newark Investments AG Switzerland CHF100.00 Ordinary
Newbelco SA/NV Belgium €0.01 Ordinary
Pacific Beverages Pty Ltd Australia AUD Ordinary
Peroni Nastro Azzurro Limited Isle of Man US$1.00 Ordinary
Pilsner Urquell Company Limited United Kingdom £1.00 Ordinary
Pilsner Urquell International Limited United Kingdom £1.00 Ordinary
Pilsner Urquell Investments B.V. Netherlands €1.00 Ordinary
Pivovary Topvar a.s. Slovakia €33,194.00 Ordinary
€14,000,000.00 Ordinary
€33.20 Registered bearer
Plze ˇnský Prazdroj as Czech Republic CZK1,000.00 Ordinary
Queensland Breweries Pty Ltd Australia 1.00 Cumulative preference
1.00 Ordinary
RSG Land Group Pty Ltd Australia AUD2.00 Ordinary
S.A. Breweries Ltd South Africa ZAR1.00 Ordinary
SAB Colombia S.A.S. Colombia COP1,000.00 Ordinary
SAB Limited United Kingdom £1.00 Ordinary
SABFIN (Pty) Limited South Africa ZAR2.00 Ordinary
SABM Centro America S. de R.L. Panama US$1.00 Ordinary
Sabmark International Inc. British Virgin Islands US$1.00 Ordinary
SABMiller Africa Mauritius US$1.00 Ordinary
SABMiller Africa Holdings II Limited United Kingdom £1.00 Ordinary
SABMiller Africa Holdings Limited United Kingdom £1.00 Ordinary
SABMiller Africa Investments Limited United Kingdom £1.00 Ordinary
SABMiller America Holdings Limited United Kingdom US$1.00 US$ Ordinary
US$1,000.00 US$ Redeemable
C Preference
ZAR10.8808 ZAR Ordinary
ZAR10,880.80 ZAR
Redeemable C Preference
SABMiller America Investments LLC USA US$1.00 Common
US$1,000.00 Series C
Redeemable Preferred
SABMiller Americas Holdings LLC USA US$1.00 Class A
US$1.00 Class C
US$1,000.00 Series C
Redeemable Preferred Stock
SABMiller Angola 1 Mauritius US$1.00 Ordinary
SABMiller Angola 2 Mauritius US$1.00 Ordinary
SABMiller Asia B.V. Netherlands €1.00 Ordinary
SABMiller Asia Holdings Limited United Kingdom US$1.00 Ordinary
SABMiller Asia Limited Hong Kong HKD1.00 Ordinary
SABMiller Australia Beverage Holdings
LLP
United Kingdom US$1.00 Ordinary
SABMiller Australia Holdings Limited United Kingdom US$1.00 Ordinary
US$1,000.00 Redeemable C
Preference
186 SABMiller plc Annual Report 2016
Name of undertaking
Country
of incorporation Share class
SABMiller Australia Investment
Holdings Pty Ltd
Australia AUD1.00 Ordinary
SABMiller Australia Pty Limited Australia AUD Ordinary–No par value
SABMiller Beverage Investments Pty
Limited
Australia AUD Ordinary–No par value
SABMiller Brands Europe a.s. Czech Republic CZK5.00 Ordinary
SABMiller Brasil Marketing Ltda. Brazil Quotas
BRL1.00 Ordinary
SABMiller Breweries Private Limited India INR10.00 Ordinary
INR10.00 Preference
SABMiller Capital AU Pty Limited Australia AUD Ordinary–No par value
SABMiller Corporate Services Limited United Kingdom US$1.00 Ordinary
SABMiller Europe AG Switzerland CHF1,000.00 Ordinary
SABMiller Europe B.V. Netherlands €1.00 Ordinary
SABMiller Europe Menedzsment
Szolgaltato Kft
Hungary HUF1.00 Share capital
SABMiller Finance (HK) Limited Hong Kong US$1.00 Ordinary
SABMiller Finance B.V. Netherlands €10.00 Ordinary
SABMiller Finance Holdings (HK)
Limited
Hong Kong US$1.00 Ordinary
SABMiller Finance SA Limited United Kingdom US$1.00 Ordinary
SABMiller Financing Southern LLP United Kingdom US$1.00 Ordinary
SABMiller Global Business Services
Colombia S A S
Colombia COP10,000,000.00 Ordinary
SABMiller Global Business Services
India Holdings B.V.
Netherlands €1.00 Ordinary
SABMiller Global Business Services
India Private Limited
India INR10.00 Ordinary
SABMiller Global Business Services
Limited
United Kingdom US$1.00 Ordinary
SABMiller Global Business Services
Poland sp.z.o.o.
Poland PLN5,000.00 Ordinary
SABMiller Harmony Holdings Limited United Kingdom £0.01 A ordinary
£0.01 B ordinary
SABMiller Harmony Limited United Kingdom £0.01 B ordinary
SABMiller Holdings Inc. USA US$0.01 Common
US$1,000.00 Series A
Redeemable Preferred
SABMiller Holdings SA Limited United Kingdom US$1.00 Ordinary
SABMiller Holdings SH Limited United Kingdom US$0.333,333,333,333,333
Ordinary
SABMiller India Holdings Mauritius US$1.00 Non-cumulative
redeemable preference
US$1.00 Ordinary
US$1.00 Senior non-cumulative
redeemable preference
SABMiller International B.V. Netherlands €1.00 Ordinary
SABMiller International Brands Limited United Kingdom US$1.00 Ordinary
SABMiller Investments Pty Ltd Australia AUD1.00 Ordinary
SABMiller Latin America Inc. USA US$1.00 Common Stock
SABMiller Latin Inc. USA US$1.00 Common stock
US$1,000.00 Series A
Redeemable Preferred Stock
US$1,000.00 Series C
Redeemable Preferred Stock
SABMiller Management (IN) B.V. Netherlands €1.00 Ordinary
SABMiller Management Africa Limited Guernsey £1.00 Ordinary
SABMiller Management Limited Guernsey £1.00 Ordinary
SABMiller Namibia (Pty) Limited Namibia NAD1.00 Ordinary
SABMiller Netherlands B.V. Netherlands €1.00 Ordinary
Name of undertaking
Country
of incorporation Share class
SABMiller Netherlands Cooperatieve
W.A.
Netherlands Members interest
SABMiller Poland B.V. Netherlands €1.00 Ordinary
SABMiller Procurement GmbH Switzerland CHF100.00 Ordinary
SABMiller Procurement s.r.o. Czech Republic Share capital
SABMiller S.r.l. Italy €1.00 Share capital
SABMiller SAF Limited United Kingdom US$1.00 Ordinary
SABMiller SI Limited United Kingdom US$1.00 A ordinary
US$1.00 B ordinary
US$1,000.00 Redeemable C
Preference
SABMiller SI2 Limited United Kingdom US$1.00 A ordinary
US$0.000,002,234,636,872 B
ordinary
SABMiller Sourcing Limited United Kingdom US$1.00 Ordinary
SABMiller Southern Capital Financing
LLC
USA US$1.00 Common shares
SABMiller Southern Capital Limited United Kingdom US$1.00 A ordinary
US$0.000,002,234,636,872 B
ordinary
US$0.000,000,131,163,281
Redeemable A Preference
US$0.000,000,085,518,400
Redeemable C Preference
SABMiller Southern Investments
Limited
United Kingdom US$0.000,000,248,385,433 A
ordinary
US$0.000,002,234,636,872 B
ordinary
US$0.000,000,075,518,400
Redeemable C Preference
SABMiller Vietnam Company Limited Vietnam US$ Charter capital
SABMiller Vietnam Distribution
Company Limited
Vietnam US$ Charter capital
SABSA Holdings Ltd South Africa ZAR1.00 Ordinary
Sabsure Limited South Africa ZAR1.00 A ordinary
ZAR1.00 Ordinary
Silvester Brothers (AMH) Pty. Limited Australia AUD1.00 A Class
SKOL Beer Manufacturing Company
Limited
India INR10.00 Ordinary
INR10.00 Preference
Somar Pty Ltd Australia AUD1.00 Ordinary
South African Breweries International
Holdings Inc.
British Virgin Islands US$1.00 Ordinary
SPR Distilleries Private Limited India INR10.00 Ordinary
The Continental Spirits Company Pty
Ltd
Australia 1.00 Ordinary
The Delphic Insurance Company
Limited
Guernsey US$1.00 Ordinary
The Wine Exchange Limited United Kingdom £1.00 Ordinary
Tibsco Limited United Kingdom £0.25 Ordinary
Tres Montañas S.A. de C.V. El Salvador US$1.00 Ordinary
Trinity Park Inc. USA AUD0.01 Common stock
Tyskie Sp. z o.o. Poland PLN50.00 Ordinary
Tyskie Sp. z.o.o. sp. k. Poland Partnership interest
UBH (Ukrainian Brewery Holding)
Limited (in liquidation)
Cyprus US$1.00 Ordinary
Voskane Pty Ltd Australia 1.00 Ordinary
Windemere Securities Limited Turks and Caicos
Islands
USD1.00 Ordinary
USD1.00 Preference
Zythos Insurance Company Pte.
Limited
Singapore AUD1.00 Ordinary
US$1.00 Ordinary
(a) Indirect wholly owned subsidiaries continued
(b) Subsidiaries where the effective interest is less than 100%
Name of undertaking
Country of
incorporation
Effective %
interest Share class
% of share class held
by group companies
ABI Bottling (Proprietary) Ltd South Africa 92 ZAR1.00 ordinary 100
Accra Brewery Limited1
Ghana 60 GHS1.00 Ordinary 96
Alliance Beverages (Pty) Ltd1
South Africa 62 ZAR Ordinary–No par value 100
Ambo International Holdings Ltd Mauritius 60 US$1.00 Ordinary 75
Ambo Mineral Water Share Company1
Ethiopia 40 ETB1,000.00 Ordinary 67
Appletiser Pure Fruit Juices (Pty) Limited South Africa 92 ZAR1.00 Ordinary 100
Appletiser South Africa (Pty) Limited South Africa 92 ZAR2.00 Ordinary 100
Aqua Service Mayotte SA1
Mayotte 50 €15.00 Ordinary 100
Azucarera del Norte S.A. de C.V. Honduras 99 HNL10.00 Ordinary 100
Bananeras Amelia S.A. de C.V. Honduras 99 HNL10.00 Ordinary 100
Bavaria S.A. Colombia 99 COP2.50 Ordinary 99
Beverage Management Solutions Limited Nigeria 50 NGN1.00 Ordinary 100
Brauhaase International Management GmbH1
Germany 50 €1,982,100.00 Ordinary 100
Browning Investments N.V. Curaçao 62 US$1.00 Ordinary 100
US$1.00 Preference shares 100
Canbrew B.V. Netherlands 71 €0.4537802 Ordinary 71
C.A.P.T.S. Beverages Share Company Ethiopia 60 ETB100.00 Ordinary 100
CAPTS Beverages Holdings1
Mauritius 60 US$1.00 Ordinary 75
Castle Brewing Namibia (Pty) Limited Namibia 92 NAD1.00 Ordinary 100
Cervecería del Valle S.A. Colombia 99 COP1,000.00 Ordinary 100
Cervejas de Moçambique SA1, 5
Moçambique 49 MZN2.00 Ordinary 80
Cervecería Hondureña S.A de C.V. Honduras 99 HNL100.00 Ordinary 99
187SABMiller plc Annual Report 2016
FINANCIALSTATEMENTS
FINANCIAL STATEMENTS
Related Undertakings continued
Name of undertaking
Country of
incorporation
Effective %
interest Share class
% of share class held
by group companies
Cervecería Nacional CN S.A.5
Ecuador 96 US$1.00 Ordinary 96
Cervecería Nacional S.A.5
Panama 97 Ordinary–No par value 98
Cervecería San Juan S.A.5
Peru 92 PEN1.00 Investment 67
PEN1.00 Ordinary 96
Cerveceria Union S.A. Colombia 98 COP0.57 Ordinary 99
Chantries Limited Kenya 80 KES10.00 Ordinary 100
Chibuku Products Limited1
Malawi 31 MWK1.00 Ordinary 50
Club Sporting Cristal S.A. Peru 94 PEN100.00 Ordinary 100
Coleus Packaging (Pty) Limited South Africa 55 ZAR0.001 Ordinary 60
Comco Societe Anonyme1
Comoros 42 KMF10,162.00 Ordinary 84
Comercializadora Cervecera S.A. de C.V. Honduras 99 HNL100.00 Ordinary 100
Compañía Cervecera de Canarias, S.A. Spain 51 €6.0101 Ordinary 71
Compañia Cerveceria S.A. de C.V. Honduras 99 HNL100.00 Ordinary 100
Compañia de Credito S.A. de C.V. Honduras 99 HNL100.00 Ordinary 100
Copperbelt Bottling Company Ltd Zambia 54 ZMK Ordinary 100
Crown Beverages Limited Kenya 80 KES100.00 Ordinary 100
Darbrew Limited1
Tanzania 21 TZS20.00 Ordinary 60
DINADEC S.A. Ecuador 99 US$1.00 Ordinary 100
Distribuidora Comercial S.A. Panama 97 US$20.00 Ordinary 99
Distribuidora Coronel Portillo S.A.C. Peru 99 PEN1.00 Ordinary 100
Dreher Sörgyárak Zrt. Hungary 99 HUF6,500.00 Ordinary 99
Dwarsloop Beer Wholesalers (Pty) Limited South Africa 92 ZAR1.00 Ordinary 100
Envases Industriales Hondurenos S.A. Honduras 99 HNL100.00 Ordinary 100
Export Compliance Services (Pty) Ltd South Africa 62 ZAR Ordinary 100
Heinrich’s Syndicate Limited Zambia 62 ZMK0.50 Ordinary 100
Impresora del Sur S.A. Colombia 99 COP1,000.00 Ordinary 100
Industria Grafica Latinoamerica S.A. Colombia 99 COP1,000.00 Ordinary 100
Inmobiliaria IDE S.A. Peru 94 PEN1.00 Common 100
PEN1.00 Investment 35
Intafact Beverages Limited1
Nigeria 38 NGN Ordinary 75
International Breweries PLC1, 5
Nigeria 36 NGN50.00 Ordinary 72
International Breweries (Agro-Allied) Limited1
Nigeria 36 NGN Ordinary–No par value 100
Inversiones Hondureñas S.A. de C.V. Honduras 99 HNL100.00 Ordinary 100
Inversiones Malteria Tropical S.A. Colombia 99 COP1,000.00 Ordinary 100
Inversiones Nixa S.A. Colombia 51 COP2.00 Ordinary 51
Kenbev Limited Kenya 80 KES100.00 Ordinary 100
KES100.00 Preference 100
Kgalagadi Breweries (Proprietary) Limited1, 2
Botswana 31 BWP1.00 B ordinary 100
Kibo Breweries Ltd1
Tanzania 36 TZS1.00 Ordinary 100
Lesotho Liquor Distributors (Proprietary) Ltd1
Lesotho 24 LSL1.00 Ordinary 100
Lesotho Traditional Beverages (Proprietary)Ltd Lesotho 62 LSL1.00 Ordinary 100
Liquid Packaging Limited1
Zambia 43 ZMK1.00 Ordinary 100
Logísitca Integral Hondureña, S. A. Honduras 99 HNL100.00 Ordinary 100
Maheu Number One Limited Zambia 62 ZMW0.001 Ordinary
Malawi Breweries Limited Malawi 62 MWK2.00 Ordinary 100
Malawi Traditional Beverages Ltd Malawi 62 MWK2.00 Ordinary 100
Malteria Tropical S.A. Colombia 99 COP1,000.00 Ordinary 100
Maluti Mountain Brewery (Pty) Ltd1
Lesotho 24 LSL1.00 Ordinary 39
Mayco Societe Anonyme1
Mayotte 50 €0.16 Ordinary 100
Namanve Property Company Limited1
Uganda 39 UGX2,000.00 Ordinary 49
National Breweries plc1, 5
Zambia 43 ZMK0.01 Ordinary 70
Naviera Oriente S.A.C. Peru 94 PEN1.00 Ordinary 100
New Age Beverages (Pty) Limited South Africa 92 ZAR0.01 Ordinary 100
Nile Breweries Ltd Uganda 62 UGX10.00 Ordinary 99
Osiris Industries Limited Ghana 80 Ordinary–No par value 100
Other Beverage Interests (Proprietary) Limited South Africa 92 ZAR1.00 Ordinary 100
Overseas Breweries Limited Switzerland 62 CHF20.00 Ordinary 100
Pabod Breweries Limited1
Nigeria 41 NGN1.00 Ordinary 82
Plásticos Industriales Hondureños, S. A. de C. V. Honduras 99 HNL100.00 Ordinary 100
Racetrack Peru S.r.l. Peru 99 PEN1.00 Ordinary 100
Rainier Inc.1
Cayman Islands 62 US$1.00 Ordinary 100
Rombas Trans International Srl Romania 98 RON160.00 Ordinary 100
Rwenzori Bottling Company Uganda 80 UGX Ordinary 100
S.C. Andip Distribution S.R.L. Romania 99 RON10.00 Ordinary 100
S.C. Ursus Consulting S.R.L. Romania 99 RON10.00 Ordinary 100
SABMiller Africa B.V. Netherlands 62 €1.00 A ordinary 100
€1.00 D Preference 100
SABMiller Botswana B.V. Netherlands 62 €1.00 A ordinary 100
SABMiller Brands Korea Republic of Korea 75 KRW100,000.00 Ordinary 75
SABMiller India Limited India 99 INR10.00 Ordinary 99
SABMiller Investments II B.V. Netherlands 80 €1.00 Ordinary 80
SABMiller Investments Ltd Mauritius 80 US$1.00 Ordinary 80
SABMiller NAB Korea Republic of Korea 75 KRW100,000.00 Ordinary 100
SABMiller Nigeria Holdings B.V.1
Netherlands 50 €1.00 Ordinary 50
SABMiller Zimbabwe B.V. Netherlands 62 €1.00 Ordinary 100
San Ignacio S.A. Peru 99 PEN1.00 Ordinary 100
Siembra de Caña S.A. de C.V. Honduras 99 HNL50.00 Ordinary 100
Sociedad Portuaria Bavaria S.A. Colombia 99 COP1,000.00 Ordinary 100
Societa’ per Azioni Produzione Lavorazione Orzo–S.A.P.L.O Italy 90 €0.65 Ordinary 90
South African Barley Breeding Institute South Africa 92 Non profit company 100
Southern Sudan Beverages Ltd South Sudan 80 US$10.00 Ordinary 100
Strategic Alliance JV1
Mauritius 50 US$1.00 Ordinary 50
Swaziland Beverages Limited1
Swaziland 37 SZL1.00 Ordinary 60
Tanzania Breweries Limited1, 5
Tanzania 36 TZS100.00 Ordinary 57
Tanzania Distilleries Limited1
Tanzania 23 TZS20.00 Ordinary 65
The South African Breweries Centenary Company South Africa 92 Non profit company 100
The South African Breweries (Pty) Ltd South Africa 92 ZAR0.000001 Ordinary 92
The South African Breweries Barley Farm (Pty) Limited South Africa 92 ZAR1.00 Ordinary 100
The South African Breweries Hop Farms (Pty) Limited South Africa 92 ZAR2.00 Ordinary 100
(b) Subsidiaries where the effective interest is less than 100% continued
188 SABMiller plc Annual Report 2016
Name of undertaking
Country of
incorporation
Effective %
interest Share class
% of share class held
by group companies
The South African Breweries Maltings (Pty) Limited South Africa 92 ZAR1.00 Ordinary 100
Thohoyandou Beer Distributors (Pty) Limited South Africa 54 ZAR1.00 Ordinary 59
Transportes 77 S.A. Peru 94 PEN1.00 Ordinary 100
Transportes TEV S.A. Colombia 99 COP500,000.00 Ordinary 100
Unión de Cervecerias Peruanas Backus y Johnston S.A.A.5
Peru 94 PEN10.00 A ordinary
PEN10.00 B preference
PEN1.00 Investment
99
13
89
Ursus Breweries S.A. Romania 99 RON5.90 Ordinary 99
Voltic (GH) Limited Ghana 80 Ordinary 100
Voltic International Inc. British Virgin Islands 80 US$1.00 Ordinary 100
Voltic Holdings B.V.1
Netherlands 50 US$1.00 Ordinary 100
Voltic Nigeria Ltd1
Nigeria 50 NGN1.00 Ordinary 100
V-Pet (GH) Limited1
) Ghana 56 Ordinary 70
Westonaria Beer Distributors (Pty) Limited South Africa 41 ZAR1.00 Ordinary 45
Zambian Breweries plc5
Zambia 54 ZMK0.01 Ordinary 87
(c) Joint ventures
Name
Principal place
of business address
Effective %
interest Share class
% of share class held
by group companies
MillerCoors LLC4, 6
250 S Wacker Dr, Chicago, 58 US$0.001 A ordinary 50
IL 60606, USA US$0.001 B ordinary 100
(d) Associates
Name
Country of
incorporation
Effective %
interest Share class
% of share class held
by group companies
Ale Property B.V. Netherlands 25 €1.00 Ordinary 25
Algerienne de Bavaroise Spa6, 7
Algeria 40 DZD1,000.00 Ordinary 40
Anadolu Efes Biracılık ve Malt Sanayii A.5, 6
Turkey 24 TRL1.00 Common 24
Associated Fruit Processors (Pty) Limited South Africa 46 ZAR1.00 Ordinary 50
B.I.H. Brasseries Internationales Holding (Angola) Limited6
Gibraltar 27 €500.00 Class A Preference 100
€500.00 Ordinary 27
B.I.H. Brasseries Internationales Holding Limited6
Gibraltar 20 €1,000.00 Ordinary 20
€1,000.00 R Tracker 100
China Resources Snow Breweries Limited6
British Virgin Islands 49 US$1.00 Ordinary 49
Coca-Cola Canners of Southern Africa (Pty) Limited6
South Africa 29 ZAR1.00 Ordinary 32
Cooperatieve Inkoop Slijterij Ondernemingen U.A. Netherlands 45 €100.00 B ordinary 100
Delta Corporation Limited5, 8
Zimbabwe 25 US$0.01 Ordinary 40
Distell Group Limited5, 9
South Africa 25 ZAR0.01 Ordinary 27
Drankenorganisatie Nederland “D.O.N.” B.V. Netherlands 35 €45.378 Ordinary 35
Ensemble Vastgoed B.V. Netherlands 50 €1,000.00 Ordinary 50
Grolsch (UK) Limited United Kingdom 50 £1.00 Ordinary 51
Heisterkamp-Grolsch Real Estate B.V. Netherlands 50 €1.00 Ordinary 50
Heisterkamp-Grolsch Vastgoed B.V. Netherlands 50 €1.00 Participations A 100
Henk Smit Amsterdam B.V. Netherlands 35 €100.00 Ordinary 35
International Trade & Supply Limited6
British Virgin Islands 40 US$1.00 Ordinary 40
Marocaine d’Investissements et de Services SA5, 6, 10
Morocco 40 MAD100 Ordinary 100
Skikda Bottling Company S.A.R.L.6, 7
Algeria 40 DZD10,000.00 Ordinary 100
Société de Boissons de l’Ouest Algerien S.A.R.L.6, 7
Algeria 40 DZD1,000.00 Ordinary 100
Société Des Brasseries et Glacières Internationales S.A.6
France 20 €15.24 Ordinary 20
Société des Nouvelles Brasseries6, 7
Algeria 40 DZD1,000.00 Ordinary 100
Van Erp Dranken B.V. Netherlands 35 €1.00 Participations B 100
Výzkumný ústav Pivovarský a Slada ský, a.s. Czech Republic 22 CZK1,000.00 bearer 22
Notes
1
The operations continue to be consolidated due to the group’s ability to control the operations.
2
SABMiller Botswana BV holds a 40% interest in Kgalagadi Breweries (Pty) Ltd with the remaining 60% interest held by Sechaba Brewery Holdings Ltd. SABMiller Botswana’s shares entitle the
holder to twice the voting rights of those shares held by Sechaba Brewery Holdings Ltd. SABMiller Africa BV’s 10.1% indirect interest is held via a 16.8% interest in Sechaba Brewery Holdings Ltd.
3
SABMiller Africa BV holds a 39% interest in Maluti with the remaining interest held by a government authority, the Lesotho National Development Corporation (51%), the Privatisation Unit
(5.25%), and the Lesotho Unit Trust (4.75%). Maluti is treated as a subsidiary undertaking based on the group’s ability to control its operations through its board representation. The day to day
business operations are managed in accordance with a management agreement with a group company.
4
SABMiller shares joint control of MillerCoors with Molson Coors Brewing Company under a shareholders’ agreement. Voting interests are shared equally between SABMiller and Molson
Coors, and each of SABMiller and Molson Coors has equal board representation. Under the agreement SABMiller has a 58% economic interest in MillerCoors and Molson Coors has a 42%
economic interest.
5
Listed in country of incorporation.
6
These entities report their financial results for each 12-month period ending 31 December.
7
Effective 18 March 2004, SABMiller acquired 25% of the Castel group’s holding in these entities. Together with its 20% interest in the Castel group’s Africa beverage interests, this gives
SABMiller participation on a 40:60 basis with the Castel group.
8
Interests in this company are held by SABMiller Africa BV which is held 62% by SABMiller Holdings Ltd.
9
This entity reports its financial results for each 12-month period ending 30 June.
10
SABMiller acquired a 25% direct interest in this holding company on 18 March 2004 which has controlling interests in three breweries, a malting plant and a wet depot in Morocco. This 25%
interest, together with its 20% interest in the Castel group’s African beverage interests, gives SABMiller an effective participation of 40% and the other 60% is held by the Castel group’s Africa
beverage interests.
(b) Subsidiaries where the effective interest is less than 100% continued
189SABMiller plc Annual Report 2016
FINANCIALSTATEMENTS
FINANCIAL STATEMENTS
Five-year financial review
for the years ended 31 March
2016
US$m
2015
US$m
2014
US$m
2013
US$m
2012
US$m
Income statements
Group NPR 24,149 26,288 26,719 26,932 24,949
Revenue 19,833 22,130 22,311 23,213 21,760
Operating profit 3,454 4,384 4,242 4,192 5,013
Net finance costs (506) (637) (645) (726) (562)
Share of post-tax results of associates and joint ventures 1,126 1,083 1,226 1,213 1,152
Taxation (1,152) (1,273) (1,173) (1,192) (1,126)
Non-controlling interests (223) (258) (269) (237) (256)
Profit for the year attributable to owners of the parent 2,699 3,299 3,381 3,250 4,221
Adjusted earnings 3,604 3,835 3,865 3,772 3,400
Adjusted EBITDA 6,114 6,677 6,656 6,564 n/a
Balance sheets
Non-current assets 39,084 40,552 48,366 50,588 50,998
Current assets 4,505 4,359 5,385 5,683 4,851
Assets of disposal group classified as held for sale – – – 23 79
Total assets 43,589 44,911 53,751 56,294 55,928
Derivative financial instruments (239) (111) (115) (86) (109)
Borrowings (11,740) (12,544) (17,047) (18,548) (19,226)
Other liabilities and provisions (7,522) (7,901) (9,107) (10,199) (10,554)
Liabilities of disposal group classified as held for sale – – – (1) (7)
Total liabilities (19,501) (20,556) (26,269) (28,834) (29,896)
Net assets 24,088 24,355 27,482 27,460 26,032
Total shareholders’ equity 22,892 23,172 26,319 26,372 25,073
Non-controlling interests in equity 1,196 1,183 1,163 1,088 959
Total equity 24,088 24,355 27,482 27,460 26,032
Cash flow statements
Net cash generated from operations before working capital movements 5,055 5,680 5,677 5,758 4,979
Net working capital movements 61 132 93 (204) 258
Net cash generated from operations 5,116 5,812 5,770 5,554 5,237
Net interest paid (386) (651) (743) (770) (407)
Tax paid (1,315) (1,439) (1,596) (683) (893)
Net cash inflow from operating activities 3,415 3,722 3,431 4,101 3,937
Net capital expenditure and other investments (1,239) (1,503) (1,416) (1,440) (1,522)
Net investments in subsidiaries, joint ventures and associates (496) 755 (338) (223) (11,095)
Dividends received from joint ventures, associates and other investments 1,251 1,407 1,128 1,000 1,017
Net cash inflow before financing and dividends 2,931 4,381 2,805 3,438 (7,663)
Net cash outflow from financing (435) (3,677) (1,195) (517) 8,819
Dividends paid to shareholders of the parent (1,860) (1,705) (1,640) (1,517) (1,324)
Effect of exchange rates (115) (117) (61) (51) (39)
Increase/(decrease) in cash and cash equivalents 521 (1,118) (91) 1,353 (207)
Per share information (US cents per share)
Basic earnings per share 167.8 205.7 211.8 204.3 266.6
Diluted earnings per share 166.0 203.5 209.1 202.0 263.8
Adjusted basic earnings per share 224.1 239.1 242.0 237.2 214.8
Total number of shares in issue (millions) 1,679.6 1,675.7 1,672.6 1,669.7 1,664.3
Other operating and financial statistics
Return on equity (%)1
15.7 16.6 14.7 14.3 13.6
EBITA margin (as a percentage of group NPR) 24.1 24.2 24.2 23.7 n/a
Adjusted EBITDA margin (as a percentage of relevant NPR) 31.5 31.7 31.4 30.0 n/a
Net debt: adjusted EBITDA 1.6 1.6 2.1 2.4 n/a
Interest cover (times) 13.8 10.7 10.3 8.9 n/a
Free cash flow (US$m) 2,969 3,233 2,563 3,230 3,048
Gearing ratio (%) 40.0 43.0 52.0 56.8 68.4
Average monthly number of employees 70,089 68,808 69,947 70,486 71,144
1
This is calculated by expressing adjusted earnings as a percentage of total shareholders’ equity.
190 SABMiller plc Annual Report 2016
2016
US$m
2015
US$m
2014
US$m
2013
US$m
2012
US$m
Group NPR
Segmental analysis
Latin America 5,211 5,768 5,745 5,802 5,315
Africa 6,781 7,462 7,421 7,765 7,834
Asia Pacific 3,650 3,867 3,944 4,005 2,600
Europe 3,832 4,398 4,574 4,300 4,235
North America 4,675 4,682 4,665 4,656 4,544
Retained operations 24,149 26,177 26,349 26,528 24,528
South Africa: Hotels and Gaming – 111 370 404 421
24,149 26,288 26,719 26,932 24,949
Operating profit (excluding share of associates and joint ventures)
Segmental analysis
Latin America 1,873 2,110 2,069 1,983 1,736
Africa 1,312 1,471 1,478 1,491 1,513
Asia Pacific 434 438 468 461 124
Europe 511 548 576 652 804
North America (9) 14 9 7 –
Corporate (111) (122) (161) (202) (190)
Operating profit – before exceptional items 4,010 4,459 4,439 4,392 3,987
Exceptional credit/(charge)
Latin America – – 47 (63) (119)
Africa (389) 45 (8) 57 121
Asia Pacific 29 (452) (103) (104) (70)
Europe – – (11) (64) 1,135
North America – – – – –
Corporate (196) (69) (122) (26) (41)
Retained operations (556) (476) (197) (200) 1,026
South Africa: Hotels and Gaming – 401 – – –
Operating profit – after exceptional items 3,454 4,384 4,242 4,192 5,013
EBITA
Segmental analysis
Latin America 1,959 2,224 2,192 2,112 1,865
Africa 1,708 1,907 1,954 1,957 1,911
Asia Pacific 753 768 845 854 321
Europe 636 700 703 784 836
North America 865 858 804 740 756
Corporate (111) (122) (161) (202) (190)
Retained operations 5,810 6,335 6,337 6,245 5,499
South Africa: Hotels and Gaming – 32 123 134 135
5,810 6,367 6,460 6,379 5,634
191SABMiller plc Annual Report 2016
FINANCIALSTATEMENTS
FINANCIAL STATEMENTS
Definitions
Financial definitions
Adjusted earnings
Adjusted earnings are calculated by adjusting headline earnings (as
defined below) for the amortisation of intangible assets (excluding
computer software), exceptional integration and restructuring costs,
and other items which have been treated as exceptional but not included
above or as headline earnings adjustments together with the group’s
share of associates’ and joint ventures’ adjustments for similar items.
The tax and non-controlling interests in respect of these items are
also adjusted.
Adjusted EBITDA
This comprises operating profit before exceptional items, depreciation
and amortisation, and includes the group’s share of MillerCoors’
operating profit on a similar basis.
Adjusted net finance costs
This comprises net finance costs excluding any exceptional finance
charges or income.
Adjusted profit before tax
This comprises EBITA less adjusted net finance costs and less the
group’s share of associates’ and joint ventures’ net finance costs
on a similar basis.
Constant currency
Constant currency results have been determined by translating the
local currency denominated results for the year ended 31 March
at the exchange rates for the prior year.
EBITA
This comprises operating profit before exceptional items, and
amortisation of intangible assets (excluding computer software) and
includes the group’s share of associates’ and joint ventures’ operating
profit on a similar basis.
EBITA margin (%)
This is calculated by expressing EBITA as a percentage of group net
producer revenue.
EBITDA
This comprises EBITA (as defined above) plus depreciation and
amortisation of computer software, including the group’s share
of associates’ and joint ventures’ depreciation and amortisation
of computer software.
EBITDA margin (%)
This is calculated by expressing EBITDA as a percentage of group net
producer revenue.
Effective tax rate (%)
The effective tax rate is calculated by expressing tax before tax on
exceptional items and on amortisation of intangible assets (excluding
computer software), including the group’s share of associates’ and
joint ventures’ tax on a similar basis, as a percentage of adjusted profit
before tax.
Free cash flow
This comprises net cash generated from operating activities less cash
paid for the purchase of property, plant and equipment, and intangible
assets, net investments in existing associates and joint ventures (in both
cases only where there is no change in the group’s effective ownership
percentage) and dividends paid to non-controlling interests plus cash
received from the sale of property, plant and equipment and intangible
assets and dividends received.
Group revenue
This comprises revenue together with the group’s share of revenue
from associates and joint ventures.
Group net producer revenue (NPR)
This comprises group revenue less excise duties and other similar taxes,
together with the group’s share of excise duties and other similar taxes
from associates and joint ventures.
Headline earnings
Headline earnings are calculated by adjusting profit for the year
attributable to owners of the parent for items in accordance with the
South African Circular 2/2015 entitled ‘Headline Earnings’. Such items
include exceptional impairments of non-current assets and profits or
losses on disposals of non-current assets and their related tax and
non-controlling interests. This also includes the group’s share of
associates’ and joint ventures’ adjustments on a similar basis.
Interest cover
This is the ratio of adjusted EBITDA to adjusted net finance costs.
Net debt
This comprises gross debt (including borrowings, financing derivative
financial instruments, overdrafts and finance leases) net of cash and
cash equivalents (excluding overdrafts).
Organic information
Organic results and volumes exclude the first 12 months’ results and
volumes relating to acquisitions and the last 12 months’ results and
volumes relating to disposals.
Total Shareholder Return (TSR)
TSR is the measure of the returns that a company has provided
for its shareholders, reflecting share price movements and assuming
reinvestment of dividends.
Sales volumes
In the determination and disclosure of sales volumes, the group
aggregates 100% of the volumes of all consolidated subsidiaries and
its equity accounted percentage of all associates’ and joint ventures’
volumes. Contract brewing volumes are excluded from volumes
although revenue from contract brewing is included within group
revenue. Volumes exclude intra-group sales volumes. This measure of
volumes is used for lager volumes, soft drinks volumes, other alcoholic
beverage volumes and beverage volumes and is used in the segmental
analyses as it more closely aligns with the consolidated group net
producer revenue and EBITA disclosures.
KPI definitions – how we measure
Total shareholder return (TSR) in excess of the median of peer
group over five-year periods
TSR performance is measured by taking the percentage growth in
our TSR over the five-year period to the date aligned with the related
measurement date of value share (2014: performance share) awards
for the excom, and deducting the percentage growth in the TSR of the
median of our peer group over the same period.
Growth in adjusted earnings per share (EPS)
Growth in adjusted EPS is measured by comparing the adjusted EPS
for the year with that of the prior year. Adjusted EPS is measured using
adjusted earnings divided by the basic number of shares in issue.
Adjusted earnings are measured using the definition above.
Growth in adjusted earnings per share (EPS) (constant currency)
Growth in adjusted EPS compared with the prior year is measured on
a constant currency basis (as defined above). Adjusted EPS is measured
using adjusted earnings divided by the basic number of shares in issue.
Adjusted earnings are measured using the definition above.
Free cash flow
Free cash flow is measured using the definition above.
192 SABMiller plc Annual Report 2016
Proportion of our total lager volume from markets in which we
have no. 1 or no. 2 national market share positions
Lager volumes generated in markets where we have a number one or
number two national beer market share position divided by total lager
volumes. Lager volumes are measured as defined on page 192.
Proportion of group EBITA from developing economies
EBITA generated in developing economies divided by group EBITA
before corporate costs. EBITA is defined on page 192. Developing
economies are as defined by the International Monetary Fund (IMF).
Organic growth in total beverage volumes
Organic growth in total beverage volumes is measured by comparing
total beverage volumes in the year with those in the prior year excluding
the effects of acquisitions and disposals (organic information is defined
on page 192). Total beverage volumes are measured as defined on
page 192.
Group net producer revenue growth (organic, constant currency)
Growth in group net producer revenue compared with the prior year is
measured on a constant currency basis (as defined on page 192) and
excluding the effects of acquisitions and disposals (organic information
is defined on page 192). Group net producer revenue is defined on
page 192.
Net producer revenue growth in premium brands (constant
currency)
Growth in subsidiary net producer revenue from sales of premium
brands compared with the prior year is measured on a constant
currency basis (as defined on page 192). Premium brands are those
in the premium segment as defined below.
EBITA growth (organic, constant currency)
EBITA growth compared with the prior year is measured on a constant
currency basis (as defined on page 192) and excluding the effects of
acquisitions and disposals (organic information is defined on page 192).
EBITA is defined on page 192.
EBITA margin progression (organic, constant currency)
Progression in EBITA margin compared with the prior year is measured
on a constant currency basis (as defined on page 192) and excluding the
effects of acquisitions and disposals (organic information is defined on
page 192). EBITA margin is defined on page 192.
Hectolitres of water used at our breweries per hl of lager
produced
Water used at our breweries divided by the volume of lager produced.
All consolidated subsidiaries are included on a 100% basis together with
our equity accounted percentage share of the MillerCoors joint venture.
Fossil fuel emissions from energy used at our breweries per hl
of lager produced
Fossil fuel emissions are measured by the total amount of carbon
dioxide (CO2e) in kilograms released to the atmosphere by our brewery
operations divided by the volume of lager produced. The total amount of
CO2e is the sum of direct emissions produced by the combustion of fuel
(e.g. coal, oil, gas) and indirect emissions from the use of electricity and
steam. Emissions are calculated using the internationally recognised
WRI/WBCSD Greenhouse Gas Protocol. All consolidated businesses
are included on a 100% basis together with our equity accounted
percentage share of the MillerCoors joint venture.
Cumulative financial benefits from our cost and efficiency
programme
Cumulative annual cost savings as a result of the roll out of global
business services organisation and the expansion of the scope of our
supply chain activities.
Non-financial definitions
AB InBev
Anheuser-Busch InBev SA/NV
Altria
Altria Group, Inc our largest shareholder.
BevCo Ltd
A holding company of the Santo Domingo Group, our second largest
shareholder.
Corporate Governance Code
The UK Corporate Governance Code, as adopted by the Financial
Reporting Council.
Direct economic value generated
Revenue plus interest and dividend receipts, royalty income, and
proceeds of sales of assets (in accordance with guidance by the Global
Reporting Initiative GRI EC1).
Economy segment
Taking the leading brand in the most popular pack type as the standard
(=100), brands with a weighted average market price which fall below an
index of 90 form the economy segment. Normally, all brands in this
segment will be local brands.
Global brands
SABMiller’s global brands are Peroni Nastro Azzurro, Miller Genuine
Draft, Miller Lite, Pilsner Urquell and Grolsch. Their volumes and NPR
are measured on a subsidiary basis, excluding home markets.
Like-for-like definition in China
The like-for-like comparison in China is on a constant currency and
underlying basis consistent with the prior year, excluding the
reclassification undertaken by our associate, CR Snow.
Mainstream segment
Taking the leading brand in the most popular pack type as the standard
(=100), the mainstream segment is formed of brands with a weighted
average market price which fall into the 90-109 band. Mainstream brands
tend to be local.
PET
PET is short for polyethylene terephthalate, a form of plastic which is
used for bottling alcoholic and non-alcoholic drinks.
PwC
PricewaterhouseCoopers LLP, our external auditors.
Premium segment
Taking the leading brands in the most popular pack type as the standard
(=100), brands with a weighted average market price which have an
index of 110+ form the premium segment. The premium segment
comprises local, regional and global brands.
STRATE
South Africa’s Central Securities Depository, which exists to allow share
transactions in South Africa to be settled electronically.
Underlying
Where underlying is used in the description of business performance,
this refers to performance on an organic, constant currency basis.
Organic and constant currency are both defined on page 192.
193SABMiller plc Annual Report 2016
FINANCIALSTATEMENTS
SHAREHOLDER INFORMATION
Ordinary shareholding analyses
Listed below are analyses of holdings extracted from the register of ordinary shareholders at the year end:
Number of
shareholders
Percentage of
share capital
Portfolio size
1 – 1,000 50,552 0.68
1,001 – 10,000 6,127 1.05
10,001 – 100,000 1,662 3.94
100,001 – 1,000,000 750 14.18
1,000,001 and over 170 80.15
59,261 100.00
Category
Banks 10 0.09
Individuals, nominees and trusts 57,063 5.51
Insurance companies 160 3.64
Investment companies 16 0.54
Medical aid schemes 37 0.14
Mutual funds 916 21.45
Other corporate entities 22 39.40
Pension funds 806 11.78
Other 231 17.45
59,261 100.00
Shareholders’ diary1
Financial reporting calendar and annual general meeting
Trading update and annual general meeting July 2016
Announcement of interim results, for the half year to September November 2016
Preliminary announcement of annual results May 2017
Annual report published June 2017
Dividends Declared Paid
Ordinary:
Interim November December
Final May August
1
Should the completion of the transaction with AB InBev not be completed prior to these dates.
Unsolicited investment advice – warning to shareholders
Many companies have become aware that their shareholders have received unsolicited phone calls or correspondence concerning investment
matters. These are typically from overseas-based ‘brokers’ who target UK shareholders offering to sell them what often turn out to be worthless
or high-risk shares in US or UK investments. They can be very persistent and extremely persuasive. It is not just the novice investor that can be
duped in this way; many victims have been successfully investing for several years. Shareholders are advised to be very wary of any unsolicited
advice, offers to buy shares at a discount, sell shares at a premium or requests to complete confidentiality agreements with the callers. It is unlikely
that firms authorised by the Financial Conduct Authority (FCA) would approach shareholders in this manner, so it is advisable to seek out your own
investment opportunities.
If you receive any unsolicited investment advice:
− make sure you get the correct name of the person and organisation.
− check that they are properly authorised by the FCA before getting involved.
You can check at http://www.fca.org.uk/firms/systems-reporting/register/search
the FCA also maintains on its website a list of unauthorised overseas firms who are targeting, or have targeted, UK investors and any approach
from such organisations should be reported to the FCA so that this list can be kept up to date and any other appropriate action can be considered.
− report the matter to the FCA either by calling 0800 111 6768 or by completing an online form at:
http://www.fca.org.uk/consumers/scams/investment-scams. If you deal with an unauthorised firm, you would not be eligible to receive
payment under the Financial Services Compensation Scheme.
− you can find guidance on being a “scamsmart investor” on the FCA website at http://scamsmart.fca.org.uk/
South African shareholders may report such approaches to the Financial Services Board (FSB) on:
Toll free: 0800 110443 or 0800 202087
Email: info@fsb.co.za
194 SABMiller plc Annual Report 2016
Administration
SABMiller plc
Incorporated in England and Wales (Registration No. 3528416)
Group Company Secretary
Stephen Shapiro
Registered office
SABMiller House
Church Street West
Woking
Surrey, England
GU21 6HS
Telephone +44 1483 264000
Head office
One Stanhope Gate
London, England
W1K 1AF
Telephone +44 20 7659 0100
Internet address
www.sabmiller.com
Investor relations
Telephone +44 20 7659 0100
Email: investor.relations@sabmiller.com
Sustainable development
Telephone +44 1483 264134
Email: sustainable.development@sabmiller.com
Independent auditors
PricewaterhouseCoopers LLP
Chartered Accountants and Statutory Auditors
1 Embankment Place
London, England
WC2N 6RH
Telephone +44 20 7583 5000
Registrar (United Kingdom)
Equiniti
Aspect House
Spencer Road
Lancing
West Sussex
BN99 6DA
Telephone 0371 384 2395
Overseas telephone +44 121 415 7047 (outside UK)
www.equiniti.com
www.shareview.co.uk
Registrar (South Africa)
Computershare Investor Services (Proprietary) Limited
70 Marshall Street, Johannesburg
PO Box 61051
Marshalltown 2107
South Africa
Telephone +27 11 370 5000
United States ADR Depositary
JP Morgan Depositary Bank
4 New York Plaza, floor 12
New York, NY 10004
Telephone +1 866 576 2377
Email: adr@jpmorgan.com
195SABMiller plc Annual Report 2016
SHAREHOLDERINFORMATION
SHAREHOLDER INFORMATION
Cautionary statement
This document does not constitute an offer to sell or issue or
the solicitation of an offer to buy or acquire ordinary shares
in the capital of SABMiller plc (the “company”) or any other
securities of the company or its subsidiaries or associates in any
jurisdiction or an inducement to enter into investment activity.
This document is intended to provide information to shareholders.
It should not be relied upon by any other party or for any other purpose.
This document includes ‘forward-looking statements’ with respect to
certain of SABMiller plc’s plans, current goals and expectations relating
to its future financial condition, performance and results. These
statements contain the words “anticipate”, “believe”, “intend”, “estimate”,
“expect” and words of similar meaning. All statements other than
statements of historical facts included in this document, including,
without limitation, those regarding the company’s financial position,
business strategy, plans and objectives of management for future
operations (including development plans and objectives relating to
the company’s products and services) are forward-looking statements.
Such forward-looking statements involve known and unknown risks,
uncertainties and other important factors that could cause the actual
results, performance or achievements of the company to be materially
different from future results, performance or achievements expressed
or implied by such forward-looking statements. Such forward-looking
statements are based on numerous assumptions regarding the
company’s present and future business strategies and the environment
in which the company will operate in the future. These forward-looking
statements speak only as at the date of this document. Factors which
may cause differences between actual results and those expected or
implied by the forward-looking statements include, but are not limited to:
the outcome of the proposed transaction with Anheuser-Busch InBev
SA/NV; material adverse changes in the economic and business
conditions in the markets in which SABMiller operates; increased
competition in the global brewing and beverages industry; changes in
consumer preferences; changes to the regulatory environment; and
fluctuations in foreign currency exchange rates and interest rates.
The company expressly disclaims any obligation or undertaking to
disseminate any updates or revisions to any forward-looking statements
contained herein to reflect any change in the company’s expectations
with regard thereto or any change in events, conditions or circumstances
on which any such statement is based. The past business and financial
performance of SABMiller plc is not to be relied on as an indication of its
future performance.
196 SABMiller plc Annual Report 2016
The paper used in the report contains 75% recycled content, all of
which is sourced from de-inked post-consumer waste. All of the pulp
is bleached using an elemental chlorine free process (ECF).
Printed in the UK by CPI Colour, a CarbonNeutral®
company. Both
manufacturing mill and the printer are registered to the Environmental
Management System ISO14001 and are Forest Stewardship Council®
(FSC®
) chain-of-custody certified.
Designed and produced by
Registered office
SABMiller House
Church Street West
Woking
Surrey
England
GU21 6HS
Telephone +44 1483 264000
www.sabmiller.com

SABMiller Annual Report 2016

  • 1.
  • 2.
    We are inthe beer and soft drinks business. We bring refreshment and sociability to millions of people all over the world who enjoy our drinks. We do business in a way that improves livelihoods and helps build communities. We are passionate about brewing and have a long tradition of craftsmanship in making superb beer from high quality natural ingredients. We are local beer experts. We have more than 200 local beers, from which we have carefully selected and nurtured a range of special regional and global brands. Read about our proud heritage overleaf… Performance highlights Group net producer revenue1 -8%2016: US$24,149m 2015: US$26,288m +5% 2 Revenue3 -10%2016: US$19,833m 2015: US$22,130m +7% 2 +8% 2 EBITA4 -9%2016: US$5,810m 2015: US$6,367m EBITA margin progression -10basis points 2016: 24.1% 2015: 24.2% +60basis points2 Profit before tax -16%2016: US$4,074m 2015: US$4,830m Adjusted EPS5 -6%2016: 224.1 US cents 2015: 239.1 US cents Dividends per share6 +8%2016: 122.0 US cents 2015: 113.0 US cents Water usage (beer)7 -3%2016: 3.2 hl/hl 2015: 3.3 hl/hl Net debt8 -8%2016: US$9,638m 2015: US$10,465m Free cash flow9 -8%2016: US$2,969m 2015: US$3,233m Total shareholder return10 Five-year 115%Peer median: 102% Beverage volumes +2%2016: 331m hectolitres 2015: 324m hectolitres 1 Group net producer revenue (NPR) is defined on page 192 and includes the group’s attributable share of associates’ and joint ventures’ net producer revenue of US$9,254 million (2015: US$9,754 million), but excludes excise duties and other similar taxes. 2 Growth on an organic, constant currency basis. 3 Revenue excludes the group’s attributable share of associates’ and joint ventures’ revenue but includes excise duties and similar taxes. 4 Note 2 to the consolidated financial statements provides a reconciliation of operating profit to EBITA which is defined as operating profit before exceptional items and amortisation of intangible assets (excluding computer software) and includes the group’s share of associates’ and joint ventures’ operating profit, on a similar basis. As described in the finance review, EBITA is used throughout this report. 5 A reconciliation of adjusted earnings to the statutory measure of profit attributable to equity shareholders is provided in note 8 to the consolidated financial statements. 6 The 2016 final dividend is subject to shareholder approval at the annual general meeting. 7 Water usage is defined on page 193. 8 Net debt comprises gross debt (including borrowings, financing derivative financial instruments, overdrafts and finance leases) net of cash and cash equivalents (excluding overdrafts). An analysis of net debt is provided in note 27c to the consolidated financial statements. 9 Note 27b to the consolidated financial statements provides a reconciliation of net cash from operating activities to free cash flow. 10 Total shareholder return (TSR) is shown as the percentage growth in our TSR over the five years to 31 March 2016.
  • 3.
    Our story 1993 SAB acquiresthe Dreher Brewery in Hungary, signalling the beginning of a game-changing decade of mergers and acquisitions. 1977 SAB opens its first Coca-Cola bottling operation in South Africa. 1995 – Nelson Mandela opens SAB’s Centenary Centre in the cultural precinct of Johannesburg. – SAB acquires a majority stake in Poland’s Lech brewery and acquires the Tyskie brewery the following year. 1895 The South African Breweries (SAB) is founded, with its head office in the Castle Brewery. Two years later, SAB becomes the first industrial company to list on the Johannesburg Stock Exchange. Little could Charles Glass have known that his Castle Lager would still be South Africa’s most famous beer 120 years after its launch. 1978 SAB publishes a code of non-discriminatory employment – a first in South Africa. 1979 SAB expands into fruit juices, taking a 49% interest in Appletiser from its Italian founder. Coca-Cola sold control of Appletiser to SAB in 1982. 1994 – SAB enters Tanzania followed by Angola, Mozambique and Zambia. – SAB negotiates joint control with China Resources of the second largest brewer in mainland China – the home today of the world’s largest beer brand, Snow. 1990s SABMiller embarks on rapid international expansion The most local of the global brewers Our business began life 120 years ago in the Johannesburg gold rush when Charles Glass founded the Castle Brewery. Today, we are a global community of beer and beverage experts, producing some of the world’s most recognised global and local beers. At SABMiller we have a proud beer heritage. We’re the original brewmasters; making beers people love by truly understanding local tastes. Our brewing magic turns simple natural ingredients into beers that are part of national identity and culture. That is why we believe the value in beer is local, and why we have built SABMiller as the most local of global brewers. Read more about our history at www.sabmiller.com/about-us/history 1955 SAB acquires its two competitors, Ohlsson’s and Chandlers Union Breweries and streamlines production and distribution within the sector. From this position of strength, SAB was set to enter decades of uninterrupted growth. Brewing and selling beer is where we began in 1895, and beer accounts for the majority of our business today.
  • 4.
    2003 SABMiller makes its first significantinvestment in western Europe, acquiring a majority interest in Italian brewer Birra Peroni. 2007-8 – 2007 – SABMiller acquires Koninklijke Grolsch NV in the Netherlands. – 2008 – SABMiller combines Miller Brewing with the US business of Molson Coors, to create the MillerCoors joint venture. 2005 SABMiller’s next step is to move into Latin America through the acquisition of Colombia’s Bavaria SA, the second largest brewer in the region with leading positions in Colombia, Peru, Ecuador and Panama. 2001 – SAB becomes the first international brewer to enter Central America when it acquires the Honduran brewer Cervecería Hondureña and Industrias La Constancia in El Salvador. – A pan-African association with the Castel group offers the opportunity to invest in promising new African markets and benefit from economies of scale. 2009 SABMiller launches a broad-based black economic empowerment transaction in South Africa, involving an equity issue of 8.45% of The South African Breweries (Pty) Limited. 1999 – First day of trading of SAB shares on the London Stock Exchange: 1 March 1999. List price: 428p Closing price: 447p. Market capitalisation based on list price: £3,261m. – SAB acquires controlling interest in Plze˘nský Prazdroj in the Czech Republic, owner of leading brands Pilsner Urquell, Gambrinus, Kozel and Radegast. 2002 SAB makes its first significant entry into a developed market with the Miller Brewing Company transaction, and changed its  name to SABMiller. Visionary leadership In the early 1990s we set out to become a truly international beverage company, building on a century of brewing expertise. Our foray into international brewing was bold, in that it focused on the rapidly developing economies of central Europe, China and Africa. Where others saw risk, we saw opportunity. And our long experience in South Africa had given us considerable experience in running multicultural operations in developing markets. Our 1993 acquisition of the Dreher brewery in Hungary signalled the start of a journey to become the world’s second biggest brewing company.
  • 5.
    Further information This reportcovers the financial year ended 31 March 2016. It is also available on our website as a downloadable PDF www.sabmiller.com/annualreport2016 For more detailed information about SABMiller please refer to our website www.sabmiller.com/investors Key to further reading: Read more on page referenced Read more online Read more in the referenced report Today We have 70,000 employees working in more than 80 countries. We produce over 200 beers, and every minute of every day, more than 140,000 bottles of SABMiller beer are sold. We also have a growing soft drinks business as one of the world’s largest bottlers of Coca-Cola drinks. The strategic report and directors’ report have been approved for and on behalf of the board of SABMiller plc on 10 June 2016. Alan Clark Chief Executive Contents Strategic report Performance highlights Ifc Business overview 2 Chairman’s statement 4 Chief Executive’s review 6 Our business model 12 Market overview 14 Key performance indicators 15 Principal risks 16 Operations review Latin America 18 Africa 22 Asia Pacific 26 Europe 30 North America 34 Finance review 38 Sustainable development 48 Valuing and supporting our people 52 Governance Board of directors 54 Executive committee 56 Corporate governance 58 Audit committee report 70 Directors’ remuneration report 74 Directors’ report 93 Financial statements Independent auditors’ report to the members of SABMiller plc 98 Consolidated income statement 103 Consolidated statement of comprehensive income 104 Consolidated balance sheet 105 Consolidated cash flow statement 106 Consolidated statement of changes in equity 107 Notes to the consolidated financial statements 108 Balance sheet of SABMiller plc 171 Statement of changes in the company’s equity 172 Notes to the company financial statements 173 Related undertakings 186 Five-year financial review 190 Definitions 192 Shareholder information Ordinary shareholding analyses 194 Shareholders’ diary 194 Administration 195 Cautionary statement 196 2011 SABMiller acquires the Foster’s Group, the leading brewing group in Australia, strengthening its position in the Asia Pacific region. 2014 The Coca-Cola Company, SABMiller plc, and Gutsche Family Investments agree to create Coca-Cola Beverages Africa, the largest Coca-Cola bottler in Africa, accounting for approximately 40% of all Coca-Cola beverage volumes in Africa. 2012 SABMiller and Anadolu Efes form a strategic alliance covering Turkey, Russia, the CIS, Central Asia and the Middle East. 2015 – SABMiller acquires the London-based Meantime Brewing Company, a pioneer in British modern craft beer. – The board of SABMiller reaches agreement on the terms of a recommended offer for the company by Anheuser-Busch InBev SA/NV (AB InBev). STRATEGICREPORTFINANCIALSTATEMENTSGOVERNANCESHAREHOLDERINFORMATION 1SABMiller plc Annual Report 2016
  • 6.
    Business overview North America Wherewe operate Regional office: Chicago, USA MillerCoors is a joint venture with Molson Coors Brewing Company, which was formed in 2008 by bringing together the US and Puerto Rican operations of both groups. What we do – MillerCoors is the second largest brewer in the USA, with 27% of the beer market. – Our wholly-owned Miller Brewing International business is based in Milwaukee, USA and exports and sells our brands to Canada, Brazil and Mexico and throughout the Americas. Read more on page 34 We have a balanced spread of businesses with a significant presence in developing markets 1 Before Corporate costs. 2 On an organic, constant currency basis. 3 Subsidiaries only, excluding home markets, on a constant currency basis. 4 Subsidiaries only, excluding home markets. Our global brands are Peroni Nastro Azzurro, Miller Genuine Draft, Miller Lite, Pilsner Urquell, and Grolsch. +12% +13% NPR premium NPR global brands growth3 . brands growth4 . 70,000 US$5,810m Group EBITA (2015: US$6,367m). 69%The proportion of EBITA from developing markets. Our five shared imperatives are aligned with 12 of the 17 UN Sustainable Development Goals. Latin America 33% US$1,959m Africa 29% US$1,708m Asia Pacific 13% US$753m Europe 11% US$636m North America 14% US$865m EBITA by region1 % 140,000 Every minute of every day, more than 140,000 bottles of SABMiller beer are enjoyed around the world. SABMiller has 70,000 employees and is in more than 80 countries. 94% The proportion of our total lager volume from markets in which we have no 1. or no. 2 national market share positions. 6%Soft drinks volume growth. #1 #2 +1% Group lager volume. 249m hl 8% 2 Subsidiary NPR growth. SABMiller by numbers 2 SABMiller plc Annual Report 2016 STRATEGIC REPORT
  • 7.
    Europe Where we operate Regionaloffice: Zug, Switzerland Our primary brewing operations cover nine countries: the Czech Republic, Hungary, Italy, Poland, Romania, Slovakia, Spain (Canary Islands), the Netherlands, and the UK. Asia Pacific Where we operate Regional office: Hong Kong Our brewing interests across Asia Pacific cover four countries: Australia, China, India, and Vietnam. What we do – CR Snow, our partnership of more than 20 years with China Resources Beer (Holdings) Co Ltd, is the largest brewer in China. – Carlton & United Breweries (CUB) is the second largest Australian brewer. – We are the second largest brewer in India. – We have a brewery in Vietnam, and we export to numerous markets including South Korea. Read more on page 26 What we do – In the majority of these countries we are the number one or two brewer by market share. – We cover a further 16 countries including Russia, Turkey, and Ukraine in a strategic alliance with Anadolu Efes through brewing, soft drinks and export operations. – We export significant volumes to a further six European markets, of which the largest are Germany and France. Read more on page 30 Africa Where we operate Regional office: Johannesburg, South Africa Our primary brewing and beverage operations in Africa cover 17 countries including Botswana, Mozambique, Nigeria, South Africa, Tanzania, Uganda, and Zambia. A further 21 countries are covered through our associate interests in the Castel group’s African beverage businesses and we also have an associated undertaking in Zimbabwe. What we do – In most of these countries we are the number one brewer by market share. – We produce Coca-Cola products in 23 of our African markets (with Castel in 15 of these markets and through our associated undertaking in Zimbabwe). Read more on page 22 Latin America Where we operate Regional office: Miami, USA Our primary brewing and beverage operations cover six countries across South and Central America: Colombia, Ecuador, El Salvador, Honduras, Panama, and Peru. What we do – In each of these countries we are the number one brewer by market share. – We have a brewery in Argentina, and we export to Chile and Paraguay. – We produce soft drinks across the region including Coca-Cola products in El Salvador and Honduras. Read more on page 18 STRATEGICREPORT 3SABMiller plc Annual Report 2016
  • 8.
    Chairman’s statement Dear shareholder Therecommended offer from AB InBev has naturally made this a momentous year for your company. The proposed transaction has inevitably been a distraction for the senior leadership team and potentially for the entire organisation, which is why it gives me so much pleasure to report on another year of strong underlying business performance. Notwithstanding the impact of the transaction and a volatile economic environment, we achieved beverage volume growth of 2% and group net producer revenue (NPR) and EBITA growth, on an organic, constant currency basis, of 5% and 8%, respectively. EBITA margin, as a percentage of group NPR, on the same basis, expanded by 60 basis points, enabled by both top line performance and by our cost reduction and productivity improvements. These results are driven by our strategy to expand the beer category and strengthen our brand portfolios through our affordability and premiumisation initiatives, supported by innovation. They tell us that we have the right strategy and that it works. The continued depreciation of key operating currencies against the US dollar had an adverse impact on our reported results. Reported group NPR, EBITA and adjusted EPS declined by 8%, 9% and 6%, respectively. Despite these adverse currency movements, we delivered free cash flow of US$2,969 million, which has enabled continued investment in our growth markets in Africa and Latin America. The strength of the group’s performance amply justifies the board’s decision to recommend a final dividend of 93.75 US cents per share, bringing the total dividend for the year to 122 US cents, an increase of 9 US cents over the prior year. On 11 November 2015, AB InBev announced a recommended cash offer, with a partial unlisted share and cash alternative, for your company. The most important task for the board in the year was our consideration of this offer. The board’s initial rejection of terms that it considered did not adequately value SABMiller resulted ultimately in significantly improved offer terms, after six increases, before agreement was reached between Total dividend payment 122 US cents(2015: 113 US cents) The AB InBev offer values the company at US$106 billion, representing a total return to shareholders of about 1,500% since listing in London in 1999. This is a tremendous achievement.” 4 SABMiller plc Annual Report 2016 STRATEGIC REPORT
  • 9.
    SABMiller and ABInBev. Under the agreement, AB InBev has agreed to use its best efforts to secure the regulatory clearances and authorisations necessary to satisfy the pre-conditions and regulatory conditions to the transaction, with a break fee of US$3 billion being payable if these clearances are not achieved. The agreed cash offer represents a significant premium and cash return for our shareholders, securing early delivery of the company’s long-term value potential. At the time of writing, the transaction is going through the regulatory processes and good progress is being made. However, until AB InBev’s offer is made to and approved by shareholders, and the transaction completes, the board remains focused on the need for our business to continue to perform strongly and for our strategic objectives to be executed as an independent business. We have therefore continued to uphold rigorous standards, and in the corporate governance report on pages 54 to 69, there is a detailed description of the directors’ approach to corporate governance, our application of the UK Corporate Governance Code, and our views on the role and effectiveness of the board. In the months before becoming Chairman, I was delighted to have the opportunity to introduce myself to most of our major shareholders and to listen to their comments and concerns. These meetings provided invaluable background when, later in the year, I had to discuss with them the offer from AB InBev. Our conversations were open and constructive, and I am grateful to our shareholders for their continued support. SABMiller is an extraordinary success story. From its origins in Johannesburg in 1895, the group has grown to be a highly admired, high-performing global beer and beverage business. SABMiller has created significant value for shareholders since listing on the London Stock Exchange in 1999 with a market capitalisation of US$5 billion. The group expanded through organic growth and a series of highly successful acquisitions and joint ventures on five continents. Today our unmatched footprint in fast-growing developing markets is underpinned by our portfolio of iconic national and global brands. The AB InBev offer values the company at US$106 billion, representing a total return to shareholders of about 1,500% since listing in London in 1999, or a compound return of around 17.4% per year. This is a tremendous achievement and a great tribute to the vision of our leaders and the commitment of our people around the world. However, these impressive statistics tell only part of the story. SABMiller has always aimed to play a positive role in the communities where it operates, right across the world. Our global sustainable development ambition is called Prosper, and this sums up our philosophy that when communities prosper, our business prospers. Prosper includes commitments in five areas that promote: accelerating growth throughout our value chain; responsible and moderate alcohol consumption; secure water supplies; reducing waste and carbon emissions; and supporting farming. All of our Prosper initiatives are designed to protect our business and improve livelihoods, to support long-term sustainable growth, and therefore to create value for shareholders. It has been a privilege over the past year to see for myself how deeply management and employees believe in SABMiller’s stated purpose: to bring refreshment and sociability, improve livelihoods and help build local communities. I am honoured to acknowledge the role played by successive boards over the years for their stewardship of the company and for their consistent support and encouragement of management. I am also most grateful to my fellow board members for their support, commitment, skill and wisdom over the last year, especially as we navigated the AB InBev offer. There were a number of changes in the board this year: we welcomed our new CFO, Domenic De Lorenzo, as well as two new non-executive directors, Javier Ferrán and Dave Beran. Dave succeeded Howard Willard as an Altria nominee to the board. Our sincere thanks to John Manser, John Manzoni and Howard Willard for their invaluable contributions since joining the board in 2001, 2004 and 2009, respectively. The board’s sincere thanks and congratulations are due to our Chief Executive Alan Clark and the members of the executive committee, and indeed to our 70,000 people around the world, for their tremendous achievements over the last year. They have continued to execute our group strategy, maintaining the energy and momentum in our business, while dealing with the considerable distraction of the AB InBev offer. The performance of our business is a testament to their unwavering focus on delivering for consumers and shareholders. Jan du Plessis Chairman 10 June 2016 The agreed cash offer represents a significant premium and cash return for our shareholders, securing early delivery of the company’s long-term value potential.” STRATEGICREPORT 5SABMiller plc Annual Report 2016
  • 10.
    Chief Executive’s review Businessperformance We achieved strong underlying performance for the year. We grew EBITA across all regions and our group EBITA margin improved through the year, on an underlying basis. This performance reflects our focus on driving superior growth by strengthening our core brands, expanding the beer category to reach more consumers on more occasions, and placing an emphasis on premiumisation in all regions. As noted through the year, the strengthening of the US dollar against our operating currencies had a material negative impact on reported results. Our affordability and premiumisation initiatives have allowed us to capture growth in developing markets and capitalise on key trends in developed markets. Our subsidiaries achieved organic volume growth of 5% and NPR growth of 8% on an organic, constant currency basis, with a particularly good performance in a number of key markets. This was offset by a more muted performance in our associates and joint ventures held back by headwinds in their major markets and continued weak industry trends in the USA, such that group NPR grew by 5% on the same basis. Premium lager brands’ NPR grew by 12%1 and global lager brands’ NPR grew by 13%1 , both on a constant currency basis, with growth across all regions. Our underlying growth accelerated in the year, driven by improving momentum in Latin America, continued strong and well-balanced momentum in Africa, and improvements in Australia and Europe in the second half. On a reported basis, group NPR and EBITA declined by 8% and 9%, respectively, reflecting the depreciation of our key operating currencies against the US dollar. 1 On a subsidiary basis, excluding home markets for global brands. Our strong underlying performance reflects our focus on driving superior growth by strengthening our core brands, expanding the beer category to reach more consumers on more occasions, and emphasising premiumisation.” 6 SABMiller plc Annual Report 2016 STRATEGIC REPORT
  • 11.
    Supporting small enterprises,supporting growth Small businesses play a critical role across our value chain and are the lifeblood of local economies and communities. In Africa, as part of our Go Farming strategy, we assist farmers by using local crops to produce our affordable beers. In Uganda, Eagle Lager – a beer brewed from locally-sourced sorghum – supports more than 20,000 smallholders. It has inspired similar initiatives throughout Africa. Across the world, we help retailers develop the skills to grow their businesses, sell beer responsibly, access finance, and lead improvements in their communities. Our 4e programme in Latin America pioneered this approach and to date has supported over 20,000 small-scale shopkeepers. Read more online www.sabmiller.com/prosper By creating a more integrated global business we have been able to cut costs and free up in-market resources to achieve our strategic objectives. We continue to focus on improving our in-country performance in a cost efficient manner, supported by our global cost and efficiency programme which is ahead of schedule and delivered cumulative net annualised savings of US$547 million by the year end. The programme is on track to achieve our 2020 target of US$1,050 million. These initiatives mitigated adverse transactional currency headwinds. Exceptional charges of US$721 million before tax, principally relating to the impairment of our investments in Angola and South Sudan, together with costs associated with the AB InBev transaction, resulted in a 16% decline in profit before tax. We are expanding our exposure to growing markets and building the optimum portfolio of lager, soft drinks and other alcoholic beverages to capture growth. Soft drinks volumes grew by 6%. On 10 May 2016, the South African Competition Tribunal approved, with agreed conditions, the formation of Africa’s largest soft drinks beverage operation, Coca-Cola Beverages Africa (CCBA) in which we will have majority ownership. We expect the transaction to complete in early July 2016. Well-positioned for superior topline growth SABMiller’s business is beer and soft drinks, giving us the benefit of operating in the two largest profit pools in global packaged beverages. We are further advantaged by the geographical spread that we have built over many years. This is biased towards developing markets, which offer higher long-term growth opportunities in both volume sales and margin expansion. Our developing markets exposure is complemented by our scale in well- established, highly profitable, and cash- generative businesses in developed markets, principally in the USA (through our joint venture with Molson Coors), Australia, and Europe. As developing markets grow and disposable incomes rise, per capita beer and soft drinks consumption typically increase in parallel. Keys to tapping into this growing demand are availability and affordability. We offer a range of beers appropriate to each developing market, starting with affordable and mainstream lagers and introducing more local premium and international premium beers as GDP rises. Developed markets have higher profits per hl but mainstream beer sales have been in gradual decline for a number of years. Competition from wine and spirits has intensified at the same time as increasing consumer focus on health and wellbeing has led to overall declines in alcohol consumption. More recently, the beer category has been undergoing a renaissance as the popularity of craft beers and easy-drinking lagers has boomed, but this has intensified competition with mainstream lager. In these changing market dynamics, SABMiller has adopted a strategy to expand the beer category, which at its heart aims to make beer more appealing to more consumers on more occasions. Our vision To be the most admired beverage company in the world. Our purpose We bring refreshment and sociability, improve livelihoods, and help build communities. Our values – People are our enduring advantage. – Accountability is clear and personal. – We work and win in teams across the business. – We are customer- and consumer- focused. – We do our best for local communities. – Our reputation is indivisible. STRATEGICREPORT 7SABMiller plc Annual Report 2016
  • 12.
    STRATEGIC REPORT |ChiefExecutive’s review continued This means supporting jobs and stimulating growth, promoting responsible alcohol consumption, and being good stewards of water and other natural resources. When communities prosper, our business prospers too. This year saw two ground-breaking global agreements, which will shape the development agenda for years to come: the United Nations launched 17 Sustainable Development Goals (SDGs), and world leaders committed to tackle climate change at COP21 in Paris. Expectations of business are high, and we welcome the challenge for companies to step up and collaborate in addressing global challenges. Many of the SDGs align with our existing sustainable development strategy, Prosper, and present opportunities to strengthen our business as well as to contribute to society. Putting Prosper at the heart of our business enables us to drive growth and commercial results, while making a sustainable and measurable difference to the communities and ecosystems in which we operate. More information is available on pages 48 to 51, as well as in our 2016 Sustainable Development Report. Our people Everyone should be able to return home from work safely. We continue striving to reduce or eliminate risks of harm to our employees, contractors, and all others affected by our business. Our global health and safety programme, Safety Around Beverages, sets out the minimum standards to which all businesses should adhere. In addition, our road safety campaigns across Africa and Latin America are making a difference, and we are committed to continuing to build on this effort. Health and safety remains a priority. More information is available on pages 52 and 53. Since the boards of SABMiller and AB InBev reached agreement in principle on the key terms of a recommended offer, looking after our people has been a priority. To retain key people for business continuity, our focus has been on ensuring our people are best-placed for their future careers; and Some of the key elements in this strategy include innovation that is scalable and repeatable across multiple markets, from new beer styles, including craft, to flavoured malt beverages to low or zero-alcohol beers; expanding the range of occasions on which people will choose to drink beer rather than other alcohol, such as with meals; and tackling an age-old challenge of making beer that is more appealing to women. Recommended offer by AB InBev Since the announcement of the AB InBev offer, we have taken a number of steps to ensure that we continue to focus on strong performance, recognising our duty to deliver sustainable value into the future. We have continued to manage our business based on our strategic priorities and budgets, although some longer-term projects have been deferred or adjusted. Our values, leadership behaviours, culture, processes, and routines have remained the foundation for how we work and manage our business. Throughout the period, we have continued to reinforce our focus and priority on consumers and customers, and to delight them with our level of service and quality brands of their choice. An extremely important priority has been to maintain employee engagement during the many months between announcement of the transaction and completion, and to ensure that our employees are as well-placed as possible for their future careers. It is a huge credit to all of our people that they have not allowed the uncertainty and prospective changes to distract them from delivering a very strong performance, with momentum increasing in the second half. This is testament to the strength and depth of talent across our workforce, and their resilience and dedication. Prosper: our strategy for sustainable growth We have a proud beer heritage that began over 120 years ago in South Africa. Since then, our brewmasters around the world have made beers people love by understanding local tastes. We also aim to play a positive role in the communities where we operate. It is a huge credit to all of our people that they have not allowed the uncertainty and prospective changes to distract them from delivering a very strong performance, with momentum increasing in the second half.” Powering successful innovation Innovation is central to our strategy of making beer more appealing to more consumers on more occasions. To deliver bigger, better innovations that can succeed in more markets, we have integrated our innovation expertise into three regional centres. These locations bring together multidisciplinary teams, with expertise ranging from marketing and brewing to packaging and procurement. Located in Bogota, Johannesburg and Woking, the three facilities serve, respectively, our markets in Latin America, Africa and Europe. Two of the year’s most successful launches, Aguila Cero in Colombia and Castle Milk Stout Chocolate Infused in South Africa, involved people from these teams. 8 SABMiller plc Annual Report 2016
  • 13.
    keeping employee motivationand business performance up during a prolonged period of uncertainty. There were several executive moves during the year. Domenic De Lorenzo was appointed Chief Financial Officer and joined the board in July 2015, following his appointment as Acting CFO in February 2015. We announced in April that Tony van Kralingen intended to retire at the end of 2015, and that subsequently his role as Director of Integrated Supply and Human Resources would be split into two new positions on SABMiller’s executive committee, namely Group Director, Human Resources and Group Director, Integrated Supply. Johann Nel rejoined SABMiller as Group Director, Human Resources in September 2015 and Philip Hodges was appointed Group Director, Integrated Supply. He was due to join in December 2015, but in the light of the AB InBev offer, we agreed with Philip that there was no point in his taking up his new position. With this development, Tony van Kralingen agreed to postpone his retirement, and is continuing to act as Group Director, Integrated Supply. Tom Long retired as CEO of MillerCoors on 30 June 2015. He led MillerCoors as CEO since 2011, having been president and chief commercial officer since the launch of the MillerCoors joint venture in 2008, and CEO of Miller Brewing Company before that. In September, we and our joint venture partner, Molson Coors, announced that Gavin Hattersley had been appointed CEO of MillerCoors, following his tenure as interim CEO since July. I would like to thank all of my executive team for driving our strong performance this year and their enormous efforts in keeping the business focused despite the potential distraction from the AB InBev transaction. Taking on spirits at their own game When Castle Milk Stout was challenged in South Africa by the rise in popularity for spirits we evolved the brand to make it more attractive to spirits drinkers. Castle Milk Stout’s dark colour, complex taste and traditional image were off-putting for some people, but loved by devotees. So we transformed Castle Milk Stout’s pricing and packaging in South Africa from mainstream to premium, imitated spirit brands by communicating the product’s uniqueness, and introduced a chocolate variant, Castle Milk Stout Chocolate Infused. This year volumes for Castle Milk Stout in South Africa, including the chocolate variant, were up by 14%. Managing water and climate change risk Water scarcity is our most significant climate change-related challenge, with certain SABMiller breweries already facing significant risk. We have completed water risk assessments for nearly all our breweries and established plans to tackle the main issues, often with partners. We are on track to meet our target of using 3.0 hectolitres (hl) of water for 1 hl of beer by 2020, having used an average of 3.2 hl/hl during the year. We have reduced carbon emissions from on-site energy use by 36% in absolute terms between 2008 and 2016 and are on course to meet our 50% carbon efficiency target by 2020. Within our cost saving programmes, we saved US$1161 million in the year from water and energy initiatives, compared with 2010. 1 Reflects cost savings on an annual basis, based on savings actions initiated in 2010, and calculated using 2016 volumes, exchange rates and energy prices. Read more online www.sabmiller.com/prosper STRATEGICREPORT 9SABMiller plc Annual Report 2016
  • 14.
    STRATEGIC REPORT |ChiefExecutive’s review continued Addressing risks We place great emphasis on identifying, monitoring, and mitigating risks to our business and we have a well-developed risk management process which includes detailed mitigating action plans. In the year, the risk management process was refined and further enhanced to ensure alignment with Financial Reporting Council (FRC) revisions to the UK Corporate Governance Code. The principal risks and uncertainties which the group faces have been updated and broadened to reflect the changed situation as a result of the AB InBev offer and are set out on pages 16 and 17. Two new transaction-related risks have been added: first, failure to comply with anti-trust legislation and the necessary information security protocols in place during the offer period, and, secondly, the impact on stakeholders if the transaction does not complete. As a result of the most recent review completed by the board, three of the previous year’s principal risks (relating to industry consolidation, delivering business Fresh tank beer rejuvenates classic brands Our oldest, most revered brands are enjoying a fresh lease of life thanks to our tank concept. During the year, Club Colombia became our latest brand to be available on-premise from a gleaming 500 litre copper tank. The Colombian beer’s tank debut means that consumers now have the opportunity to try nine of our premium brands as tank beer across 16 countries, including unpasteurised Pilsner Urquell in the UK and Castle Lager in South Africa. The great taste and novelty of fresh tank beer, which is delivered direct from the brewery in branded trucks, is proving extremely popular with consumers. (Clockwise from top left) Carlton Draught, Castle 1895 Draught, Club Colombia and Pilsner Urquell 10 SABMiller plc Annual Report 2016
  • 15.
    transformation, and theacquisition of CUB) are no longer considered as being principal risks of the group or are not currently relevant. Management has defined robust mitigation actions and monitoring mechanisms supported by assurance processes for all principal risks. There has been good progress in respect of mitigation actions during the year. Outlook We expect to deliver good underlying performance in the year ahead. Our cost and efficiency programme is on track to reach targeted annualised savings of US$1,050 million per annum by the financial year ending 31 March 2020. We anticipate that we will continue to face foreign exchange volatility and the results of certain of our key operations will be impacted by currency depreciation against the US dollar. Conclusion As this may be SABMiller’s final annual report, it is worth reflecting on what we have achieved. We grew from small beginnings, brewing quality cold beer for thirsty miners in the dusty streets of 19th century Johannesburg. More than 120 years later, generations of incredibly talented people have built a highly-admired, high-performing, global beer and beverage business. We have always nurtured the art of brewing, which has given us a stable of locally-loved and internationally-famous beers. What has also made us special is our deep understanding of navigating different local markets, catering for local tastes and helping to build the communities around us. Listing on the London Stock Exchange in 1999 was the launch pad for our global ambitions, leading to the creation of the number two global brewer and a FTSE-10 company. Upon listing, the value of the business was £3.3 billion. The £44 per share proposed by AB InBev values us at almost £70 billion. This is an outstanding result by any measure. The SABMiller story is a simply amazing achievement, and everyone who has been a part of it should feel immensely proud of the value they have helped to create. I am sure the next chapter will bring new opportunities for exceptional success. Alan Clark Chief Executive 10 June 2016 Key strategic priorities Drive superior topline growth through strengthening our brand portfolios and expanding the beer category – Strengthen our local and global brand portfolios to capture superior profitable growth. – Accelerate premium mix and the growth of our premium brands. – Develop and expand the category to capture new consumers, new occasions and grow category share of value. – Prioritise and focus investment and resources on revenue growth in key markets and segments. Build a globally integrated organisation to optimise resource, win in market and reduce costs – Systematically build a high performance talent pool. – Up-weight and right-size out of market structures to ensure optimum service delivery at an affordable cost. – Develop a commercial operating model that will facilitate winning in and across markets. – Reduce costs to drive growth and returns. Actively shape our global mix to drive a superior growth profile – Focus resources on highest growth opportunities. – Deliver superior performance in soft drinks operations. – Build material positions in new categories in attractive markets. – Mergers and acquisitions to access new growth in attractive markets. STRATEGICREPORT 11SABMiller plc Annual Report 2016
  • 16.
    Our business modelis built on our passion for beer We are local beer experts. Our success is rooted in deep local insights, global skills, talented people and community investment. Creating sustainable value chains We create sustainable value chains that contribute to local economic and social development. Understanding consumer tastes and applying local insights Sharing our consumers’ passion for local beer, more than 200 of our brands are mostly sold locally in their country or region of origin. We have a selected number of regional and global brands, which complement our local portfolios. Using global skills and scale to drive local performance Our local markets focus on commercial activity, producing, marketing and selling the right beers and beverages for their area. We support our country operations with broader, shared service operations. These help us to achieve economies and efficiencies of scale and drive duplicative costs out of local businesses. We also share best practice and success across our markets in innovation, marketing, technical standards and training. Investing in talent for competitive advantage We are proud to attract and retain the best talent, and invest in individuals’ skills and careers. The global mobility of our leaders is one of our major strengths, by moving around, they take insights into new markets. We incentivise management at every level through a rigorous goal- setting process that aligns the need for commercial success with the longer-term ambition of achieving sustainable best practice. Refreshing our success: innovation and selling across the price spectrum We enhance our enduring brands with innovation across a vibrant spectrum of beer styles to reflect demographic, cultural and societal shifts and evolving consumer tastes. We reinvigorate national icon brands to keep our strength in core lager and are developing products for more occasions and consumer types. Our brands range from entry-level beers, including sorghum and cassava beers such as Eagle and Impala to international super premium beers such as Peroni Nastro Azzurro. Sourcing Working closely with suppliers, including large-scale and smallholder farmers who grow quality crops, and sourcing locally where we can. Brewing Producing beers that taste great demands a mix of traditional craftsmanship, modern science and fresh, natural ingredients. Bottling and distribution Delivering quality, fresh beers and soft drinks for our consumers to enjoy while minimising waste and promoting returnable bottles and recycling. 12 SABMiller plc Annual Report 2016 STRATEGIC REPORT
  • 17.
    Delivering value for our stakeholders: –sustainable superior returns for shareholders; – refreshment and sociability for consumers; – jobs and career development for employees; – incomes and livelihoods for suppliers and retailers; – growth for national economies; and – support for communities. Working with associates and joint ventures We generate a significant amount of group NPR from interests in associates and joint ventures and in Africa we have significant minorities in our subsidiaries. These have facilitated our global expansion and are valuable where local knowledge is an important asset. Retail Partnering with small and large retailers in the on- and off-trade segment to bring refreshment and sociability to our consumers. Consumers Listening and responding to changing consumer needs, using local insight and broadening our appeal across new segments and occasions. Partnering for shared prosperity By supporting the small businesses across our value chains – and in local communities – to prosper, our business will prosper too. By joining forces with others who share our goals, we can co-ordinate action and unlock innovation for job creation, responsible alcohol consumption, watershed protection, lower carbon emissions and more productive use of land. We tailor our approach in response to challenges, widening and deepening partnerships as our understanding develops and our initiatives grow. STRATEGICREPORT 13SABMiller plc Annual Report 2016
  • 18.
    Market overview Beer accountsfor almost one-third of global retail sales value in packaged beverages, with attractive industry margins. The global soft drinks market is slightly larger than that for beer, accounting for approximately 40% of global retail sales value in packaged beverages. The global beer market is relatively consolidated, with the top four largest brewers (AB InBev, SABMiller, Heineken, and Carlsberg) accounting for around 50% of global volumes and will consolidate further on completion of the AB InBev transaction. SABMiller is the number two globally, which gives us the opportunity to leverage our scale, global brands and skills to improve in-market performance. Given the importance of local brands and scale, the strength of local market positions is also important to sustainable long-term performance in beer, and 94% of our beer volumes come from markets where we are the number one or two brewer. The nature of competition and competitive intensity varies by market, but we typically compete not only against the major global brewers, but also with small and large local brewers and other alcohol producers. The global beer market has been growing at 2% to 3% over the past 10 years. However, there is a clear difference in growth, category dynamics and characteristics between developing and developed markets and, accordingly, in the growth opportunities they present. Developing markets Developing markets offer significant underlying demand-led growth, with growth in beer consumption driven by: – affordability, with per capita consumption increasing sharply as consumer disposable income levels grow; – beer being an aspirational and higher quality beverage compared with other competing alcoholic beverages in these markets, which are typically local spirits or informal/illicit alcohol; and – demographics and drinking occasions being skewed towards core beer consumers, with mainstream lager critical to growth. Ensuring the affordability, availability and quality of core mainstream lager is critical to growth in these markets. However, while the beer category is heavily focused on mainstream lager, the rise in disposable incomes provides opportunities for premiumisation through local and international brands. Compared with our global competitors, a greater proportion of our total profit and volumes comes from developing markets. This has helped support our superior rates of organic topline growth. Developed markets In contrast with developing markets, volume and consumption growth in more developed markets have typically been flat or have declined over the past decade. This reflects both a general decline in alcohol consumption and a fall in beer’s share of total alcohol. There are many reasons for this shift and the increasing fragmentation of consumer choice, including changes in the nature of drinking occasions and in the demographics of alcohol consumers. These changes include the growth of mixed gender drinking occasions and ageing populations. These dynamics are challenging, but they also represent future growth opportunities for the beer category. For example, increased consumer demand for variety and new experiences has driven the higher growth of different beer styles outside of core lager, notably in the US craft beer segment but also across other developed markets. Delivering topline growth in these markets is dependent on successful premiumisation to drive revenue per hectolitre growth and on appealing to more consumers on more occasions, by: – improving core mainstream lager offers to better meet the needs of a wider range of consumers; – innovating to evolve portfolios towards more attractive growth segments; and – regaining share from other beverages. Soft drinks Sparkling, or carbonated soft drinks (CSDs), make up approximately 40% of total soft drinks global retail sales value. Global soft drinks volumes have been growing at around 4% per year over the past 10 years, with the category demonstrating similar consumption characteristics and growth dynamics to beer, with rapid growth and increasing levels of per capita consumption as markets develop. Soft drinks also show a similar overall category development dynamic to beer. In developing markets, CSDs and bottled water are the dominant sub-categories, but fragmentation of the category occurs as markets develop, with still drinks, juices, and premium bottled water becoming much more evident. As with beer, scale and leadership in a market is critical to long-term sustainable success. 14 SABMiller plc Annual Report 2016 STRATEGIC REPORT
  • 19.
    Key performance indicators Thekey performance indicators (KPIs) outlined below are used to monitor progress against our overall financial goal and our strategy, which defines how we will achieve this goal. While our strategy naturally evolves and changes in line with market conditions, it continues to guide our short, medium and long-term growth. Measuring our progress What we measure Why we measure How we have performed Financial goal 2016 2015 2014 Total shareholder return in excess of the median of our peer group over five-year periods To monitor the value created for our shareholders over the longer term relative to alternative investments in the drinks industry, in line with our business performance goal 13 % pts 36 % pts 98 % pts Growth in adjusted earnings per share To determine the improvement in earnings per share for our shareholders at reported exchange rates -6% -1% 2% Growth in adjusted earnings per share (constant currency) To determine the improvement in earnings per share for our shareholders at constant exchange rates 12% 5% 9% Free cash flow To track cash generated to pay down debt, return to our shareholders and invest in acquisitions US$2,969m US$3,233m US$2,563m What we measure Why we measure How we have performed Associated strategic priorities Commercial and strategic goals 2016 2015 2014 The proportion of our total lager volume from markets in which we have no. 1 or no. 2 national market share positions To gain an overall picture of the relative strength of our market positions 94% 94% 95% The proportion of group EBITA from developing economies To assess the balance of our earnings exposure between regions of the world economy with highest growth potential and more developed regions 69% 72% 72% Organic growth in total beverage volumes To track the underlying growth of our business 2% 1% 2% Group net producer revenue growth (organic, constant currency) To assess the underlying rate of growth in net sales value of our brand portfolios 5% 5% 3% Net producer revenue growth in premium brands (constant currency) To monitor progress in building our portfolio of global and local premium brands 12% 8% 3% EBITA growth (organic, constant currency) To track our underlying operational profit growth 8% 6% 7% EBITA margin progression (organic, constant currency) To monitor the rate of growth in our underlying operational profitability 60 bps 30 bps 90 bps Hectolitres of water used at our breweries per hl of lager produced To gauge our progress in reducing the amount of water used in our breweries 3.2 hl/hl 3.3 hl/hl 3.5 hl/hl Fossil fuel emissions from energy use at our breweries per hl of lager produced To assess progress towards reducing fossil fuel emissions at our breweries 8.9 kgCO2e/hl 9.4 kgCO2e/hl 10.3 kgCO2e/hl Cumulative financial benefits from our cost and efficiency programme To track the cost and efficiency savings from the programme to leverage our skills and scale US$547m pa US$221m pa n/a1 1 Not applicable. Key to strategic priorities Drive superior topline growth through strengthening our brand portfolios and expanding the beer category Actively shape our global mix to drive a superior growth profile Build a globally integrated organisation to optimise resource, win in market and reduce costs Further detail is contained within the finance review and the sustainable development review. Remuneration is linked to our KPIs as detailed in the directors’ remuneration report on pages 74 to 92. Detailed definitions are on pages 192 and 193. STRATEGICREPORT 15SABMiller plc Annual Report 2016
  • 20.
    Principal risks Principal riskContext Specific risks we face Possible impact Management capability We believe that our people are our enduring advantage and it is essential that we develop and maintain global management capability. Our people are a source of competitive advantage and will continue to be in the new enlarged organisation or in a standalone business if the AB InBev transaction does not complete. – Failing to identify, develop and retain an appropriate pipeline of talented managers for the present and future needs of the group. – Potential disruption to management and staff arising from uncertainty during the AB InBev offer period and exacerbated by the complexity of potential disposals to facilitate regulatory approvals. – Failure to deliver the group’s strategic and financial ambitions. – Lower long-term profitable growth – Loss of competitive advantage. Regulatory changes With an increasingly high profile debate over alcohol consumption in many markets, the alcohol industry is coming under more pressure from national and international regulators, NGOs and local governments. This risk has broadened as compared with the previous year due to possible increased regulatory scrutiny arising from the AB InBev offer. – Regulation places increasing restrictions on the availability and marketing of beer. – Tax and excise changes cause pressure on pricing. – Anti-alcohol advocates erode industry reputation. – Lower growth, profitability and reduced contribution to local communities in some countries. – Loss of consumer goodwill and public sentiment. Consistent sustainable revenue growth Consumer tastes and behaviours are constantly evolving, and at an increasingly rapid rate. Competition in the beverage industry is expanding and becoming more fragmented, complex and sophisticated. Potential actions of our competitors and stakeholders during the offer period could impact the competitive environment and our commercial performance. – Failing to develop and ensure the strength and relevance of our brands with consumers, shoppers and customers. – Failing to continue to improve our commercial capabilities to deliver brand propositions which respond appropriately to changing consumer preferences. – Topline growth progression does not meet internal and external expectations. – Market positions come under more pressure and market opportunities are missed, leading to lower profitability. Information and cyber security There is increasing sophistication of cyber-attack capabilities. Business’s increasing demand for consumers’ and customers’ personal data means legislators rightly continue to impose tighter data management control. There is a heightened risk of information loss, cyber security attacks and deliberate, harmful acts as a result of possible disruption and business distraction during the AB InBev offer period. – Disruption of information technology systems and a loss of valuable and sensitive information and assets. – Significant business disruption. – Failing to comply with tightening legislation poses a threat of significant financial penalties or restrictions. – Loss of competitive advantage and reputational damage through the publicised loss of key operating systems and confidential data. – Adverse effect on profitability, cash flows or financial position. Confidentiality and anti-trust compliance The business’s support for the AB InBev offer and the post-transaction convergence planning process through to change of control requires clear and consistent compliance with anti-trust legislation and information security protocols with respect to provision of information to AB InBev and other parties. – Failure to comply with anti-trust legislation and information security protocols results in negative reputational impact, commercial implications, and significant financial penalties. – Loss of competitive advantage and reputational damage. – Adverse effect on profitability, cash flows or financial position. Transaction fails to complete The AB InBev offer is subject to multiple approvals from regulatory bodies and shareholders. – Transaction failure impacts the organisation resulting in loss of momentum and short and medium-term disruption to business performance. – Unsettled management and staff. – Transaction failure poses threat to relationships with external stakeholders including shareholders, customers, suppliers, and joint venture and associate partners. – Loss of value. – Loss of short-term competitive advantage. – Failure to deliver the group’s short and medium-term strategic and financial ambitions. Focused on managing our risks The principal risks facing the group and considered by the board and the executive committee are detailed below. The group’s risk management process is described in the corporate governance section while financial risks are discussed in the finance review on page 47 and in note 21 to the consolidated financial statements. 16 SABMiller plc Annual Report 2016 STRATEGIC REPORT
  • 21.
    Mitigation Associated strategic priorities Comparisonto previous year – Building the group’s leadership talent pipeline through our Global Talent Management model, strategic people resourcing and long-term talent pipeline. – Sustaining a strong culture of accountability, empowerment, and personal development. – Continuous employee engagement and communication to promote retention of key talent and use of incentive programmes that support motivation and retention. – Aligned goal setting focused on current priorities. – Rigorous adherence to the principle of self-regulation backed by appropriate policies and management review. – Building licence to trade capabilities across the group to facilitate sound risk analysis and mitigation plan development. – Constructive engagement with government and all external stakeholders on alcohol-related issues. – Investment to enhance the positive economic and social impact of our businesses in local communities and working in partnership with local governments and local and global NGOs. – Driving our Prosper shared imperatives to make a sustainable and measurable difference to the communities and ecosystems in which we operate. – Pursuing a beer category structure that enables us to grow both the value of the beer category, and our share of it. – Ensuring we have a deep understanding of changing consumer and industry dynamics in key markets, enabling us to respond appropriately to opportunities and issues which may impact our business performance. – Ongoing evaluation of our brand portfolios in every market to ensure that they target current and future opportunities for profitable growth. – Building our brand equities through innovation and compelling marketing programmes; creating a pipeline of opportunities to support our premium offering. – Focus on monitoring and benchmarking commercial performance and developing the critical commercial capabilities that are required in order to win in local markets. – Active management of key relationships in local markets to minimise any potential disruption arising during the AB InBev offer period. – Continued development and implementation of information security policies. – Increased investment to improve information security awareness, intelligence and implementation of sound security processes. – Building and enhancing processes to accelerate detection of, and deal with, IT security incidents. – Group-wide communications and protocols developed and disseminated throughout the organisation. – Engagement of external anti-trust counsel engaged at global and local levels to ensure SABMiller’s interests are protected. – Use of ‘clean teams’ and associated protocols to manage necessary information sharing as part of the regulatory, disposals and convergence planning processes. – Engagement with AB InBev to support timely transaction completion including support for disposal processes and convergence planning assistance. – US$3 billion break fee in place should the AB InBev offer fail to complete. – Strong continued focus on delivery of strategy and financial performance, cost control and budget discipline in place across the organisation. – Management response plans in place should the AB InBev offer fail to complete. Key Associated strategic priorities Comparison to previous year Drive superior topline growth. Build a globally integrated organisation to optimise resources, win in market and reduce costs. Actively shape our global mix to drive a superior growth profile. New risk due to the AB InBev offer Risk broadened due to the AB InBev offer STRATEGICREPORT 17SABMiller plc Annual Report 2016
  • 22.
    Where we operateLager volumes 46.6m hl +6% +4% Soft drinks volumes 20.6m hl 20,000retailers supported Since its launch, our 4e Path to Progress programme has provided more than 20,000 small retailers across Latin America with training to improve their businesses and livelihoods. Significant business with production operations Selling operations and major export markets +8% 1 Group NPR US$5,211m +7% 1 EBITA US$1,959m Drive superior topline growth through our brands: NPR growth was supported by premium lager volume growth of 7% across the region; Above mainstream brands Aguila Light and the alcohol-free Aguila Cero delivered double digit growth in Colombia; and Our affordability strategy in Honduras and El Salvador drove strong volume and NPR growth in both countries. Where we operate 1 Constant currency basis. 18 SABMiller plc Annual Report 2016 STRATEGIC REPORT |Operations review
  • 23.
    Financial summary Reported 2015 Net acquisitions and disposals Currency translation Organic growth Reported 2016 Organic, constant currency growth % Reported growth % GroupNPR (US$m) 5,768 – (1,020) 463 5,211 8 (10) EBITA (US$m) 2,224 – (431) 166 1,959 7 (12) EBITA margin (%) 38.6 37.6 Sales volumes (hl 000) Lager 44,156 – 2,471 46,627 6 6 Soft drinks 19,865 – 747 20,612 4 4 Total beverages 64,021 – 3,218 67,239 5 5 Latin America reported NPR growth of 8% on a constant currency basis (down 10% on a reported basis), with beverage volume growth of 5%. Lager volume growth of 6% was underpinned by our affordability strategy together with the successful targeting of new consumption occasions with innovations and effective marketing. Our NPR growth was further supported by momentum in our above mainstream and premium brands, with premium lager segment volume growth of 7%, together with lager pricing and soft drinks volume growth of 4%. EBITA growth of 7% on a constant currency basis (down 12% on a reported basis) was driven by the topline performance while EBITA margin declined by 20 bps on a constant currency basis as cost productivity and improved efficiencies in manufacturing and distribution only partly compensated for the currency pressure on imported raw materials. The reported EBITA margin decline of 100 bps reflected the depreciation of our operating currencies against the US dollar, which disproportionately impacted our key Colombian operation. In Colombia, group NPR grew by 11% on a constant currency basis, with beverage volume growth of 8%. Lager volume growth of 11% reflected our bulk pack affordability strategy and the success of our enhanced sales service model. Our lager volume growth, which was further supported by shifts in consumer spending away from durable goods, and favourable weather, lifted our volume share of the alcohol market Karl Lippert President, SABMiller Latin America Lager volume growth of 6% was underpinned by our affordability strategy together with the successful targeting of new consumption occasions with innovations and effective marketing.” STRATEGICREPORT 19SABMiller plc Annual Report 2016
  • 24.
    by 220 bps.NPR growth was boosted by selective price increases, trading up by consumers and our continued focus on revenue management. Our above mainstream brands Aguila Light and the alcohol-free Aguila Cero delivered double digit growth, with robust growth from our mainstream brands. Premium brands performed well, particularly the Club Colombia brand family which achieved double digit volume growth and exceeded one million hectolitres for the year. Volumes of our non-alcoholic malt beverage brand, Pony Malta, declined 13% following an unfounded social media rumour. Raw material costs came under pressure due to the adverse impact of the exchange rate on our imported commodities as well as higher prices for local raw materials. These impacts were partially mitigated by the December price increases and fixed cost productivity. In Peru, group NPR growth of 7% on a constant currency basis reflected beverage volume growth of 4% with lager volumes up 2%. NPR was further enhanced by selective price increases and positive brand mix reflecting the continued trade up by our consumers from Cristal to our above mainstream brand Pilsen Callao. Our local premium brand Cusqueña saw a return to growth through increased distribution and rate of sale, and the success of its brand variants. The expansion of our direct sales and distribution model helped to offset the impact of heavy rains that affected parts of the country. Our volume share of the alcohol market continued to grow, up 180 bps, as we expanded the category with gains captured mostly from informal alcohol. Soft drinks volumes grew by double digits driven by our water brand San Mateo and sparkling soft drink Guarana. Financial results also benefited from manufacturing and distribution efficiencies. In Ecuador, group NPR grew by 1% with beverage volumes down 2% as a result of weaker economic conditions, increased enforcement of trading restrictions and the effect of heavy rains on both consumption patterns and distribution. Group NPR growth was aided by selective price increases together with positive brand and pack mix, as consumers continued to trade up from Pilsener to the more profitable Pilsener Light packs. Our volume share of the alcohol market, down 270 bps, was driven by the consumer shift to our lower alcohol content beers, but we outperformed the beer category with volume share growth of 70 bps. Higher duties on imported materials were mitigated by further cost productivity which enhanced our margin. In Panama, group NPR declined by 12% owing to a rise in beer excise duties in April, a strike in July and intensified competition, which particularly impacted our premium segment. Lager volumes decreased by 16% with a decline across all segments, which resulted in a 330 bps1 decline in our volume share of the alcohol market. However our innovations targeted at the growing light segment yielded encouraging growth. Soft drinks volumes were down 3% in a highly competitive market. Cost discipline only partially offset the impact of the softer topline performance. Delivering affordable brands Our affordability strategy has helped deliver impressive returns in Latin America. When we entered the region in 2005, beer consumption was limited by its high cost, relative to wages, and due to it generally being available in just one pack size. Our innovative response, which has included introducing varied pack sizes and flexible pricing, led to a 40% increase in the year in regional volumes of our affordable offerings. In Colombia, for example, we successfully offered 750ml bottles and 473ml cans; in El Salvador our Tabernitas outlet development programme further increased sales of our 750ml products, and in Honduras a price reduction on bulk packs helped achieve significant increases in volume. Over 100 years old and still going strong Our century-old beer Aguila is one of Latin America’s top 10 brands, across all sectors, and a national icon in its native Colombia. During the year we continued to build on Aguila’s rich heritage: Aguila Cero gained more than 90% of the non-alcoholic beer category in Colombia within one year of launch; Aguila Light, which we introduced in 2002, remained the fastest growing national beer brand in the country, and the original Aguila made a significant growth rate recovery by strengthening its ties with football. Overall, in the year the Aguila brand franchise achieved double digit growth in volume. 1 On an adjusted like for like basis. 20 SABMiller plc Annual Report 2016 STRATEGIC REPORT |Operations review |Latin America
  • 25.
    In Honduras, groupNPR grew by 12% on a constant currency basis and beverage volumes increased by 11%. Strong lager volume growth of 21%, with a 600 bps1 gain in our volume share of the alcohol market, was underpinned by the execution of our affordability strategy, which reinvigorated the category, and by unusually hot weather. Soft drinks volume growth of 9% also benefited from the good weather. El Salvador delivered group NPR growth of 8% and beverage volume growth of 6%. Lager volume growth of 9% was driven by the expansion of our direct sales and distribution model and supported a 110 bps increase in our volume share of the alcohol market. Growth in our mainstream brands, Pilsener and Golden Light, reflected the consumer adoption of the bulk packs, and our local premium brand Suprema saw double digit growth, which enhanced our brand mix. Soft drinks volumes grew by 5%, with particularly strong growth in still drinks. Having completed water risk assessments at all our Latin American breweries, we now understand the main risks, and how they link to local watersheds. As part of our response, we are working with The Nature Conservancy in Peru, Colombia and Ecuador to build AquaFunds, which source funding from water users to conserve ecosystems that regulate water supplies for all. Read more at www.sabmiller.com/nowaternobeer Road traffic accidents are the cause of a significant proportion of fatalities involving SABMiller employees. Our Vía Responsable campaign in Panama introduced a holistic approach to road safety, dealing with topics such as texting while driving, speeding and drink driving. Between 2010 and 2014 there has been a 15% reduction in traffic accidents with injuries. The programme is now being replicated across Latin America as Por un Buen Camino (On the Right Track). Read more at www.sabmiller.com/roadsafety Read more about regional and country sustainability priorities and performance at www.sabmiller.com/sam Supporting small-scale retailers Since its launch three years ago, our 4e Path to Progress programme in Latin America has provided over 20,000 small retailers – “tenderos” – with business and leadership training, in partnership with the Inter-American Development Bank (IADB) and FUNDES. Participating tenderos have reported a 13% average sales growth in the year post training. During the year we broadened the programme to include access to micro-finance and technology. Delivering on our sales strategy A transformation of our Latin American sales operation is yielding increased efficiency, cost savings and stronger customer relationships. The establishment of a network of customer interaction centres (CICs) serving Colombia, El Salvador and Ecuador has been central to the change. The CICs provide centralised telesales, customer service and collections and are a linchpin between the field sales force and the rest of the business. They have enabled the transition of our sales approach from one reliant on third party distributors, wholesalers and manual ordering, to a sophisticated, digitally-enabled direct service model with automated ordering. 1 On an adjusted like for like basis. STRATEGICREPORT 21SABMiller plc Annual Report 2016
  • 26.
    Where we operateLager volumes 50.8m hl +5% +8% Soft drinks volumes 37.8m hl Significant business with production operations Associates +11% 1 Group NPR US$6,781m +11% 1 EBITA US$1,708m Drive superior topline growth through our brands: In the affordable category, Impala, our cassava-based beer, and Eagle were the main drivers of growth; Castle Lite continued to grow strongly, which helped to drive premium segment growth of 11% for our subsidiaries; and Our innovation pipeline delivered double digit growth for our premium flavoured beer Flying Fish, along with the successful pan-African launch of our premium, single malt beer Carling Blue Label. AFRICA 22 SABMiller plc Annual Report 2016 3.5hl water/hl beer 1 Organic, constant currency basis. This year our breweries in Africa improved their water efficiency by 6%, using on average 3.5hl of water to produce 1hl of beer. 22 SABMiller plc Annual Report 2016 STRATEGIC REPORT |Operations review
  • 27.
    Financial summary Reported 2015 Net acquisitions and disposals Currency translation Organic growth Reported 2016 Organic, constant currency growth % Reported growth % GroupNPR (including share of associates) (US$m) 7,462 43 (1,519) 795 6,781 11 (9) EBITA1 (US$m) 1,907 8 (423) 216 1,708 11 (10) EBITA margin (%) 25.6 25.2 Sales volumes (hl 000) Lager 48,413 41 2,349 50,803 5 5 Soft drinks 34,901 1 2,884 37,786 8 8 Other alcoholic beverages 7,618 (2) 158 7,774 2 2 Total beverages 90,932 40 5,391 96,363 6 6 1 In 2016 before a net exceptional charge of US$422 million, being impairments and related charges of US$508 million arising from Angola and South Sudan, net of the group’s US$86 million share of a gain recognised as a result of Castel’s operations in Tunisia being reclassified from an associate to a subsidiary following the acquisition of additional shares (2015: net exceptional credit of US$45 million, being additional profit on disposal of a business in 2012). In Africa, group NPR grew by 11% on an organic, constant currency basis (down 9% on a reported basis), reflecting beverage volume growth of 6% supported by our affordability strategy, selective price increases and continued premiumisation in South Africa. On an organic, constant currency basis, our subsidiaries achieved volume and NPR growth of 8% and 12%, respectively, with increased topline momentum in the year, notwithstanding increased currency and economic volatility in the second half. Our associate, Castel, delivered more modest growth, predominantly due to very challenging macro-economic conditions in its key market of Angola. The Castle Lite brand continued to grow strongly, which helped to drive premium segment growth of 11% for our subsidiaries in the region and increased premium mix. Our strategy of price moderation assisted the growth in the mainstream segment while in the affordable category, Impala, our cassava- based beer, and Eagle were the main drivers of growth. Our innovation pipeline delivered double digit growth for our premium flavoured beer Flying Fish, along with the successful pan-African launch in the second half of the year of our premium, single malt beer Carling Blue Label. Soft drinks volumes increased by 8%, against a strong comparative. Traditional beer volumes returned to growth in the second half which resulted in growth of 1% for the full year. Chibuku Super grew by double digits driving its share of our traditional beer volumes to 27%. Our regional performance reflected our focus on cost management, premiumisation and the introduction of more affordable pack sizes.” Mark Bowman Managing Director, SABMiller Africa 23SABMiller plc Annual Report 2016 STRATEGICREPORT 23SABMiller plc Annual Report 2016
  • 28.
    Bringing Africans together CastleLager has been bringing Africans together for over 120 years, since the days of gold prospecting in Johannesburg. Today Castle Lager is brewed in nine African countries and exported to many more. This cross-continental success reflects our strategy of establishing consistent regional brands across Africa. This has led us to align the brand’s recipe, packaging and brand foundation, to launch a powerful African marketing campaign, ‘It all comes together with a Castle’, and to sponsor the COSAFA Castle Football Cup in southern Africa for the coming five years. During the year, Castle Lager achieved a 9% increase in volumes in South Africa, and 8% growth on the rest of the continent. EBITA grew by 11% on an organic, constant currency basis (down 10% on a reported basis), with EBITA margin expansion of 10 bps constrained by the performance of our associates. The depreciation of key currencies against the US dollar created significant pressure on raw material input costs which was only partially offset by efficiencies achieved in manufacturing and distribution. Our regional performance reflected our focus on cost management, premiumisation and the introduction of more affordable pack sizes. On a reported basis, EBITA margin declined by 40 bps primarily due to the depreciation of the South African rand, Tanzanian shilling and euro against the US dollar (the euro being Castel’s functional currency). In South Africa, group NPR grew by 10% on an organic, constant currency basis, supported by selective pricing and premiumisation against a tough economic backdrop in which consumers’ disposable income continued to be under pressure. Beverage volumes increased by 6% and lager volumes grew by 2%, with share gains across the beer and total alcohol markets. This was driven by our premium brand volume growth of 13%, led by Castle Lite and Castle Milk Stout. Volumes of our mainstream lager brands declined by 1% driven by Hansa Pilsener, partially offset by the growth of Castle Lager. In the flavoured beer segment there were strong performances from Redd’s and Brutal Fruit. Soft drinks volume growth of 10% in an increasingly promotion-driven trading environment was supported by robust growth of 17% in the second half, which benefited from hot weather over the peak trading period. Our focus on manufacturing and distribution efficiencies, together with fixed cost productivity in the SAB beer business, partially offset the impact of adverse currency on raw materials and resulted in double digit EBITA growth on an organic, constant currency basis. In Tanzania, group NPR grew 5% on a constant currency basis with beverage volume growth of 7%. Lager volumes grew by 7% with strong growth in the affordable segment led by Eagle, as well as the expansion into draught and smaller pack sizes of Balimi. Other alcoholic beverages grew by 3%, spurred by the growth of Chibuku Super, partially offset by a subdued performance from wines and spirits. Profitability was adversely impacted by the growth of the affordable segment and traditional beer, the decline in wines and spirits, transactional foreign exchange pressure on raw materials, and increased employee costs. In Mozambique, a 20% increase in group NPR on a constant currency basis reflected beverage volume growth of 12%, together with positive pack and category mix. Lager volume growth of 15% was led by the Impala brand, together with strong growth of our mainstream brand 2M, primarily in the can format. Other alcoholic beverages declined by 29% due to competition from informal wines and spirits. EBITA growth on an organic, constant currency basis was driven by the topline performance, while margins declined driven by the adverse transactional foreign exchange impact on the cost base. In Zambia, group NPR grew by 23% on a constant currency basis with beverage volume growth of 10% driven by lager volumes up 30%, against a soft comparative. Lager volume growth benefited from price reductions at the beginning of the financial year in anticipation of the excise duty decrease which became effective in January 2016, together with the strong performance of Castle Lite in the premium segment and Eagle in the affordable segment. Following pricing taken earlier in the year, soft drinks volumes returned to growth in the second half to end the year with volume growth of 1%. Traditional beer volumes grew by 5% driven by double digit growth in Chibuku Super. Group NPR in Nigeria grew by 31% on a constant currency basis with volume growth of 27%. Continued strong growth in our mainstream lager brands, Hero and Trophy, was underpinned by our expanded distribution footprint, supported by increased capacity and enhanced market execution. Our non-alcoholic malt beverage category also remained strong with double digit volume growth driven by Beta Malt. On an organic, The right ingredients for affordable success Our strategy of creating affordable beers in Africa by using local crops has allowed us to grow the beer category. It has also supported thousands of subsistence farmers, increased government excise revenues and helped towards reducing the consumption of harmful illicit alcohol. In Uganda, our Eagle Extra lager uses locally-grown sorghum rather than imported malted barley. The brand is a major part of the country’s affordable segment and grew volumes by 15% during the year. In Mozambique, our cassava-based lager Impala has enjoyed great success since its initial launch in 2011. During the year, its volumes increased by 60%. 24 SABMiller plc Annual Report 2016 STRATEGIC REPORT |Operations review |Africa
  • 29.
    From zero toHero The swift ascent of Hero in Nigeria has delivered one of our most successful launches ever. Since it was introduced in south-east Nigeria in 2012, the lower mainstream brand has outstripped competitor brands to become the regional market leader by volume. This success reflected our identification of Hero’s characteristics – of tenacity, strength and courage – with those of the majority Igbo people. In 2015 we took Hero nationwide, with a brand promise of inspiring and recognising the hero in every Nigerian. It has already become one of the leading national brands in Nigeria. constant currency basis, EBITA growth and robust EBITA margin expansion were driven by the strong topline performance, supported by marketing and fixed cost productivity. In Botswana, group NPR grew by 5% on a constant currency basis supported by moderate pricing and favourable category mix. Beverage volumes were in line with the prior year as volume growth in lager and soft drinks of 11% and 6%, respectively, was offset by a 16% decline in traditional beer volumes due to the impact of water shortages on production. Group NPR in Ghana grew by 48% on a constant currency basis, as moderate pricing drove volume growth of 24%, and the growth of non-alcoholic malt beverage volumes, as opposed to water, led to an improved soft drinks segment mix. Non-alcoholic malt beverages delivered robust growth as the capacity increase in the prior year led to improved availability. In Uganda, group NPR grew by 20% on a constant currency basis, owing to volume growth of 14%, supported by pricing. Lager volume growth of 12% was driven by the Eagle brand family in the affordable segment. The continuing turmoil in South Sudan and the acute shortage of access to foreign exchange in the country has significantly impacted our performance in the second half of the year. As a result, we have closed the brewery and are now operating as an import business. Our associate, Castel, delivered group NPR growth of 6%. Beverage volumes were down 1%, constrained by weak economic fundamentals in Angola where the local currency has devalued substantially and there is limited access to foreign currency. Beverage volumes in Angola were down 19%, driven by the 18% decline in lager volumes, and contributed to a double digit decline in EBITA. Castel has undertaken an impairment review in Angola and has scaled back activity significantly. The resultant impairment of our investment in BIH (Angola), together with our share of Castel’s impairment of its operations in Angola, has been treated as exceptional. Excluding Angola, Castel’s volumes were up mid single digits driven by double digit growth in the Republic of Congo, Madagascar, and Burkina Faso. During the year, Castel increased its interest in its Tunisian operation, gaining control of the business and resulting in a reclassification of the operation from an associate to a subsidiary. We have treated our share of the gain recognised on the change of control as exceptional. Accelerating growth and social development is one of our top priorities in Africa. Through our Go Farming strategy, we are working with smallholder farmers to source affordable crops that can be used for brewing. This year we also rolled out a retailer programme and to date have trained over 9,000 small shopkeepers and bar owners across 13 African countries in business management and responsible retailing. Read more about how we are supporting retailers in Africa at www.sabmiller.com/africaretailersupport We aim to create a healthy and positive work environment. Our African Wellness Development Programme focuses on health issues such as HIV/Aids and malaria. We train employees to educate their peers by promoting prevention, testing and treatment and reducing stigma. We provided free voluntary counselling and testing for 56% of employees in the last year in countries where HIV/Aids has a high prevalence (defined as greater than 5% of the population). Read more about regional and country sustainability priorities and performance at www.sabmiller.com/sam Tackling water scarcity Across Africa, water scarcity limits growth and opportunities for millions of people. A number of our breweries also face material water supply challenges, ranging from availability to quality. Almost all of our breweries have now assessed their value at risk, determined the specific nature of water risks, and developed action plans to address them, often through partnerships. In South Africa, for example, drought is placing even greater pressure on scarce water resources. We play a leading role in the Strategic Water Partners Network (SWPN), through which government and the private sector are working together to address pressing water challenges. Read more about how we are partnering to tackle water risk on page 50. STRATEGICREPORT 25SABMiller plc Annual Report 2016
  • 30.
    ASIA PACIFIC In India, wehave worked with more than 18,000 farmers beyond our value chain to reduce water use and increase productivity. Increased productivity for 18,000 farmers Where we operate Significant business with production operations Associates Selling operations and major export markets +3% 1 Group NPR US$3,650m +13% 1 EBITA US$753m Lager volumes 70.3m hl -1% Drive superior topline growth through our brands: Australia: Premium lager volume growth of 16% was led by Great Northern, together with the sustained double digit growth of Peroni and Yak brand families; and China: Snow Brave the World continued to grow by double digits and now represents over 20% of CR Snow’s total volume, and over 27% of NPR. 26 SABMiller plc Annual Report 2016 1 Constant currency basis. 26 SABMiller plc Annual Report 2016 STRATEGIC REPORT |Operations review
  • 31.
    In Asia Pacific,group NPR grew by 3% on a constant currency basis (down 6% on a reported basis). The beverage volume decline of 1% was offset by group NPR per hl growth of 4% reflecting a combination of price increases supported by positive mix. EBITA grew by 13% on a constant currency basis (down 2% on a reported basis). EBITA margin expanded by 200 bps on a constant currency basis, reflecting topline growth and continued cost optimisation across the region. On a reported basis, the EBITA margin expansion was reduced to 70 bps owing to the relative weighting of the Australian operation to the regional results and reflecting the depreciation of the Australian dollar against the US dollar during the year. In Australia, group NPR growth of 4% on a constant currency basis was driven by NPR per hl growth of 3% with price increases complemented by premiumisation as a result of the shift into premium and contemporary brands. Volumes were marginally up on the prior year, with improved momentum in the second half, up 3%. This performance was underpinned by improved customer relationships, excellent execution as well as product innovation. As a result, we outperformed our key competitors in a market where the rate of decline has been more muted. Financial summary Reported 2015 Net acquisitions and disposals Currency translation Organic growth Reported 2016 Organic, constant currency growth % Reported growth % Group NPR (including share of associates) (US$m) 3,867 – (328) 111 3,650 3 (6) EBITA1 (US$m) 768 – (116) 101 753 13 (2) EBITA margin (%) 19.9 20.6 Sales volumes (hl 000) Lager 71,181 – (926) 70,255 (1) (1) Other alcoholic beverages 93 – (5) 88 (6) (6) Total beverages 71,274 – (931) 70,343 (1) (1) 1 In 2016 before net exceptional credits of US$29 million being integration and restructuring credits (2015: net exceptional charges of US$452 million being US$139 million of integration and restructuring costs and impairments of US$313 million). The beverage volume decline of 1% was offset by group NPR per hl growth of 4% reflecting a combination of price increases supported by positive mix.” Ari Mervis Managing Director, SABMiller Asia Pacific 27SABMiller plc Annual Report 2016 STRATEGICREPORT 27SABMiller plc Annual Report 2016
  • 32.
    During the yearwe focused on rebalancing the portfolio, leveraging the consumer switch from classic to contemporary and premium segments. Premium lager segment volume growth of 16% was led by strong momentum in Great Northern in our contemporary portfolio, together with the sustained double digit growth of the Peroni and Yak brand families. The successful relaunch of our premium brand Pure Blonde in June 2015 supported our expansion of the category. Our classic mainstream brands Victoria Bitter and Carlton Draught continued to decline, in line with segment trends, although this was partially mitigated by the strong performance of Carlton Dry. EBITA growth and EBITA margin expansion, on a constant currency basis, reflected the topline performance coupled with our continued cost control discipline. The focus on cost optimisation throughout the year included improving production and logistic efficiencies as well as the streamlining of back office processes. In China, on a constant currency and underlying, like-for-like basis1 compared with the prior year, group NPR grew by 4% and group NPR per hl grew by 6%, which reflected the continued roll out of one-way packaging and the continuing focus on premiumisation. Growth in group NPR and group NPR per hl was 1% and 3%, respectively, on a constant currency basis. Volumes were down 2% primarily due to tough industry and macroeconomic headwinds, in a market that declined by mid single digits for the second consecutive year. In the full year, we recognised our share of a nine month reclassification undertaken by our associate, CR Snow, of certain discounts from selling expenses to group NPR in its results for the 12 months ended 31 December 2015, without a prior period adjustment. The reclassification was within the income statement and had no impact on profits. 1 Excluding the reclassification undertaken by our associate referred to above. Building the world’s biggest beer Just over two decades ago, Snow was a small local brand in northern China; today it is the world’s biggest selling beer. In building CR Snow, our partnership of 22 years with China Resources Beer (Holdings) Co Ltd, the joint venture followed a clear, long-term strategy. It initially focused on creating regional strongholds, acquiring brewers and brands in high growth areas. It then moved to establishing Snow as a national mainstream brand, becoming number one by sales volume in China in 2005 and globally in 2008. On then turning its ambitions to premium sales, its extremely successful Snow premium variants such as Snow Golden Draft and Snow Brave The World have delivered strong growth and now account for 23% of Snow’s total volumes. Australia embraces the Great Northern taste Our Australian brand Great Northern has built on its outstanding regional performance with a successful national launch. Great Northern became the fourth biggest lager in Queensland within five years of its 2010 state debut, taking significant share from the market leader. We have successfully identified Great Northern with an authentic outdoor lifestyle that is ‘off the map, off road and off shore’. Having developed the brand’s strong regional base and identity, in February 2015 we started the national rollout of Great Northern Super Crisp, a lower alcohol variant. This year volumes of the Great Northern brand grew by 121%. 28 SABMiller plc Annual Report 2016 STRATEGIC REPORT |Operations review |Asia Pacific
  • 33.
    CR Snow maintainednational leadership as a result of being well represented in the growth segments of the on-premise channel, with good penetration of night outlets in targeted cities through a full portfolio of premium brands, particularly Snow Brave the World and Snow Draft. CR Snow also grew strongly in the off-premise channel with notable growth in cans. Snow Brave the World, which was launched in 2008, continued to grow by double digits and now represents over 20% of CR Snow’s total volume, and over 27% of NPR. EBITA growth and margin expansion were achieved through focused management of sales costs together with reduced overheads in the face of the industry downturn. In India, group NPR grew by 7% on a constant currency basis driven by group NPR per hl growth of 6% due to price increases across several states along with strong growth in the premium segment. Commercial initiatives, including the repositioning of core mainstream brands and Foster’s, supported volume growth of 1%. Profitability improved with growth in the topline supported by tight cost control and improved efficiencies. Reducing water risk Managing water scarcity is a key priority across the region, particularly in India where demand exceeds supply and quality is declining. The root of the problem is in agricultural water use, so, with partners, we have worked with more than 18,000 farmers beyond our value chain to reduce water use while increasing productivity and income. We aim to demonstrate best farming and water management practices that can be replicated and scaled by others, including government, to make a meaningful impact on India’s water scarcity challenge. Read more about how we are tackling water risk in India at www.sabmiller.com/indiawater In India, more than 90% of our sales are in returnable glass bottles. We previously used industry-standard bottles that were shared with other brewers and returned through a highly informal system. We have now introduced patented bottles that we have the sole right to use. These are designed to use fewer, lighter materials and to last longer, so have enabled us to increase re-use rates by 10%, reduce carbon emissions, and create new incomes for bottle collectors, many of whom are women. At the same time, this has helped to save costs and promote our brands. Millions of consumers enjoy our beers, but a minority drink irresponsibly, posing risks to themselves and others. In Australia, we support DrinkWise, which aims to encourage a healthy and safe drinking culture. In the year its ground- breaking How to Drink Properly campaign, aimed at 18 to 24 year-olds, reached more than seven million people. Find out more at www.howtodrinkproperly.com Read more about regional and country sustainability priorities and performance at www.sabmiller.com/sam Lazy Yak wakes up the market We have gained a larger slice of Australia’s expanding craft beer segment with the successful launch of Lazy Yak, an easy drinking variant of our primary Australian craft brand, Fat Yak. The July 2015 introduction of Lazy Yak reflects our strategy to drive innovation within Australia’s craft beer segment. In its first six months, Lazy Yak exceeded all expectations to become our most successful craft launch in Australia. Its gains did not affect the performance of Fat Yak, which continued to grow throughout the year in both the on- and off-premise channels, with volumes up 21%. STRATEGICREPORT 29SABMiller plc Annual Report 2016
  • 34.
    EUROPE Many of ourmarkets in Europe now produce non-alcoholic beers to offer consumers an alternative to alcoholic beer for different occasions. 11 non-alcoholic beer brands +2% Soft drinks volume 15.8m hl +2% 1 Group NPR US$3,832m Drive superior topline growth through our brands: Subsidiary NPR and volumes both grew by 1% on an organic, constant currency basis; and Continued focus on expanding the beer category, with innovations in brand variants driving growth in Birell, our non-alcoholic lager in the Czech Republic. Lager volumes 43.1m hl -1% +5% 1 EBITA US$636m Significant business with production operations Associates Selling operations and major export markets 30 SABMiller plc Annual Report 2016 1 Organic, constant currency basis. 0%abv Where we operate 30 SABMiller plc Annual Report 2016 STRATEGIC REPORT |Operations review
  • 35.
    In Europe, groupNPR grew by 2% on an organic, constant currency basis (down by 13% on a reported basis). On both a reported and an organic basis, beverage volumes were in line with the prior year with a 1% decline in lager volumes offset by growth of 2% in soft drinks volumes. Subsidiary NPR and volumes were both up by 1% on an organic, constant currency basis. Following a challenging first half reflecting significant competitor activity in Poland, subsidiary topline momentum improved during the year with NPR and volume up 6% in the second half, with volume growth across all of our operations. At a regional level, the improved volume performance of our subsidiaries was held back by the relatively weaker performance in our associate, Anadolu Efes. Reported EBITA declined by 9%, with EBITA margin up 70 bps. On a constant currency basis, EBITA was up by 5% and EBITA margin increased by 60 bps. Our subsidiaries increased EBITA by 6% on an organic, constant currency basis, with the topline performance supported by cost reductions and efficiencies. Associates’ EBITA was down by 3% on an organic, constant currency basis driven by Anadolu Efes. Financial summary Reported 2015 Net acquisitions and disposals Currency translation Organic growth Reported 2016 Organic, constant currency growth % Reported growth % Group NPR (including share of associates) (US$m) 4,398 17 (656) 73 3,832 2 (13) EBITA1 (US$m) 700 4 (105) 37 636 5 (9) EBITA margin (%) 15.9 16.6 Sales volumes (hl 000) Lager 43,595 78 (526) 43,147 (1) (1) Soft drinks 15,493 – 283 15,776 2 2 Total beverages 59,088 78 (243) 58,923 – – 1 In 2015 before an exceptional charge of US$63million being the group’s share of Anadolu Efes’ impairment charge relating to its beer businesses in Russia and Ukraine. Sue Clark Managing Director, SABMiller Europe Following a challenging first half reflecting significant competitor activity in Poland, subsidiary topline momentum improved during the year with NPR and volume up 6% in the second half, with volume growth across all of our operations.” 31SABMiller plc Annual Report 2016 STRATEGICREPORT 31SABMiller plc Annual Report 2016
  • 36.
    Keepers of thecraft We have strengthened Pilsner Urquell’s premium brand positioning by underpinning its proud heritage with innovation. As demand for craft beer grows, we have reinforced the 173-year-old brand’s status as the original and authentic pilsner, brewed by Czech brew masters in the time-honoured way with the same recipe and quality ingredients. We have also enhanced the way in which we ship and serve the brand to ensure its unique taste is preserved. Fresh, unpasteurised Pilsner Urquell is now available in over 300 on-premise ‘Tankovnas’, with three-quarters in the Czech Republic and the rest across eight other European markets. In the Czech Republic and Slovakia, group NPR grew by 3% on a constant currency basis with beverage volumes up by 1%. The business grew through a continued focus on sales execution and supported by favourable weather throughout the year. Growth in Pilsner Urquell offset the decline of our mainstream brand Gambrinus 10. We continued to focus on expanding the beer category, with innovations in brand variants driving growth in Birell, our non-alcoholic lager which penetrates soft drinks occasions. In the Czech Republic, our volume share of the beer market increased by 10 bps. In Slovakia, we lost 120 bps of share on the same basis. In Poland, group NPR declined by 9% on a constant currency basis. The beverage volume decline of 5% reflected significant competitor activity in the first half of the year. Initiatives launched in the second quarter to restore our competitive position, particularly that of our lower mainstream brand Zubr, and a strengthened sales model, supported lager volume growth of 6% in the second half of the year. Our volume share of the beer market declined by 150 bps, although we achieved sequential improvements in market share during the second half. EBITA and EBITA margin decreased significantly on a constant currency basis, driven by the decline in the topline which was only partially mitigated by overhead cost reductions and the optimisation of our distribution network. In the United Kingdom, group NPR grew by 5% on an organic, constant currency basis. Beverage volumes were up by 3% on an organic basis with favourable brand mix resulting from the continued growth of Peroni Nastro Azzurro which offset the planned volume decline in both Miller Genuine Draft and the Polish brand portfolio. In June, we acquired the modern craft brewer Meantime Brewing Company Ltd which delivered double digit volume growth. In Italy, group NPR was up by 7% on a constant currency basis with lager volume growth of 5%, driven by the Peroni and Nastro Azzurro brands, and supported by good weather relative to the prior year. Group NPR per hl expansion benefited from price increases in both the off- and on-premise channels in what remains a relatively low inflationary environment, coupled with focused management of discounts. In Romania, group NPR grew by 10% on a constant currency basis driven by lager volume growth of 7%, which outperformed the beer market. We achieved growth across all price segments as a result of our enhanced revenue management capabilities and supported by an exceptionally hot summer and good weather in the second half of the year. Volume growth was boosted by growth in our economy brand Ciucas, due to increased promotional activity and the success of a new convenience pack size driving favourable pack mix. From the village to the world We have transformed Kozel from a small domestic brand to a major international player. When we bought the Kozel brewery in 1999, volumes were low and the brand had no export market or presence in the on-premise channel. We carefully positioned Kozel as the epitome of village values and traditional craftsmanship, offering great taste at a fair price. We then developed a quality on-premise experience, built strong digital consumer engagement, launched premium variant Kozel 11 in the Czech Republic, and successfully built Kozel Dark internationally. Kozel is now sold in more than 40 countries and – by volume – is the best-selling Czech lager outside its home market, and the largest mainstream brand in the Czech Republic. 32 SABMiller plc Annual Report 2016 STRATEGIC REPORT |Operations review |Europe
  • 37.
    Read more aboutBirell at www.sabmiller.com/birell In Europe we continue to focus on improving efficiency in our breweries and value chains. Our regional water and energy reduction taskforce, which shares best practice and mentors efficiency champions, played a key role in making Europe our first region to achieve an average water efficiency of 3.0 hl of water per 1 hl of beer. Read more at www.sabmiller.com/nowaternobeer By engaging with consumers on shared concerns we strive to deliver societal benefits while driving topline growth. In Italy, where unemployment reached 44% among 18-24 year olds in 2015, Nastro Azzurro’s Ti Porta Lontano (Takes You Further) programme helps connect young entrepreneurs with mentors, creating a network of peers and business people to share knowledge and advice. Read more about how we are engaging with consumers on sustainability on page 50. Read more about regional and country sustainability priorities and performance at www.sabmiller.com/sam Growing the non-alcoholic beer alternative Many of our European markets now produce non-alcoholic beer to offer consumers an alternative to alcoholic beer for different occasions. In the Czech Republic, our Birell brand has defined the category, and sales have more than quadrupled between 2001 and 2015. The brewing process is identical to that for lager, but with a yeast which does not produce alcohol, which means that the taste appeals to beer lovers. Birell has twice been judged the best non-alcoholic beer in the Czech Beer Awards. We have extended the Birell range with real fruit juice mixes, further broadening the brand’s appeal. In the Netherlands, group NPR increased by 3% on a constant currency basis with lager volume growth of 5%. Our performance reflected improved execution in the off- premise channel and was further boosted by the success of Grolsch brand innovations and extensions. In Hungary, group NPR increased by 11% on a constant currency basis with lager volume growth of 6% and selective pricing on premium and economy brands. Our associate, Anadolu Efes, continued to be affected by economic and political instability in its key lager markets. Total beverage volumes decreased by 3%, with the volume decline in lager partly offset by growth in soft drinks volumes. The lager volume weakness was mainly driven by continuing challenges in Ukraine, Russia, and Turkey. Group NPR per hl improved as a result of price increases and favourable mix. EBITA was down by 9% owing to currency headwinds driving up raw material input costs and despite a continuous focus on cost optimisation and improved efficiencies. Delivering style and substance In the UK, we are making Peroni Nastro Azzurro even more desirable by inspiring consumers to embrace Italian style. We focus on delivering sustainable long-term growth by building the premium positioning of the brand, which remains a genuine import from Italy, with the highest quality ingredients, craftsmanship and superior taste. By evolving Peroni Nastro Azzurro in an innovative way we continue to perform ahead of the UK beer market, adding value to the category and our customers. We work with established and rising Italian creative talents through The House of Peroni platform to create compelling content which brings customers and consumers closer to the brand. STRATEGICREPORT 33SABMiller plc Annual Report 2016
  • 38.
    34 Where we operate Lager volumes 38.0mhl -1% 0% Group NPR US$4,675m Drive superior topline growth through our brands: Miller Lite growth momentum improved in the second half reflecting the continuing emphasis on the brand’s authenticity and originality; In the above premium segment, the Redd’s brand family grew volumes by high single digits for the year; and Both the Blue Moon brand family and the Leinenkugel’s portfolio grew volumes by low single digits for the year. +1%EBITA US$865m Zero landfill SABMiller plc Annual Report 2016 This year, MillerCoors achieved landfill-free operations at all major breweries. Since 2009, MillerCoors has reduced its waste across the organisation by 89%. Significant business with production operations Selling operations and major export markets 34 SABMiller plc Annual Report 2016 STRATEGIC REPORT |Operations review
  • 39.
    35 The North Americasegment includes our 58% share of MillerCoors and 100% of Miller Brewing International and our North American holding companies. On a reported basis, total North America EBITA was up by 1% and EBITA margin increased 20 bps. EBITA growth and EBITA margin expansion of 80 bps in MillerCoors was offset by increased marketing and fixed cost investment to support the expansion of our international operations in Brazil and Canada, following changes to our route to market in both countries. MillerCoors MillerCoors’ group NPR declined by 1% on an organic basis as growth in group NPR per hl of 1%, driven by net pricing and supported by favourable sales mix, was offset by lower volumes, with domestic sales to wholesalers (STWs) down by 2%. Domestic sales to retailers (STRs) were also down by 2%. EBITA increased by 3% on an organic basis as improved group NPR per hl and lower input costs more than offset higher marketing investment and cost inflation. EBITA growth and EBITA margin expansion of 80 bps in MillerCoors was offset by increased marketing and fixed cost investment to support the expansion of our international operations in Brazil and Canada.” Financial summary Reported 2015 Net acquisitions and disposals Currency translation Organic growth Reported 2016 Organic, constant currency growth % Reported growth % Group NPR (including share of joint ventures) (US$m) 4,682 1 (1) (7) 4,675 – – EBITA1 (US$m) 858 – 1 6 865 1 1 EBITA margin (%) 18.3 18.5 Sales volumes (hl 000) Lager – excluding contract brewing 38,508 6 (554) 37,960 (1) (1) Soft drinks 40 – (1) 39 (3) (3) Total beverages 38,548 6 (555) 37,999 (1) (1) MillerCoors’ volumes Lager – excluding contract brewing 37,154 6 (781) 36,379 (2) (2) Sales to retailers (STRs) 36,967 n/a n/a 36,217 n/a (2) ¹ In 2016 before exceptional charges of US$68 million, being the group’s share of MillerCoors’ restructuring costs. Gavin Hattersley Chief Executive Officer, MillerCoors SABMiller plc Annual Report 2016 STRATEGICREPORT 35SABMiller plc Annual Report 2016
  • 40.
    Premium light STRsdeclined by low single digits, although MillerCoors has gained share of the segment for the last four consecutive quarters. Miller Lite growth momentum improved in the second half, to end the full year in line with the prior year. This performance reflected the continuing emphasis on the brand’s authenticity and originality, further evidenced through the success of the limited edition release of the Steinie bottle. Coors Light declined by low single digits for the year, with improved performance in the fourth quarter supported by a new marketing campaign. STRs in the above premium segment were only marginally up, as the successful launch of Henry’s Hard Soda in the fourth quarter largely offset the double digit decline of Miller Fortune, which has been deprioritised. The Redd’s brand family increased by high single digits although volumes declined by low single digits in the fourth quarter as the brand family is now cycling strong comparatives. Both the Blue Moon brand family and the Leinenkugel’s portfolio were up low single digits for the year. The below premium portfolio declined by mid single digits with both Keystone Light and Milwaukee’s Best down high single digits and Miller High Life down by mid single digits. This was partially offset by Steel Reserve which grew by low single digits owing to the continuing success of the Alloy Series, the brand’s line of flavoured malt beverages. Putting the fizz into FMBs The impressive national launch of Henry’s Hard Sodas has re-inforced MillerCoors’ lead in the fastest growing segment in the US beer market – flavoured malt beverages (FMBs). At the year-end, just three months after their introduction, Henry’s Hard Sodas’ two launch flavours, Hard Ginger Ale and Hard Orange Soda, already represented more than 7% of the FMB market in the USA. Steel Reserve Alloy Series, the successful economy FMB brand, grew volume sales by 60% during the year. Redd’s also continued to grow strongly, led by Redd’s Green Apple and the higher alcohol Redd’s Wicked range. Leinenkugel’s shandies continue to sparkle Nine out of 10 US shandy-style beers sold are from MillerCoors’ Leinenkugel’s brand. ‘Leinie’ shandies continued to perform strongly in the USA in the year, with volumes growing by 16%. The advance was led by the brand’s seasonal Summer Shandy, which was the summer’s fastest-selling national craft brand. New Leinenkugel variants also had a significant impact, particularly the autumn launch Harvest Patch Shandy which was the year’s second-fastest selling seasonal craft brand in the USA. Grapefruit Shandy, which was the previous year’s most successful craft launch, continued to sell so well it will now be available all year round. 36 SABMiller plc Annual Report 2016 STRATEGIC REPORT |Operations review |North America
  • 41.
    Reducing waste In theyear MillerCoors achieved landfill-free operations at all major breweries. Since 2009 MillerCoors has reduced its waste across the organisation by 89%, equal to keeping more than 4,000 tonnes of waste out of local landfills. During the year MillerCoors also launched the largest solar array installed at any US brewery. This generates enough energy to brew approximately 600,000 hl of beer annually. The lower cost of commodities and production process efficiencies resulted in a low single digit decrease in input costs per hl. The business invested in additional marketing activities, particularly media, to support the growth of key brands and the launch of Henry’s Hard Soda. In September 2015, MillerCoors announced plans to close the brewery in Eden, North Carolina with an effective closure date of September 2016. Restructuring costs, including accelerated depreciation and severance costs, will continue to be recognised as exceptional. MillerCoors defines sustainability as making a positive and meaningful impact on the social, environmental, and economic issues that affect its business, employees and other stakeholders. MillerCoors has a 2020 goal to encourage 20 million consumers to make a pledge against drink driving, and is actively encouraging people to take a safe ride home. This includes a national partnership with the taxi app Uber, which has provided almost 23,000 rides to purchasers of MillerCoors’ beers. Read more at www.greatbeergreatresponsibility.com MillerCoors celebrates the diversity of its workforce and remains dedicated to fostering a diverse and inclusive workplace. One of MillerCoors’ 2020 goals is for women to comprise 35% of management. In 2015, 99% of MillerCoors’ leadership completed unconscious bias training, a bespoke programme developed and provided by the MillerCoors University – the educational arm of the company. Read more about regional and country sustainability priorities and performance at www.sabmiller.com/sam The authentic Miller Lite Miller Lite stays true to itself – just like those who drink it. This message of authenticity is core to the 40-year-old brand’s new US advertising campaign, which centres on a ‘bodega’ or corner shop and its distinctive Miller Lite customers. Authenticity was also central to MillerCoors’ successful turnaround of the brand, the original US light beer, after seven years of declining sales. MillerCoors introduced a new Miller Lite visual identity inspired by its original packaging, put product quality at the core of communication, and made each consumer touchpoint, from packaging to sponsored concerts, a means of engagement. STRATEGICREPORT 37SABMiller plc Annual Report 2016
  • 42.
    Finance review Domenic DeLorenzo Chief Financial Officer Financial highlights – The depreciation of key currencies against the US dollar had a significant negative impact on the translation of reported results – Group net producer revenue (NPR) declined 8% to US$24,149 million but increased by 5% on an organic, constant currency basis; revenue down 10% to US$19,833 million – Total volumes of 331 million hl grew by 2%, with subsidiaries volumes up 5% – EBITA of US$5,810 million, a decrease of 9% on the prior year, up 8% on an organic, constant currency basis – EBITA margin contracted marginally (down 10 bps) on the prior year, up 60 bps on an organic, constant currency basis – Exceptional charges amounted to US$721 million, principally relating to the impairment of our investments in Angola and South Sudan, together with costs associated with the AB InBev transaction. – Adjusted profit before tax of US$5,295 million, a decrease of 6%; profit before tax of US$4,074 million, down 16% on the prior year due to the adverse currency translational effect and higher exceptional charges – Adjusted EPS of 224.1 US cents, a 6% decrease; adjusted EPS in constant currency grew by 12%; basic EPS of 167.8 US cents, down 18% – Total dividend for the year of 122 US cents per share, up 8% – Free cash flow of US$2,969 million was US$264 million lower than the prior year, mainly due to currency translation – Net debt of US$9,638 million, a decrease of US$827 million from the prior year; gearing down 300 bps to 40.0% and net debt to adjusted EBITDA ratio in line with the prior year at 1.6x The group’s financial goal is to deliver a higher return to our shareholders than our peer group, with an aspiration to be in the top quartile. We measure our performance against this goal by assessing total shareholder return (TSR), through growth in adjusted EPS, on both reported and constant currency bases, and free cash flow. In the five years to 31 March 2016 we achieved a TSR of 115%, compared with the median of the comparator group of 102%, as measured in accordance with the terms of our value share awards. The differential between the two of 13 percentage points is our TSR key performance indicator as shown on page 15. We disclose certain results on an organic, constant currency basis to exclude the effects on our results of changes in exchange rates on the translation of results into US dollars and of acquisitions net Net debt of US$9,638 million, a decrease of US$827 million from the prior year; gearing down 300 bps to 40.0% and net debt to adjusted EBITDA ratio in line with the prior year at 1.6x.” We achieved adjusted EPS growth in the year of 12% on a constant currency basis, as a result of increased group NPR, efficiency savings and lower finance costs. However, after reflecting the adverse translational impact of foreign exchange rate movements, reported adjusted EPS declined by 6%.” 38 SABMiller plc Annual Report 2016 STRATEGIC REPORT
  • 43.
    of disposals. Weconsider that using this basis provides a better relative measure of the underlying operating performance and trends, and allows for greater comparability between operations, particularly in times of significant volatility in foreign currency exchange rates as experienced in the year. We achieved adjusted EPS growth in the year of 12% on a constant currency basis, as a result of increased group NPR, efficiency savings and lower finance costs. However, after reflecting the adverse translational impact of foreign exchange rate movements, reported adjusted EPS declined by 6%. Adjusted EPS on a constant currency basis and excluding the prior year net earnings impact of the disposal of our investment in Tsogo Sun Holdings Ltd (Tsogo Sun) was also up 12% on the prior year. Free cash flow at US$2,969 million was robust but was US$264 million lower than the prior year, mainly as a result of the adverse currency translation impact. Accounting policies The principal accounting policies used by the group are shown as note 1 to the consolidated financial statements. The accounting policies followed are the same as those used in the prior year except for the new IFRS interpretations and amendments adopted by the group since 1 April 2015, which have had no material impact on the consolidated results of operations or financial position of the group, as detailed in note 1 to the consolidated financial statements. In addition, note 1 to the consolidated financial statements details the areas where a high degree of judgement has been applied in the selection of a policy, an assumption or estimates used. We have reconsidered the judgements and estimates applied, in particular the determination of exceptional items and share-based compensation, where we have not assumed the completion of the AB InBev transaction. We have included an additional area of judgement with regard to share-based compensation, particularly in relation to judgements made about the extent and timing of the vesting of awards. These areas of judgement are aligned with those considered by the audit committee and which are reported within the audit committee report on pages 70 to 73. Key performance indicators (KPIs) We use a range of KPIs to monitor progress against our strategy and our financial goal, as noted on page 15. Our KPIs and other performance indicators include non-GAAP performance measures to assess underlying performance. These incorporate constant exchange rates for measuring revenue and profit growth; organic measures to exclude acquisition and divestment effects; adjusted profit measures to exclude exceptional items and amortisation of certain intangible assets; and adjusted EBITDA as a key cash flow measure. Detailed definitions of these terms can be found on pages 192 and 193, and for certain items reconciliations to the nearest equivalent GAAP measure are provided below or in the notes to the consolidated financial statements. Net producer revenue (NPR) Group net producer revenue (NPR) was US$24,149 million (including our share of associates’ and joint ventures’ NPR of US$9,254 million), a decrease of 8%, as a result of the adverse impact of foreign currency movements. However, on an organic, constant currency basis, group NPR increased by 5% driven by the performance of our subsidiaries with NPR growth of 8%, particularly in our developing market operations in Latin America and Africa, with a more muted performance in our associates and joint ventures. Group NPR on an organic, constant currency basis grew in all regions except for North America, which was marginally down. Group net producer revenue US$m Components of performance 2016 (reported) Acquisitions2016 (organic) CurrencyPrice/ mix Volume20151 24,087 0.2% 24,149 (13.5)%3.4% 2.1% 26,176 1 Adjusted for disposals. As shown in the chart above, volume growth contributed a 2% improvement on the prior year group NPR. Price/mix gains added a further 3% improvement with all divisions delivering gains, through a combination of favourable brand mix, selective price increases and improved price realisation. However, currency movements during the year reduced reported group NPR by 13%, as a result of the weakening of all our key currencies against the US dollar. The impact of acquisitions was negligible on the prior year base as adjusted for disposals, which principally related to the disposal of our investment in Tsogo Sun. Group revenue, which includes excise and our share of our associates’ and joint ventures’ revenue on the same basis, declined broadly in line with group NPR (down 9%), while statutory revenue, which relates only to the revenue of our subsidiaries, decreased by 10%, with the declines driven by the adverse currency translation effect. Both increased on an organic, constant currency basis. Group NPR per hl decreased by 10% on a reported basis and increased by 3% on an organic, constant currency basis, with the primary reason for the difference being the impact of the depreciation of our key currencies. On an organic, constant currency basis all divisions recorded group NPR per hl growth as a result of favourable brand mix, selective price increases and improved price realisation. Volumes Good volume performance was delivered particularly from our developing market operations in Latin America and Africa, with growth of 5% and 6% respectively on both reported and organic bases. Volumes in Asia Pacific and North America were down 1% as a result of tough industry and macro-economic headwinds in China and the USA, while in Europe volumes were in line with the prior year. Total volumes grew by 2% compared with the prior year on both organic and reported bases. Lager volumes increased by 1% and soft drinks volumes grew by 6% compared with the prior year, with similar rates of growth on both organic and reported bases. On a subsidiaries only basis, excluding our share of our associates’ and joint ventures’ volumes, total volumes grew by 5%. Total volumes in our associates and joint ventures decreased by 2% with Anadolu Efes, Castel and MillerCoors experiencing volume declines. STRATEGICREPORT 39SABMiller plc Annual Report 2016
  • 44.
    Reported Organic 2016 hl m 2015 hlm % change % change Total volumes 331 324 2 2 Lager volumes 249 246 1 1 Soft drinks volumes 74 70 6 6 Subsidiaries’ volumes 197 188 5 5 Associates’ and joint ventures’ volumes 134 136 (2) (2) The following chart shows organic growth in total beverage volumes for each of the last five years. Total beverages: organic volume growth % 20162015201420132012 2.1 1.41.6 3.5 3.7 Input costs Costs of goods sold (including our share of MillerCoors’ costs of goods sold) increased by approximately 2% on a constant currency per hl basis. Raw material input costs increased by 1%. This reflected the impact of transactional foreign exchange from the depreciation of local currencies in Africa and Latin America, higher prices for adjuncts and sugar, as well as adverse mix effects. These were partially offset by benefits from our global procurement organisation through commercial negotiations, alternative sourcing, and cross- functional initiatives from our cost and efficiency programme, including projects such as container light weighting and expanding the use of recycled PET. Distribution costs remained below prior year levels due to lower crude oil prices and further cost and efficiency benefits from optimisation initiatives across our distribution network. We expect raw material input costs to increase by mid single digits on a constant currency per hl basis in the forthcoming financial year. This will be driven principally by increased commodity costs, as well as inflation-driven increases in packaging materials and adverse foreign exchange impacts on imported goods. These will be moderated by our forward cover positions and continuing efficiency benefits from value engineering initiatives and contract negotiations. EBITA We report EBITA (earnings before interest, tax, amortisation (excluding computer software) and exceptional items) as this is the key profit metric by which the group is managed and operating performance is evaluated internally. Segmental performance is reported after the apportionment of attributable head office service costs. We achieved EBITA growth of 8% on an organic, constant currency basis, with all divisions delivering growth. Reported EBITA (including the impact of acquisitions and disposals) declined by 9% compared with the prior year, to US$5,810 million. The depreciation against the US dollar of the key currencies in which we operate, and to a much lesser extent the disposal of our Tsogo Sun investment in the prior year, adversely impacted reported EBITA. The chart below shows the increase in EBITA for each of the last five years with each year’s growth shown in constant currency after excluding the impact of acquisitions and disposals. EBITA growth % Organic, constant currency basis The table below demonstrates our improving leverage through the income statement, with 2% volume growth, leading to 12% constant currency growth in adjusted EPS, through 5% growth in group NPR and EBITA growth of 8%, both on an organic, constant currency basis. Change compared with the prior year % 1 On a constant currency basis. 20162015201420132012 8 6 7 9 8 Adjusted EPSEBITAGroup NPRVolumes 2 2 (8) 5 (9) 8 (6) 121 Reported Organic, constant currency 40 SABMiller plc Annual Report 2016 STRATEGIC REPORT |Finance review continued
  • 45.
    EBITA margin EBITA marginat 24.1% was marginally down on the prior year. The chart below shows EBITA margin by division, with Asia Pacific, Europe and North America making particular progress with growth of 70, 70 and 20 bps respectively. However, the margins in Latin America and Africa declined by 100 and 40 bps respectively as the margins in these divisions were particularly impacted by the depreciation of our key currencies against the US dollar. Reported EBITA margin performance % GroupSouth Africa: Hotels and Gaming Retained operations North America EuropeAsia Pacific AfricaLatin America 38.6 +10-20 +200 +60 +20 +60 – +60 37.6 25.6 25.2 19.9 20.6 15.9 16.6 18.3 18.5 24.2 24.1 28.7 – 24.2 24.1 EBITA margin expansion1 bps 2015 2016 1 Organic, constant currency basis. On an organic, constant currency basis, EBITA margin improved by 60 bps, with improvements in all divisions except Latin America, which was down 20 bps compared with the prior year, as cost productivity and improved efficiencies in manufacturing and distribution only partly compensated for the currency pressure on imported raw materials. All divisions delivered organic, constant currency margin progression in excess of that on a reported basis, except for Europe, which was as a result of the Meantime acquisition. EBITDA EBITDA, which comprises EBITA plus depreciation and amortisation of computer software, including our share of associates’ and joint ventures’ depreciation and amortisation of computer software, amounted to US$7,097 million for the year, a 9% decrease on the prior year due to currency translation effects. Associates and joint ventures contributed 28% of our EBITDA. Exceptional items Items that are material either by size or nature are classified as exceptional items. Further details of these items can be found in note 4 to the consolidated financial statements. Net exceptional charges of US$721 million before tax were reported during the year (2015: US$153 million) including US$556 million (2015: US$75 million) within operating costs, US$64 million (2015: US$15 million) within finance costs and US$101 million (2015: US$63 million) related to our share of associates’ and joint ventures’ exceptional charges. The net exceptional charges included: – US$572 million of charges including impairments and related charges in Angola and South Sudan in Africa. These costs, including US$64 million within finance costs relating to foreign exchange losses and loan guarantees, all result from the decisions to scale back operations in both countries following the significant devaluations of the local currencies in Angola and South Sudan against the US dollar in the year and the lack of availability of hard currency; – US$160 million of costs associated with the AB InBev transaction, including staff-related retention arrangements and advisers’ fees; – US$36 million of charges related to the cost and efficiency programme; – US$29 million of credits related to integration and restructuring in Australia; – US$68 million share of MillerCoors’ restructuring costs relating to the Eden brewery closure; and – US$86 million share of the gain on the reclassification of Castel’s Tunisian operations from associate to subsidiary following the acquisition by Castel of additional shares. Finance costs Net finance costs were US$506 million, a 21% decrease on the prior year’s US$637 million primarily as a result of the reduction in net debt at the end of the prior financial year and during the year, partially offset by foreign exchange losses. Net finance costs in the year included net exceptional costs of US$64 million in Angola and South Sudan which have been excluded from adjusted finance costs and adjusted EPS. Adjusted net finance costs are reconciled to net finance costs in the table below. They were 29% lower than the prior year. Interest cover, on an adjusted basis, increased to 13.8 times from 10.7 times in the prior year. 2016 US$m 2015 US$m Net finance costs 506 637 Net exceptional finance costs (64) (15) Adjusted finance costs 442 622 We expect finance costs in the 2017 financial year to be broadly similar to those in 2016. STRATEGICREPORT 41SABMiller plc Annual Report 2016
  • 46.
    Tax The effective rateof tax for the year (before amortisation of intangible assets other than computer software, and exceptional items) was 26.3%, a marginal increase on the prior year. In the medium term we continue with our expectation that the effective tax rate will be between 27% and 29%. This is a level which we believe is sustainable based upon the current structure of the group and anticipated changes in the global tax environment. The effective rate of tax is calculated as the ratio of adjusted tax expense to adjusted profit before tax as shown below. 2016 US$m 2015 US$m Taxation expense 1,152 1,273 Tax on amortisation 96 117 Tax on exceptional items 28 (83) Share of associates’ and joint ventures’ taxation 114 157 Adjusted tax expense 1,390 1,464 Profit before tax 4,074 4,830 Exceptional items (excluding finance costs exceptional items) 657 138 Exceptional finance costs 64 15 Amortisation 350 423 Share of associates’ and joint ventures’ tax and non-controlling interests 150 236 Adjusted profit before tax 5,295 5,642 Effective tax rate 26.3% 26.0% The reported corporate tax expense for the year was US$1,152 million, a decrease of 10% compared with US$1,273 million in the prior year, primarily as a result of the depreciation of our key operating currencies against the US dollar. Corporate income taxes paid can differ from the annual tax charge as a result of the payment of a tax liability falling outside the financial year, and because of deferred tax accounting treatment. Uncertainty of interpretation and application of tax law in some jurisdictions also contributes to differences between the amounts paid and those charged to the income statement. The amount of tax paid in the year decreased to US$1,315 million from US$1,439 million in the prior year. The decrease was largely as a result of the depreciation of our key operating currencies against the US dollar. We are publishing an updated version of Our Approach to Tax report for 2016 which provides details of how we manage our taxes. This reflects our commitment to ensuring our reporting reflects best practice and regulatory developments. Read more about how we manage our taxes in Our Approach to Tax report Tax revenues play a key role in funding local public services and supporting vibrant communities in which we operate. We pay a significant amount of tax and in many countries we are one of the largest contributors to government income. Through our business activities, our tax contributions across the world help the development of the many economies in which we operate. In all our tax affairs, we continue to work proactively with the local tax authorities to ensure that we comply with legislation and pay the right amount of tax. Within this framework, we aim to adopt a balanced and commercial position, making decisions as transparently as possible. We recognise that tax policy and management are a significant part of running a sustainable and responsible business. Total taxes borne and collected by the group, including excise and indirect taxes, and including those related to our MillerCoors joint venture in the USA, amounted to US$9,507 million (2015: US$10,639 million) in the year, with the reduction due to the effects of currency translation. The composition and divisional analysis respectively are shown in the following charts. Tax borne and collected by category US$9,507m Excise 58% Other indirect taxes 20% Taxes on profits 12% Employment taxes 7% Tax withheld at source 2% Taxes on property 1% Tax borne and collected by region US$9,507m Developing economies (US$6,536m) Latin America 35% Africa 22% Europe 7% Asia Pacific 4% Developed economies (US$2,971m) Asia Pacific 11% Europe 11% North America 10% 42 SABMiller plc Annual Report 2016 STRATEGIC REPORT |Finance review continued
  • 47.
    Profit and earnings Adjustedprofit before tax declined by 6% compared with the prior year to US$5,295 million, primarily as a result of the adverse impact of currency depreciation more than offsetting higher volumes and improved group NPR, cost efficiencies and lower finance costs. On a statutory basis, profit before tax of US$4,074 million was 16% lower than the prior year for the reasons given above together with an increase in net exceptional charges. The table below reconciles EBITA to adjusted profit before tax and to the statutory profit before tax. 2016 US$m 2015 US$m % change EBITA 5,810 6,367 (9) Adjusted finance costs (442) (622) 29 Share of associates’ and joint ventures’ finance costs (73) (103) 29 Adjusted profit before tax 5,295 5,642 (6) Exceptional items (657) (138) (377) Exceptional finance costs (64) (15) (326) Amortisation (350) (423) 17 Share of associates’ and joint ventures’ tax and non-controlling interests (150) (236) 36 Profit before tax 4,074 4,830 (16) Adjusted earnings decreased by 6% to US$3,604 million. With the weighted average number of basic shares in issue for the year of 1,608 million, up slightly from the prior year’s 1,604 million, adjusted EPS declined in our reporting currency of US dollars but increased in British pounds and in South African rand as a result of the depreciation of the currencies, as demonstrated in the table below. 2016 2015 % change US cents 224.1 239.1 (6) UK pence 148.2 147.4 1 South African cents 3,088.8 2,649.7 17 On a constant currency basis, adjusted EPS improved by 12% compared with the prior year, and by the same percentage excluding the prior year net earnings impact of Tsogo Sun. A reconciliation of the statutory measure of profit attributable to equity shareholders with adjusted earnings is shown in note 8 to the consolidated financial statements. On a statutory basis, basic earnings per share were 18% down on the prior year primarily as a result of the adverse impact of the depreciation of our key currencies against the dollar on the translation of our results, together with higher exceptional charges. Dividends The board has proposed a final dividend of 93.75 US cents to make a total of 122 US cents per share for the year – an increase of 8% over the prior year. This represents dividend cover of 1.8 times based on adjusted earnings per share (2015: 2.1 times). The full year and the final dividend are permitted dividends within the terms of SABMiller and AB InBev’s joint Rule 2.7 announcement on 11 November 2015. The relationship between the growth in dividends per share and adjusted earnings per share is demonstrated in the chart below. Adjusted earnings per share (EPS) and dividend per share US cents 50 100 150 200 250 20162015201420132012 Adjusted EPS Dividend per share Details of payment dates and related matters are disclosed in the directors’ report. Business combinations, disposals and similar transactions In June 2015 we acquired 100% of Meantime Brewing Co Ltd, a UK modern craft brewer, as part of our strategy to drive superior topline growth and to shape our global mix to drive a superior growth profile. As noted in the Chief Executive’s review, the transaction with The Coca-Cola Company and Coca-Cola Sabco to form Coca-Cola Beverages Africa, which we announced in November 2014, received approval, with agreed conditions, from the South Africa Competition Tribunal on 10 May 2016. We expect the transaction to complete in early July. Our associate Castel increased its interests in its Tunisian operations such that it obtained control of these operations. The accounting for the transaction led to a non-cash gain, of which our share amounted to US$86 million and which we have treated as an exceptional item. STRATEGICREPORT 43SABMiller plc Annual Report 2016
  • 48.
    Adjusted EBITDA We usean adjusted EBITDA measure which comprises operating profit before exceptional items, depreciation and amortisation, and includes our share of MillerCoors’ EBITDA, in order to provide a useful indication of cash generation. Adjusted EBITDA of US$6,114 million was 8% lower than the prior year, primarily due to the adverse currency translational impact. Adjusted EBITDA margin, including our share of MillerCoors’ net producer revenue, contracted by 20 bps in the year to 31.5%. 2016 US$m 2015 US$m Subsidiaries’ EBITDA (see note 2) 5,105 5,690 Group’s share of MillerCoors’ EBITDA (see note 2) 1,009 987 Adjusted EBITDA 6,114 6,677 Net producer revenue (NPR) 14,895 16,534 Group’s share of MillerCoors’ NPR 4,504 4,543 19,399 21,077 Adjusted EBITDA margin 31.5% 31.7% Cash flow and investment highlights Net cash generated from operations before working capital movements of US$5,055 million was 11% lower than the prior year, primarily as a result of the depreciation of our key operating currencies against the US dollar. This excludes cash contributions from joint ventures but includes the effects of cash flows from exceptional items, other than proceeds from the disposal of businesses and associates. Cash flow from working capital was an inflow of US$61 million, principally as a result of the revisions to supplier payment terms, partly offset by an increase in receivables and inventories owing to growth of the business. Cash generated from operations decreased by 12% compared with the prior year, to US$5,116 million. Tax paid in the year was down to US$1,315 million from US$1,439 million in the prior year. As described in the tax section, the decrease arose mainly as a result of the translational impact of the depreciation of our key currencies against the US dollar. Net interest paid decreased compared with the prior year to US$386 million from US$651 million reflecting the reduction in gross debt at the end of the prior financial year and during the year, together with the early redemption payment in the prior year. Capital expenditure on property, plant and equipment for the year was US$1,210 million (2015: US$1,394 million), and US$1,313 million (2015: US$1,572 million) including the purchase of intangible assets, with the amount spent impacted by the translational impact of currency depreciation against the US dollar. We have continued to invest in brewing capacity and capability, principally in Africa and Latin America, together with spend on the development of digital capability, networks and communications. Capital expenditure in the next financial year is expected to be similar to prior years. Free cash flow was US$2,969 million, a decrease of US$264 million, reflecting the translational impact of the depreciation of our key currencies against the US dollar in the year. Free cash flow over the last five years is shown in the chart below. Free cash flow US$m 20162015201420132012 2,969 3,233 2,563 3,230 3,048 Cost and efficiency programme Our cost and efficiency programme, originally launched in May 2014, continues to drive additional operational efficiencies to those delivered in the normal course of business, with the original target having been replaced during the year with a new target announced on 9 October 2015. The announcement is repeated on the following page. Savings arising from this programme in the year amounted to US$326 million and cumulatively amount to US$547 million per annum, and have exceeded the original target two years ahead of schedule. Efficiencies and cost savings achieved in the year were delivered through our end to end, integrated supply chain, in manufacturing, distribution and procurement, the reach of the latter covered 86% of spend under management for the year. When the programme was originally announced in May 2014, upfront restructuring costs of US$350 million were expected. US$36 million of restructuring costs have been incurred in the year bringing the cumulative costs to date to US$164 million. The announcement in October 2015 of the revised target included an additional US$26 million of incremental non-recurring costs. 44 SABMiller plc Annual Report 2016 STRATEGIC REPORT |Finance review continued
  • 49.
    “SABMiller announces thatit has increased its target annual run rate cost savings from its cost and efficiency programme, announced in May 2014, from US$500 million by 31 March 2018 to at least US$1,050 million by 31 March 2020. “The cost and efficiency programme, which covers SABMiller’s integrated supply chain comprising procurement, manufacturing and distribution, delivered US$221 million of annualised savings in its first year to 31 March 2015, and is expected to deliver in excess of US$430 million of annualised savings in its second year to 31 March 2016. The original target issued in 2014 was US$500 million annualised savings by 2018. “The increase in annual run rate cost savings announced today, of at least US$550 million, will further build on the initial success of the 2014 programme and bring the aggregate annual run rate cost savings for this programme to at least US$1,050 million by 2020. This is across a total addressable cost base of approximately US$10 billion. “The additional savings will come from SABMiller’s integrated supply chain, with approximately 70% of the additional savings announced today coming from procurement and 30% from manufacturing and distribution. The savings will mainly be realised by: – increasing the spend centrally managed by SABMiller’s specialist procurement team to at least 90%, from 46% in the year ended 31 March 2014 and 69% for the year ended 31 March 2015; – completing the roll out of procurement operating models to increase efficiency through greater transparency, cost management, compliance and delivery of savings; and – driving further efficiencies in manufacturing and distribution based on best in class benchmarks and standardised processes. “SABMiller expects to incur incremental non-recurring costs of US$26 million in total by 2020 and no dis-benefits are expected to arise from the programme. “Bases of belief and sources of information from the 9 October 2015 announcement: “The cost and efficiency programme announced and launched in 2014 delivered cost savings of US$221 million by 31 March 2015 as disclosed in SABMiller’s Annual Report and Accounts by reference to a total addressable cost base for the year ended 31 March 2014 of approximately US$10 billion. “Total addressable cost base refers to all third party spend and labour force and infrastructure costs in manufacturing and distribution. The labour force costs in manufacturing include the group’s share of relevant MillerCoors costs. The total addressable cost base excludes capital expenditure and depreciation. “The incremental cost savings estimates shown above are based on savings compared to the group’s cost base for the year to 31 March 2015 which was not materially different from that for the year to 31 March 2014. “The estimated cost savings have been prepared based on internal information on costs by function, type and country and detailed analysis of the future operating model. The delivery of historical cost reduction programmes has also been taken into account in preparing these estimates. The estimates have been prepared by functional and country teams, including senior executives in the organisation. These programmes have been developed over the past 6-12 months and have included input from external consultants. In circumstances where data has been limited for commercial or other reasons, estimates and assumptions have been developed to support the analysis. “In arriving at the Quantified Financial Benefits Statement, the directors of SABMiller have assumed that: – there will be no change in the ownership or control of SABMiller; – there will be no material change to macroeconomic, political or legal conditions in the markets or regions in which the SABMiller group operates which will materially impact on the implementation of or costs to achieve the proposed cost savings; and – there will be no material change in exchange rates or commodity prices.” Announcement regarding increase in target savings from the cost and efficiency programme – 9 October 2015. STRATEGICREPORT 45SABMiller plc Annual Report 2016
  • 50.
    Total equity decreasedfrom US$24,355 million at 31 March 2015 to US$24,088 million at 31 March 2016. The decrease primarily reflected adverse currency movements on the translation of local currency net assets and dividend payments, partly offset by profit for the year and share-based payment credits. Financial structure and liquidity Our strong financial structure gives us adequate resources to facilitate our continuing business along with medium-term flexibility to invest in appropriate growth opportunities and manage the balance sheet. We finance our operations through cash generated by the business and a mixture of short and medium-term bank credit facilities, bank loans, corporate bonds and commercial paper. In this way, we avoid over-reliance on any particular liquidity source. We use cash in hand, cash from operations and short-term borrowings to manage liquidity. The following table summarises our funding structure at 31 March 2016. 2016 US$m 2015 US$m Overdrafts (159) (215) Borrowings (11,520) (12,276) Derivatives 672 1,114 Finance leases (61) (53) Gross debt (11,068) (11,430) Cash and cash equivalents 1,430 965 Net debt (9,638) (10,465) Maturity of gross debt: Within one year (2,801) (1,608) Between one to two years (254) (2,169) Between two and five years (3,504) (3,121) Over five years (4,509) (4,532) The average maturity of the gross committed debt portfolio is 7.0 years (2015: 7.3 years). On 15 June 2015 we repaid from existing resources our US$700 million 5.125% Notes due 2015. On 7 August 2015 FBG Treasury (Aust) Pty Ltd issued AUD700 million 3.75% Notes due August 2020. The notes were issued under the AUD3,000 million Guaranteed Medium Term Note Programme, established on 21 July 2015 and guaranteed by SABMiller plc. The proceeds from the bond were used to fund the repayment of borrowings and for general corporate purposes. Balance sheet A significant proportion of the non-current assets on our balance sheet reflect acquisitions since our listing on the London Stock Exchange in March 1999. No goodwill or intangible assets are recognised on the balance sheet in relation to businesses or brands that have been developed organically or were acquired prior to 1998. The same policy applies for our investments in associates and joint ventures, including MillerCoors. Acquisitions post 1 April 1998 and prior to the IFRS transition in 2005 were accounted for in accordance with UK GAAP, with intangible assets, such as brands, not separately recognised but instead forming part of the goodwill on the acquisition, which was amortised over 20 years in most instances. On transition to IFRS in 2005, we changed our policy and have recognised acquired intangible assets, primarily brands, separately from goodwill on acquisitions, with intangible assets subject to amortisation and with no amortisation of goodwill. The goodwill and intangible assets relating to investments in associates and joint ventures including MillerCoors are subsumed within the investment total and not separately identified on our balance sheet. Total assets decreased to US$43,589 million from the prior year’s US$44,911 million primarily as a result of the impact of currency translation, partly offset by the profits earned and cash generated in the year. Goodwill decreased to US$14,268 million, a reduction of US$478 million compared with the prior year balance, mainly as a result of the impact of foreign exchange rate changes on goodwill denominated in currencies other than the US dollar, partly offset by the goodwill arising on the acquisition of Meantime. Intangible assets decreased to US$6,526 million, a reduction of US$352 million compared with the prior year balance, primarily reflecting foreign exchange movements and amortisation, partially offset by additions mainly related to the Meantime brand and to the development of digital capability, networks and communications. Gross debt at 31 March 2016 decreased to US$11,068 million from US$11,430 million at 31 March 2015 primarily as a result of the repayment of outstanding commercial paper. Gross debt comprises borrowings together with the fair value of financing derivative assets or liabilities held to manage interest rate and foreign currency risk of borrowings. Net debt (comprising gross debt net of cash and cash equivalents) decreased to US$9,638 million from US$10,465 million at 31 March 2015, reflecting positive free cash flow during the year. As at 31 March 2016, we held cash and cash equivalent investments of US$1,430 million (2015: US$965 million). An analysis of net debt is provided in note 27c to the consolidated financial statements. Our gearing (presented as a ratio of net debt to equity) has decreased to 40.0% from 43.0% at 31 March 2015. 46 SABMiller plc Annual Report 2016 STRATEGIC REPORT |Finance review continued
  • 51.
    Currency risk Our debtprofile by currency at 31 March 2016 (after taking account of derivatives) is illustrated below. Net debt profile US$9,638m US dollar 54% Other 15% Australian dollar 11% Euro 10% South African rand 6% Colombian peso 4% Interest rate risk The weighted average interest rate for the total gross debt portfolio at 31 March 2016 decreased to 3.2% (2015: 3.5%) primarily reflecting the repayment of some high interest rate debt during the year as well as declines in interest rates in a number of key currencies. Usage of derivative instruments Our policy only allows the use of derivative instruments to manage the currency, commodity and interest rate risks arising from our operations and financing activities. Our policy does not allow trading in financial instruments. Currency The exchange rates to the US dollar used in the preparation of the consolidated financial statements are detailed in note 1 to the consolidated financial statements. The weighted average rates, used to translate the income statement and cash flow statement, of all of the major currencies in which we operate depreciated against the US dollar over the year. Whereas the closing rates for certain of the major currencies in which we operate, including the Czech koruna, the Polish zloty, the euro and the Australian dollar, appreciated against the US dollar and the closing rates of the other major currencies in which we operate depreciated against the US dollar. Domenic De Lorenzo Chief Financial Officer 10 June 2016 Our committed undrawn borrowing facilities decreased marginally from US$3,644 million at 31 March 2015 to US$3,613 million at 31 March 2016. We have sufficient headroom to service our operating activities and capital investment. Maturing debt in the next 24 months includes US$300 million bonds due in June 2016, US$2,000 million bonds due January 2017, ZAR1,000 million bonds due March 2018 and a number of local bank facilities. As at 31 March 2016 committed headroom including committed undrawn borrowing facilities and cash and cash equivalents was sufficient to cover all maturing facilities over the next 24 months. We have continued to be able to access sufficient and significant funding from a number of sources and expect to renew maturing facilities as necessary. Subsequent to the financial year end, the maturity dates of US$2,412 million of the US$2,500 million committed syndicated facility and US$971 million of the SABMiller Holdings Inc US$1,000 million committed syndicated facility were extended to May 2021. The remaining portion of the two facilities continues with a maturity date of May 2020. Our credit rating from Moody’s Investors Service was lifted from Baa1 with a positive outlook to A3 with a stable outlook in June 2015. In October 2015, the rating was placed on review with direction uncertain by Moody’s Investors Service following the joint announcement that AB InBev and SABMiller had reached an agreement in principle on AB InBev’s intention to make an offer to acquire SABMiller. In June 2016 this was changed to a review for downgrade, following Moody’s downgrade of AB InBev in May 2016, removing the potential for our rating to be upgraded. Our credit rating from S&P Global Ratings remains at A- with a stable outlook. Currency, interest rate, commodity and credit risk management We manage the risks from foreign exchange, interest rates, commodities and credit risk within a framework of policies approved by the board and reviewed regularly. Exposures are managed within target hedge levels and reported regularly to the treasury and audit committees. Further details of the current individual risk management policies are described in note 21 to the consolidated financial statements. The impact of our key risk management policies is detailed below. STRATEGICREPORT 47SABMiller plc Annual Report 2016
  • 52.
    Sustainable development A thrivingworld A sociable world Through Prosper and its five shared imperatives we aim to tackle the issues that are most material for our business at a local and international level. Shared opportunity We want a thriving world where incomes and quality of life are growing We want a sociable world where our beers are developed, marketed, sold and consumed responsibly Shared imperative We will accelerate growth and social development through our value chains We will endeavour to make beer the natural choice for the moderate and responsible drinker Our headline 2020 target is to Directly support more than half a million small enterprises to enhance their business growth and family livelihoods Aim to reach all of our beer consumers with effective communication campaigns, and partnerships to encourage moderate and responsible beer consumption Our sustainable development strategy, Prosper, is embedded in our business strategy and will enable us to secure growth that benefits us and local communities. The year saw two ground-breaking global agreements that will shape the development agenda for years to come: the United Nations launched 17 Sustainable Development Goals (SDGs), and world leaders committed to tackle climate change at COP21 in Paris. Through Prosper, we can make a meaningful contribution to these goals. A thriving world Businesses create jobs, develop markets, and stimulate economic growth. Yet too many people – especially women – are excluded from the positive impact of economic growth. The SDGs seek to tackle poverty, but also broaden the concept of development to encompass the provision of decent work, enterprise development, women’s empowerment, and reduced inequality. One of the most powerful contributions we make to these goals is through direct and indirect employment, and through the value we generate in our operations, our value chain, and local economies. In the year we generated US$21,640 million of economic value through our business activities, most of which was distributed to employees, shareholders, governments, and local communities. Small- and medium-sized enterprises (SMEs) account for nearly 70% of global employment1 . The SDGs also emphasise the critical role that these small businesses play in creating jobs and economic growth, especially in areas of high unemployment, poverty, and poor social mobility. SABMiller buys from or sells directly to approximately 1.5 million small businesses worldwide. Our business relies on the ability of suppliers, farmers, distributors, and retailers to survive, grow, and prosper with us. That is why we have committed to support over 500,000 of these small businesses to enhance their growth and livelihoods. So far, we have reached over 175,000. 1 International Trade Centre 2015. Long-term commercial success demands that we play a positive role in the communities where we operate. This means supporting jobs and stimulating growth, promoting responsible alcohol consumption, and stewarding water and other natural resources. When our business prospers, communities prosper. When communities prosper, so does our business. Through our five shared imperatives outlined below, we aim to tackle the issues that are most material for our business at a local and global level. The imperatives give us global focus and alignment, while allowing local markets to respond to local needs. They are ‘shared’ because we can only tackle joint risks in partnership with those who also face them. By working together with local communities, suppliers, governments, consumers and beyond, we can create value for all. Our shared imperatives 48 SABMiller plc Annual Report 2016 STRATEGIC REPORT
  • 53.
    A fair approachto taxation Our fourth Our Approach to Tax report is published alongside this Annual Report, and shares information on our tax payments and principles. The total taxes borne and collected this year by the SABMiller group, including our share of taxes paid by our US joint venture amounted to US$9,507 million (2015: US$10,639 million). These include excise, corporate, and transactional taxes, and taxes borne by employees. Of this total, 68% was paid in developing countries. The corporate tax charge for the year was US$1,152 million (2015: US$1,273 million), and our effective tax rate was 26.3% (2015: 26.0%). We support moves towards greater tax transparency and are actively working to share more information with key stakeholders. Read more on page 42 A sociable world Harmful drinking is an issue of significant concern – to governments, society, and SABMiller. It is an issue that we are committed to helping tackle. We support the aim of the World Health Organization (WHO) to reduce harmful alcohol consumption by 10% by 2025. This is also an area of focus for the Sustainable Development Goals (SDGs). We recognise too that consumer preferences and values have been shifting to a greater focus on health. Beer brings people together, adding to the enjoyment of life, but we must work proactively to meet all of these expectations. We are committed to addressing harmful drinking through a mix of commercial and programmatic interventions, coupled with targeted regulatory interventions that we will support or seek out as effective ways to address particular types of irresponsible and harmful drinking. Our publicly available, comprehensive policies help our employees and partners to meet our demanding standards for producing and marketing our products to encourage responsible consumption. Read more about our alcohol responsibility policies at www.sabmiller.com/alcohol- policy Our Policy on Commercial Communication (POCC) governs how and where we market our brands. The POCC states that we will not direct our marketing – including on social media – to people under the legal drinking age, or feature paid models below the age of A resilient world A clean world A productive world We want a resilient world where our business, local communities and ecosystems share uninterrupted access to safe, clean water We want a clean world where nothing goes to waste and emissions are dramatically lower We want a productive world where land is used responsibly, food supply is secure, biodiversity is protected and brewing crops can be accessed at reasonable prices We will secure shared water resources for our business and local communities We will create value through reducing waste and carbon emissions We will support responsible, sustainable use of land for brewing crops Secure the water supplies we share with local communities through partnerships to tackle shared water risks Reduce the carbon footprint per hectolitre across our value chain by 25%1 , including by 50% within our breweries, by 25% across our packaging and by 25% across our refrigeration carbon footprint Ensure the sourcing of our crops measurably improves both food security and resource productivity 25 in any commercial communication. The policy also incorporates the Beer, Wine and Spirits Producers’ Commitments – a set of 10 commitments adopted by 12 global alcohol companies to promote responsible practices. All our operating companies, with very limited exceptions in our smallest businesses, have a sales and marketing compliance committee (SMCC), which is mandated to ensure that any proposed marketing materials comply with the POCC, and with local laws and national self-regulatory requirements. The SMCC has the power to reject, or demand changes to, any material that fails to comply. As at 31 March 2016, the SMCCs of almost three quarters of our businesses involved non- industry participation, including independent chairs or independent audits of their work. As at 31 March 2016, 70% of employees worldwide had received alcohol responsibility training within the past three years. The root causes of harmful drinking are complex and vary widely between countries and cultures. More than 160 tailored local programmes for reducing harmful alcohol use bring to life our principles and comprehensive policies. We believe in a multi-stakeholder approach, and in almost every case we collaborate with local partners, including governments, non-governmental organisations, civil society groups and public bodies such as the police. We believe that by working in partnership with other organisations 175,000+small businesses supported to date across our value chain. 1 Against a 2010 base. STRATEGICREPORT 49SABMiller plc Annual Report 2016
  • 54.
    our approach andprogrammes are more robust and credible, and more likely to achieve change. To find out more about SABMiller’s alcohol responsibility programmes around the world visit www.sabmiller.com/ responsibilityprogrammes A resilient world Water scarcity already affects more than 40% of the global population1 . This is a serious issue that has major implications for a global brewer: put simply, no water, no beer. At the same time, water scarcity is holding back economic and social development for hundreds of millions of people around the world. Tackling this successfully will release untapped prosperity for everyone – from the smallest farmers to global manufacturing businesses and entire national economies. 20162015201420132012 3.223.3 3.5 3.7 4.0 Water to lager ratio hl water/hl lager This year, we achieved a water efficiency ratio of 3.2 hl/hl2 (2015: 3.3 hl/hl) and we are on track to meet our target of 3.0 hl/hl by 2020. At 25 of our breweries, average water efficiency is already below 3.0 hl/hl. In absolute terms, we used 5972 million hl of water to produce our lager (2015: 592 million hl). 3.2hl2 water to produce 1 hl lager, on track to meet our target of 3.0 hl/ hl by 2020. While water scarcity is a risk to our business operations, it can also have severe human and economic consequences for local communities. Nearly all of our breweries have now evaluated their exposure to water risk using our bespoke water risk assessment process. Each brewery has identified and prioritised risks and developed action plans in consultation with local stakeholders. Our focus is now on implementing these action plans – with the aim of effectively mitigating the risks water scarcity poses both to our sites and to local communities. Tackling water scarcity and quality issues requires collaboration between governments, affected communities, businesses, and other stakeholders. This year we formalised a new global alliance with our longstanding partner, World Wide Fund for Nature (WWF) to support key priorities. A clean world Climate change has far-reaching consequences for our business and the communities where we operate, from water scarcity and energy constraints, to reduced food security and health risks. The Paris climate talks in December 2015 marked a turning point, as world leaders agreed the first truly global commitment to act on climate change. We are on track to halve our on-site greenhouse gas emissions per hectolitre of lager between 2008 and 2020. In the year ended 31 March 2016 fossil fuel emissions per hl of lager produced fell by 5.4%, with total CO2e emissions of 1.7 million tonnes (2015: 1.7 million tonnes), of which 0.8 million tonnes were generated from our direct use of fuels such as natural gas, coal and oil (scope one) and 0.9 million tonnes were generated indirectly from the production of electricity and steam we purchase (scope two). Energy savings have contributed the vast majority of on-site emissions reductions. 20162015201420132012 8.929.4 10.3 11.1 12.4 CO2e emissions from fossil fuel energy used on site kgCO2e/hl lager However, reducing emissions from our operations is just the first step. We have a target to reduce our total carbon footprint per hectolitre by 25% by 2020, from 2010 levels, including a 25% reduction in both packaging and refrigeration. Prosper through our brands We believe that by engaging with consumers on shared concerns, our brands can help to deliver societal benefits while driving topline growth. Prosper includes a target to build sustainable development messages into the activations of three brands in each market by 2020. Across SABMiller, 44 brands have now adopted sustainable development activities. This includes Cusqueña in Peru, which is supporting the livelihoods of local weavers. As part of the support programme, 50 Cusqueñan weavers crafted a world first – a giant hand-woven woollen billboard using more than one million individual threads. In Europe, where unemployment among target consumers is a growing problem, Excelent (Czech Republic and Slovakia), Kornuit (Netherlands) and Nastro Azzurro (Italy) are each supporting young entrepreneurs to achieve their dreams. Read more at www.sabmiller.com/ prosperandbrands Prosper and the UN Sustainable Development Goals (SDGs) SABMiller is committed to rising to the challenge of the SDGs, and helping to make them a reality. Each of our shared imperatives are already aligned to a number of SDGs. Visit our website for more detailed information on how we will play our part at www. sabmiller.com/prosper-and-the-sdgs 50 SABMiller plc Annual Report 2016 STRATEGIC REPORT |Sustainable development continued
  • 55.
    Returnable bottles andkegs are much more carbon- and resource-efficient throughout their lifecycle than cans, PET bottles or non-returnable glass bottles. 51% of our beer was sold in returnable bottles and kegs (2015: 53%). We also work with suppliers to reduce the weight and environmental impact of all packaging in the relevant market. SABMiller has a target to purchase 100% HFC-free fridges by 2020, and we are working hard to make this economically and practically feasible for retailers. This year, 20% of the fridges we purchased were HFC-free. Through introducing more energy-efficient fridges, we estimate an average annual saving of US$106 per trade fridge for the retailer. Around 97% of spent grain from our breweries is reused typically by farmers for animal feed or for renewable energy, creating value as well as preventing waste from being diverted to landfill. During the year our breweries reused or recycled 89% of brewery waste (2015: 90%). SABMiller is an ‘A list’ performer in the CDP’s Carbon Performance Leaders Index. Read our CDP reports at www.cdp.net A productive world Around 1.3 billion people work in agriculture, producing most of the world’s food but just 3% of global GDP3 . Agriculture also uses one-third of the world’s land and accounts for 70% of all fresh water withdrawals.1 As demand for food grows, there is a pressing need to produce more with less, to reduce crop losses, and to improve agricultural livelihoods. Quality malting barley is a key ingredient of beer. SABMiller has identified priorities in each of our barley sourcing regions, and is working with farmers and, where relevant, malt suppliers to ensure malting barley is economically attractive to farmers, climate resilient and resource efficient. Buying locally-grown barley can reduce costs, create jobs and increase incomes. However, it is not suitable for all climates, making imports necessary in some markets. Incorporating local crops like cassava, maize, rice, and sorghum into our beers supports local farmers and helps us produce more affordable beer. Our Africa Go Farming strategy is doing just that. In multiple markets we are working to source the most appropriate crop in the local context to be used for brewing (read more on page 7). We have a target to source 100% of our sugarcane from sustainable sources by 2020. During the year, 15.3%2 of our global sugar supply from sugarcane came from sustainable sources (2015: 5.1%). This represents all sugar sourced from our Azunosa sugar mill in Honduras, which became Bonsucro-certified in 2014. Based on significant progress made towards sustainable sugarcane with suppliers in Latin America, South Africa and Australia representing an additional 59% of our supply, we are confident that we are on track to meet our 2020 target. 15.3%2 of sugar sourced from sugarcane meeting sustainable standards. Embedding Prosper across our business To ensure that Prosper delivers its full potential as a route to unlocking value for the business and benefits for society, we have focused during the year on further integrating Prosper into the way we drive business performance. All parts of our business, from Australia to Zambia, and from procurement to sales, have a role to play in delivering Prosper as an integrated part of their strategy and day- to-day activity. As part of our business planning process, in the year, each region and global function completed a Prosper progress review, to assess the fit of Prosper with core elements of strategy, and to identify key challenges in delivering our Prosper targets. Insights from this process have been used to identify areas requiring additional focus and resource. Our Prosper performance is measured through our bespoke management system, the Sustainability Assessment Matrix (SAM) and is overseen by the group corporate accountability and risk assurance committee (CARAC), a committee of the SABMiller plc board. The CARAC is chaired by Dambisa Moyo, a non-executive director of SABMiller plc (see pages 54 and 55 for a full list of members). Each region also has its own CARAC, chaired by the regional managing director, which meets twice a year to review local Prosper performance and discuss emerging issues. 1 United Nations, 2016. 2 Information for the year ended 31 March 2016 has been subject to limited assurance by PricewaterhouseCoopers LLP. For further details of the assurance provided see the independent assurance report on pages 36 and 37 of the Sustainable Development Report 2016. 3 International Labor Organization, 2016 and World Bank, 2014. Transparency and ethics Our Code of Business Conduct and Ethics provides the overarching basis under which our employees and officers are required to uphold high standards of ethical conduct. We have a long-standing commitment to transparency, honesty, integrity and fairness, and to a zero tolerance approach to bribery, as we strongly believe this is a fundamentally important tenet of doing business. Our projects during this year have included a review of our global procurement procedures to enhance, clarify and streamline our expectations of suppliers, including a review of our due diligence approach and Code of Conduct for Suppliers. We believe we should actively drive social, economic and environmental improvements in our supply chain, ultimately helping to improve livelihoods and build communities, and our Supplier Code of Conduct details how we expect SABMiller Procurement suppliers to act to ensure that our high anti-corruption standards are continually achieved. Read more at www.sabmiller.com/anti-corruption Further reports Find out more about our sustainable development performance in our Sustainable Development Report 2016 and our tax payments and principles in Our Approach to Tax report. The Mackay Awards Last year we launched The Mackay Awards to recognise and reward the initiatives by SABMiller teams around the world that best contribute to delivering our shared imperatives and 2020 targets. This year a Prosper Pitch category was introduced for employees to submit new ideas that would help deliver the ambitions behind Prosper. The winning entry will receive seed funding and senior management support to put the idea into action. Sustainable Development Report 2016 SABMiller plc 1 Our Approach to Tax 2016 SABMiller plc STRATEGICREPORT 51SABMiller plc Annual Report 2016
  • 56.
    Valuing and supportingour people Our success is driven by the thousands of people that we employ, and the millions in our value chains. Supporting people is at the heart of our business, of Prosper and of all five shared imperatives. Improving health and safety We strive to reduce or eliminate risks of harm to our employees, contractors, and all others affected by our business. Our global health and safety programme, Safety Around Beverages, sets minimum standards for all businesses. Our group-wide health and safety governance system has standardised reporting across the group, and enables us to target improvements and share best practice. During the year we recorded 8,357 days lost through injury (2015: 13,028) and 142 major injuries (2015: 490). Road traffic accidents accounted for a significant proportion of fatalities, and road safety remains a top priority worldwide. Our South African business has launched a new campaign, called ACT10N, to reinforce the 10 global safety standards in the Safety Around Beverages programme in simple and engaging ways. The campaign emphasises personal responsibility, while making line managers accountable for giving their teams the knowledge and skills needed to behave safely. Powerful docu-drama films and other communications are capturing employees’ attention and making sure that the safety message resonates. Promoting wellbeing We aim to create a healthy and positive work environment for all our employees, acknowledging the benefits this provides in terms of productivity. In Africa, our Wellness Development Programme focuses on HIV/ Aids, malaria, sexually transmitted infections, hepatitis B and C, and tuberculosis. Our focus is to train employees to educate their peers at work, at home and in their wider communities, by promoting prevention, testing and treatment of these diseases. In countries Supporting employees through change Since the boards of SABMiller and AB InBev reached agreement in principle on the key terms of a recommended offer, looking after our people has been a priority. We have created a People Plan to keep all employees informed about the proposed transaction, and how they might be affected. The plan is designed to treat and remunerate our people fairly, keep hold of our best talent, and support our teams through the potential changes. It also aims to ensure that our business keeps delivering results while making a smooth transition to a new company where our people can continue to develop their careers. We have kept our people informed through town-hall meetings, functional meetings, individual meetings with managers, and regular communications. Employees have had their say through focus groups and surveys conducted worldwide. Most of those participating have said that, despite the potential changes, they feel empowered to make decisions, understand their goals, feel positive about their line managers, and are learning useful skills for their careers. Leadership skills become more critical than ever during periods of change. To support leaders during the period, we developed a toolkit to provide further support and resources that address some of the most common leadership challenges during transition. This includes a combination of quick, easy to access resources such as top tips, along with short articles and videos to help leaders with leading their teams in a period of uncertainty. It is therefore with the deepest regret that we report that 27 employees and contractors lost their lives at work this year (2015: 29). Eight of these fatalities resulted from accidents during on-site maintenance or repairs, 10 from road traffic accidents, and nine were the result of robberies or assaults on employees during sales or trade visits. Our businesses investigated each case and, where applicable, put in place measures to reduce the likelihood of these incidents recurring. 52 SABMiller plc Annual Report 2016 STRATEGIC REPORT |People
  • 57.
    Promoting human rights inour supply chain Tackling human rights risks in our supply chain requires transparency about the situation and collaboration to address any issues. This has been a focus for SABMiller Procurement since it was established in 2010. We welcome the focus the UK’s Modern Slavery Act puts on this area of human rights. To understand the risks in our supply chain we have implemented a supplier accreditation programme including on-site audits of high-risk suppliers. We understand that audits have their limitations, but believe that by helping suppliers to address gaps in their risk management processes, and by accelerating our support for Prosper, we can reduce the risk of human rights violations, including modern slavery, in our supply chains. Our ambition is for 80% of our spend to be with accredited suppliers by 2020. In Africa, we are working closely with Partner Africa, a leading social enterprise and pioneer in ethical and socially responsible business practices, to help suppliers in the region to meet our global standards. 1 Defined as greater than 5% of the population. 2 13,896 women and 54,321 men as at 31 March 2016. 3 Information for the year ended 31 March 2016 has been subject to limited assurance by PricewaterhouseCoopers LLP. For further details of the assurance provided see the independent assurance report on pages 36 and 37 of the Sustainable Development Report 2016. 4 2,855 women and 6,715 men as at 31 March 2016. 5 As at 31 March 2016, 64 women and 360 men were directors of subsidiary companies included within the consolidated financial statements. 6 Professional Boards Forum, BoardWatch, 2016. Recognising performance Our performance management system provides a framework for employees to set themselves stretching individual goals and ensures that we recognise and reward strong performance. These goals are linked to business objectives. Bonus payments and salary increases are linked to performance against these goals, and calculated against a combination of individual achievement and overall company performance. Respecting human rights SABMiller is committed to respecting internationally recognised human rights as set out in the International Bill of Human Rights. We are a signatory of the UN Global Compact. We have developed an approach which helps our local businesses to identify and mitigate human rights risks within their operations and value chains, in line with the UN Guiding Principles on Business and Human Rights. During the year, we updated our human rights policy to clarify our position on areas such as land rights and grievance mechanisms. We held workshops in London, Bangalore, Johannesburg, and Miami to review this and work out how best to address human rights risks in different local contexts. We respect the right to union representation and 44.1% of employees are union members or covered by collective bargaining agreements (2015: 42.8%). Modern slavery Modern slavery includes slavery, servitude, forced labour, and human trafficking. Modern slavery can be difficult to identify in supply chains due to a shared interest in hiding it among organisations exploiting workers, and also among workers who fear losing their jobs or even deportation. While modern slavery is a global problem, there is a greater risk that it may be present in the agriculture and manufacturing sectors. Our Human Rights Policy and Supplier Code of Conduct prohibit all forms of modern slavery. We take a risk-based approach to seek to understand and address the risk of modern slavery, through robust due diligence and engagement with suppliers and other key local stakeholders. Read SABMiller’s UK Modern Slavery Act statement at www.sabmiller.com/ modernslaveryact where HIV/Aids has a high prevalence1 , we provided free voluntary counselling and testing for 56% of employees in the last year. Valuing diversity and equality Women’s empowerment and gender diversity are central themes of the UN Sustainable Development Goals (SDGs) and a business imperative. Women are a vital source of talent in an increasingly competitive employment market, play a central role in our value chain, and represent a huge potential market. In an industry still seen as male dominated, we are determined to improve gender diversity, particularly among our leadership. Women represent 20.4% of our global workforce2 (2015: 20.6%) and 29.8%3 of executives and managers4 (2015: 29.6%)5 . Our ten-strong executive committee includes one woman. 20% of SABMiller’s plc board is female – below the FTSE 100 average of 25.9%6 , although women hold three of our seven independent non-executive director posts (43%). 29.8%3 Female managers and executives We have clear policies and processes for recruiting and treating people fairly and on merit, regardless of age, gender, sexual orientation, religion, disability, or ethnic origin. However, we know we can do more to attract female employees. In Africa, we launched Plus One – an initiative that aims to increase the percentage of females across our African businesses at the management and executive level. In Australia, we established a local Diversity Forum in the year, which is chaired by the regional managing director. The forum is examining ways to ensure the business attracts, retains, and develops high- performing women. We continue to support South Africa’s Broad-Based Black Economic Empowerment (BBBEE) initiatives for growing the economy by including and empowering previously disadvantaged citizens. 81% of The South African Breweries (Pty) Ltd (SAB) workforce is from previously disadvantaged groups and 63% of its employees are black. SAB achieved 78.54 (2015: 79.24) in the last annual BBBEE verification, making it a level 5 contributor under the new BBBEE code of good practice. STRATEGICREPORT 53SABMiller plc Annual Report 2016
  • 58.
    GOVERNANCE Board of directors Developmentfor Europe and the Americas, Director of the global corporate finance and development team, Director, Group Strategy & Corporate Development. He has an in-depth understanding of the group and of the global brewing industry and has led many of the group’s major M&A transactions. Current appointments: He does not have any external appointments. Previous appointments: Prior to his appointment as Chief Financial Officer, he held the position of Acting Chief Financial Officer, and prior to that, he led the group’s corporate finance and development and strategy team. Member of: Executive committee (excom) 4. Guy Elliott – Deputy Chairman and Senior Independent Director Appointed to the board: 1 July 2013 Skills and experience: Guy has extensive experience of operating in both developed and developing markets, having previously held a variety of finance, marketing, strategy and general management positions throughout his career. Current appointments: He is a non-executive director of Royal Dutch Shell plc. He is a member of the UK Takeover Panel and chairman of the Panel’s Code Committee. Previous appointments: He was previously Chief Financial Officer of Rio Tinto plc and Rio Tinto Limited and also a non-executive director of Cadbury plc, serving as chairman of its audit committee and as Senior Independent Director. Member of: Audit committee Remuneration committee Nomination committee 5. Mark Armour – Non-executive director Appointed to the board: 1 May 2010 Skills and experience: Mark brings strategic and financial expertise to the board and has significant experience of managing an international group. Company transaction. He is also a member of the advisory board of Metalmark Capital LLC. Previous appointments: He is the former chairman and CEO of the Philip Morris group of companies, the former chairman of Altria and Kraft Foods Inc. and a past non-executive director of News Corporation Ltd, the New York Stock Exchange and BSkyB plc. Member of: Corporate accountability and risk assurance committee (CARAC) Nomination committee 8. Dinyar Devitre – Non-executive director Appointed to the board: 16 May 2007 Skills and experience: Dinny brings both financial expertise and strategic counsel to the group. He has extensive experience of managing global fast-moving consumer goods corporations. Current appointments: A nominee of Altria, he is a member of the board of Altria, a special adviser at General Atlantic LLC, and a director and chairman of the audit and risk committee of Markit Group Ltd. He is also the Executive Chairman of Pratham USA, serves as a trustee of the Brooklyn Academy of Music and is a trustee emeritus of the Asia Society. Previous appointments: His career with the Altria group of companies spans a 36 year period in which he served in a variety of senior positions. Before his retirement in 2008, he served as the Senior Vice President and Chief Financial Officer of Altria. He was also a director and chairman of the Corporate Governance and Public Policy Committee at Western Union Company. Member of: Audit committee 9. Javier Ferrán – Non-executive director Appointed to the board: 23 July 2015 Javier will be stepping down from the board at the conclusion of the 2016 annual general meeting. Skills and experience: Javier has in-depth knowledge of consumer brands on an international basis and of international financing. He brings extensive experience Current appointments: He is a non-executive director of Tesco plc, and a director of the Financial Reporting Council, the UK’s independent regulator responsible for promoting high quality corporate governance. Previous appointments: He was previously Chief Financial Officer of Reed Elsevier (now RELX). Prior to joining Reed Elsevier in 1995 he was a partner of Price Waterhouse in London. Member of: Audit committee (Chairman) Remuneration committee 6. Dave Beran – Non-executive director Appointed to the board: 23 July 2015 Skills and experience: Dave has considerable global business experience and an extensive knowledge of the fast moving consumer goods industry. Current appointments: He is a nominee of Altria. He serves on the board of trustees for the Richmond Ballet. Previous appointments: He was, until his retirement in March 2015, the President and Chief Operating Officer of Altria and was responsible for overseeing Philip Morris USA, U.S. Smokeless Tobacco Company, John Middleton, Nu Mark, Altria Group Distribution Company and Ste. Michelle Wine Estates. He joined the Altria family of companies in 1976. His previous positions at the company include Vice Chairman for Altria Group; Executive Vice President and Chief Financial Officer for Altria; Executive Vice President and Chief Financial Officer for Philip Morris USA; and Executive Vice President of Finance, Planning & Information for Philip Morris USA. 7. Geoffrey Bible – Non-executive director Appointed to the board: 1 August 2002 Skills and experience: Geoff has held senior roles in a number of multinational companies and has a wealth of experience of global consumer products businesses. Current appointments: He is a nominee of Altria and was appointed to the board following completion of the Miller Brewing 1. Jan du Plessis – Chairman Appointed to the board: 1 September 2014 Skills and experience: Jan has an excellent record as a chairman of major international groups with developing market footprints and a wealth of experience of international consumer businesses. Current appointments: He is chairman of Rio Tinto plc and Rio Tinto Limited. Previous appointments: In his earlier career he was Group Finance Director of Compagnie Financière Richemont, the Swiss luxury goods group. He has also served as a non-executive director and subsequently chairman of British American Tobacco plc, as a non-executive director and chairman of the audit committee of Lloyds Banking Group plc and as a non-executive director and senior independent director of Marks and Spencer Group plc. Member of: Corporate accountability and risk assurance committee (CARAC) Nomination committee (Chairman) 2. Alan Clark – Chief Executive Appointed to the board: 26 July 2012 Skills and experience: Alan has an extensive knowledge of the global beverage industry, having held a number of management roles with the group, both in beer and soft drinks. He became Managing Director, SABMiller Europe, in 2003 and was appointed as an executive director and Chief Operating Officer of SABMiller plc in 2012, before becoming Chief Executive in April 2013. Current appointments: He does not have any external appointments. Member of: Corporate accountability and risk assurance committee (CARAC) Executive committee (excom) 3. Domenic De Lorenzo – Chief Financial Officer Appointed to the board: 23 July 2015 Skills and experience: A chartered accountant, Domenic has held a number of senior positions in the group, including that of Director, Corporate Finance and 3. 16. 5. 11. 7. 15. 2. 6. 54 SABMiller plc Annual Report 2016
  • 59.
    11. Trevor Manuel– Non-executive director Appointed to the board: 1 March 2015 Skills and experience: Trevor is a former minister in the South African Government. He brings a wealth of experience in advising multilateral organisations on emerging market development and sustainability. Current appointments: He is Deputy Chairman of Rothschild South Africa, serves on the International Advisory Board of the Rothschild Group and is a director of Swiss Re AG and Old Mutual plc. Previous appointments: He was a minister in the South African Government for more than 20 years, 13 of which he served as Finance Minister. During his ministerial career he assumed a number of ex officio positions at international bodies, including the United Nations Commission for Trade and Development (UNCTAD), the World Bank, the International Monetary Fund, the G20, the African Development Bank and the Southern African Development Community. Member of: Corporate accountability and risk assurance committee (CARAC) 12. Dambisa Moyo – Non-executive director Appointed to the board: 1 June 2009 Skills and experience: Dambisa is a global economist and commentator on the macro-economy and global affairs. She has wide-ranging expertise in economic and business trends on the African continent, with a particular focus on socially responsible business. Current appointments: She is a non-executive director of Barclays PLC, Barrick Gold Corporation and Seagate Technology plc. Previous appointments: She was an economist at Goldman Sachs, where she worked for nearly a decade, and was a consultant to the World Bank in Washington, D.C. of the global alcohol beverage industry and experience of operating in both mature and emerging markets. Current appointments: He is a non-executive director of Associated British Foods plc, and a member of its nomination and remuneration committees. He is a partner in Lion Capital LLP, a consumer focused private equity firm, where he is a member of its investment committee. He is also a director of Coca-Cola European Partners. Previous appointments: He completed a 20 year career with the Bacardi Group in 2004, serving in a variety of key executive positions, including President and Chief Executive Officer. After leaving Bacardi he was appointed director and subsequently vice chairman of William Grant & Sons, a position he held until April 2014. Member of: Remuneration committee 10. Lesley Knox – Non-executive director Appointed to the board: 19 May 2011 Skills and experience: Lesley brings a wealth of strategic and financial experience across a range of businesses and is an experienced remuneration committee chairman. She qualified as a solicitor in the UK and as an attorney in the USA. Current appointments: She is a non-executive director of Centrica plc where she chairs the remuneration committee, a non-executive director of Legal & General Group Plc and Thomas Cook Group plc and is a trustee of the Grosvenor Estates and chairman of Grosvenor Group Limited. She is involved with a number of arts and charitable organisations. Previous appointments: She was previously with British Linen Bank, becoming governor in 1999 and was subsequently a founder director of British Linen Advisers. She was chairman of Alliance Trust plc, senior non-executive director of Hays Plc and spent 15 years with Kleinwort Benson, first in corporate finance and then as chief executive of the institutional asset management business. Member of: Audit committee Remuneration committee (Chairman) Nomination committee Member of: Corporate accountability and risk assurance committee (CARAC) (Chairman) 13. Carlos Pérez Dávila – Non-executive director Appointed to the board: 9 November 2005 Skills and experience: Carlos has extensive experience of the global beverage industry and of operating in the Latin America region. Current appointments: He is a nominee of the Santo Domingo Group and was appointed to the board following completion of the Bavaria transaction. He is Managing Director at Quadrant Capital Advisors, Inc., chairman of the board of Caracol TV S.A. and serves on the board and executive committee of Valorem S.A. He is also a director of Comunican S.A., Cine Colombia S.A. and the Queen Sofia Spanish Institute. Previous appointments: He began his career in investment banking at Goldman, Sachs & Company, subsequently working for SG Warburg & Co., where he served as the Director of Overseas Advisory Division and Violy, Byorum & Partners, where he was Senior Managing Director. 14. Alejandro Santo Domingo Dávila – Non-executive director Appointed to the board: 9 November 2005 Skills and experience: Alejandro has a deep knowledge of the global beverage industry and of the Latin America region. Current appointments: He is a nominee of the Santo Domingo Group, appointed to the board following completion of the Bavaria transaction. He is Managing Director at Quadrant Capital Advisors, Inc., and serves on the boards of Valorem S.A., Comunican S.A., Caracol Television S.A., Millicom International Cellular S.A. and D.E Master Blenders B.V. He is the treasurer of Aid for AIDS charity, a member of the board of trustees of The Metropolitan Museum of Art and is also a member of the board of the US-based DKMS Americas Foundation, WNET (Channel Thirteen) and the Wildlife Conservation Society. Previous appointments: He was employed at Violy, Byorum & Partners, Investment Bankers where he was focused on mergers and acquisitions in telecommunications, media and consumer goods. Member of: Nomination committee 15. Helen Weir – Non-executive director Appointed to the board: 19 May 2011 Skills and experience: Helen has extensive financial and retail expertise, with senior management experience in a number of UK and international companies. Current appointments: She is the Chief Finance Officer of Marks and Spencer Group plc, a trustee of Marie Curie and an independent non-executive director of the Rugby Football Union, the national body for rugby in England. Previous appointments: She was Group Finance Director of the John Lewis Partnership and has previously held a number of senior positions at the Lloyds Banking Group and Kingfisher plc. She is also a former member of the Accounting Standards Board. She spent her early career at Unilever and McKinsey & Co. Member of: Audit committee Corporate accountability and risk assurance committee (CARAC) Nomination committee 16. Stephen Shapiro – Group Company Secretary and Deputy General Counsel Appointed as Group Company Secretary: 1 November 2014 Stephen joined SABMiller in 2002 and was appointed Group Company Secretary in November 2014. He is also Deputy General Counsel, with responsibility for managing the internal commercial legal function, managing material legal risk, and developing group policy in key areas. He is a member of the Council of the International Chamber of Commerce UK. 8. 1. 12. 10.4. 13. 9. 14. GOVERNANCE 55SABMiller plc Annual Report 2016
  • 60.
    GOVERNANCE Executive committee 3. 9. 4. 2. 8. 3. 9. 4. 2. 8. The executivecommittee (excom) is appointed by the Chief Executive after consultation with the board. It comprises the Chief Executive, the Chief Financial Officer, regional managing directors and directors of group functions. Its purpose is to support the Chief Executive in carrying out the duties delegated to him by the board. In that context, excom executes the strategy and budget approved by the board. It also ensures that regular management reports are presented to the board, that effective internal controls are in place and functioning, and that there is an effective risk management process in operation throughout the group. 1. Mark Bowman – Managing Director, SABMiller Africa Appointed to the executive committee: 1 October 2007 Mark was appointed Managing Director of SABMiller Africa in 2007 and has been instrumental in developing SABMiller’s beer and soft drinks operations on the African continent. Following the consolidation of SABMiller’s South Africa beverage business and Africa division into one region for management purposes, he became Managing Director of the enlarged SABMiller Africa region on 1 July 2014. He joined The South African Breweries Limited (SAB Ltd) in 1993 and has held various senior positions in the group including Managing Director of Kompania Piwowarska S.A., Managing Director of ABI (the soft drinks division of SAB Ltd) and Chairman of Appletiser. He is an independent non-executive director of Tiger Brands Limited. 2. Alan Clark – Chief Executive Appointed to the executive committee: 1 October 2000 Alan’s biography can be found on page 54. 3. Sue Clark – Managing Director, SABMiller Europe Appointed to the executive committee: 10 February 2003 Sue was appointed Managing Director, SABMiller Europe in June 2012. She joined SABMiller in 2003 as Corporate Affairs Director. Before this, she held a number of senior roles in UK companies, including that of Director of Corporate Affairs for Railtrack Group and Scottish Power plc. She is an independent non-executive director of Britvic plc. 56 SABMiller plc Annual Report 2016
  • 61.
    10. 7. 6. 1. 5. 4. John Davidson– General Counsel and Corporate Affairs Director, SABMiller plc Appointed to the executive committee: 1 August 2006 John joined the group as General Counsel and Group Company Secretary in 2006. In November 2014 he assumed responsibility for regulatory affairs, communications and sustainable development, and is now General Counsel and Corporate Affairs Director. Before joining SABMiller, he spent his entire legal career at Lovells, a leading international law firm, where he was a partner from 1991, specialising in international corporate finance, cross border mergers and acquisitions, and corporate governance advisory work. He was the Chairman of the GC100 group (the association of general counsel and company secretaries of companies in the FTSE 100) for 2010 and 2011. 5. Domenic De Lorenzo – Chief Financial Officer, SABMiller plc Appointed to the executive committee: 1 July 2011 Domenic’s biography can be found on page 54. 6. Nick Fell – Marketing Director, SABMiller plc Appointed to the executive committee: 1 August 2006 Nick was appointed Marketing Director, SABMiller plc in 2006. He has extensive experience in developing global commercial strategy and previously held senior roles in Cadbury Schweppes Plc and Diageo plc. 7. Tony van Kralingen – Group Director: Integrated Supply, SABMiller plc Appointed to the executive committee: 1 February 2003 Tony was appointed Director: Integrated Supply & Human Resources, SABMiller plc in October 2008. He joined SAB Ltd in 1982 and has held a number of senior positions in the group, including that of Chairman and Chief Executive Officer, Plze ský Prazdroj a.s. and, most recently, Chairman and Managing Director: SAB Ltd. He relinquished responsibility for human resources in September 2015 and remains accountable for group procurement, technical, planning and distribution and R&D. 8. Karl Lippert – President, SABMiller Latin America Appointed to the executive committee: 1 January 2011 Karl was appointed President, SABMiller Latin America in 2011. He joined the group in 1992 and has extensive experience in the global brewing industry. He has held a number of senior positions in the group including that of President of Bavaria S.A. and Managing Director of Kompania Piwowarska S.A. 9. Ari Mervis – Managing Director, SABMiller Asia Pacific and Chief Executive Officer, Carlton & United Breweries Appointed to the executive committee: 1 October 2007 Ari was appointed Managing Director, Asia Pacific and Chief Executive Officer of Carlton & United Breweries in 2011. He joined ABI, the soft drinks division of SAB Ltd, in 1989 and has held various senior positions in sales, marketing, finance and general management. He has held the position of Managing Director, SABMiller Asia, Managing Director of Appletiser and Managing Director of SABMiller operations in Russia and Australia. He is a director of the Melbourne Business School, and Chairman of China Resources Snow Breweries. 10. Johann Nel – Group Human Resources Director, SABMiller plc Appointed to the executive committee: 14 September 2015 Johann was appointed Group Human Resources Director, SABMiller plc in September 2015. He originally joined SAB Ltd in 1997 as Human Resources Director and was Group Human Resources Director for SABMiller plc and a member of the executive committee from 2002 until his retirement from the group in 2008. After retiring from SABMiller in 2008, Johann continued consulting and lecturing in the areas of human resources, change management, global strategy and leadership in collaboration with a wide variety of organisations and academic institutions. 10. 7. 6. 1. 5. j g p his entire legal career at Lovells, a leading international law firm, where he was a partner from 1991, specialising in international corporate finance, cross border mergers and acquisitions, and corporate governance advisory work. He was the Chairman of the GC100 group (the association of general counsel and company secretaries of companies in the FTSFTSE 1E 100)00) fofor 2r 2010010 anand 2d 2011011. 5. Domenic De Lorenzo – Chief Financial Officer, SABMiller plc Appointed to the executive committee: 1 July 2011 Domenic’s biography can be found on page 54. Director: Integrated Supply, SABMiller plc Appointed to the executive committee: 1 February 2003 Tony was appointed Director: Integrated Supply & Human Resources, SABMiller plc in October 2008. He joined SAB Ltd in 1982 and has held a number of senior positions in the group, including that of ChChaiirman dand ChChi fief EExecutitiv Oe Offifficer, Plze ský Prazdroj a.s. and, most recently, Chairman and Managing Director: SAB Ltd. He relinquished responsibility for human resources in September 2015 and remains accountable for group procurement, technical, planning and distribution and R&D. 9. Ari Mervis – Managing Director, SABMiller Asia Pacific and Chief Executive Officer, Carlton & United Breweries Appointed to the executive committee: 1 October 2007 Ari was appointed Managing Director, Asia Pacific and Chief Executive Officer fof CCarltlto &n & UUnitited Bd Brew ieries iin 20120111. HHe joined ABI, the soft drinks division of SAB Ltd, in 1989 and has held various senior positions in sales, marketing, finance and general management. He has held the position of Managing Director, SABMiller Asia, Managing Director of Appletiser and Managing Director of SABMiller operations in Russia and Australia. Director and was Grou Director for SABMiller of the executive comm until his retirement from 2008. After retiring fro 2008, Johann continu lecturing in the areas o change management, and leadership in colla a wide varietyy of orggan academic institutions. GOVERNANCE 57SABMiller plc Annual Report 2016
  • 62.
    GOVERNANCE Corporate governance Dear Shareholder Thisreport describes how our board applies the UK Corporate Governance Code (the Code) and its general approach to corporate governance. The role of the board is to oversee the governance of the company, and to ensure that the principles on matters such as leadership, board effectiveness, financial accountability and risk management are rigorously applied. The most important task for the board in the year was our consideration and recommendation of the takeover offer from AB InBev. The board’s initial rejection of terms that it considered did not adequately value SABMiller resulted ultimately in significantly improved offer terms, and an agreement between SABMiller and AB InBev pursuant to which AB InBev has agreed to use its best efforts to secure the regulatory clearances and authorisations necessary to satisfy the pre-conditions and regulatory conditions to the transaction, with a break fee of US$3 billion payable if these clearances are not achieved. Both parties have agreed to certain undertakings to cooperate and provide each other with reasonable information, assistance and access in relation to the filings, submissions and notifications to be made in relation to those regulatory clearances and authorisations. Nevertheless, the board remains focused on the need for our business to continue to perform strongly and to pursue its strategic objectives until the transaction is completed. Until that time, the board’s duties in relation to governance and leadership are unaffected. In the year the board, with the help of the audit committee, reviewed the risk management activities of the group to ensure that they were aligned with the revised Code, which requires that directors confirm that they have made a robust assessment of the principal risks facing the company and monitor the company’s risk management systems and controls. The company has a thorough biannual risk assessment process and actively monitors the effectiveness of the risk mitigations and controls. Our audit committee has overseen the risk management processes implemented by management and the board has conducted a robust assessment of the principal risks facing the group. Our effectiveness review has confirmed that the board and its committees are operating effectively and fulfilling their respective mandates, and that board members are performing satisfactorily. I am also pleased to confirm that notwithstanding the distraction of the AB InBev offer, good progress has been made in addressing each of the focus areas identified in the prior year’s effectiveness review. In July 2015 the board took the important step of appointing a new CFO. Following a selection process involving internal and external candidates, we were pleased to appoint Domenic De Lorenzo as a director and as our Chief Financial Officer following the conclusion of the 2015 annual general meeting. We also welcomed Dave Beran to the board, who was nominated by Altria to replace Howard Willard. The renewal of the board continued, with the appointment of Javier Ferrán as a non-executive director at our last annual general meeting. We are pleased to offer our congratulations to Javier on his appointment as non-executive director and chairman-designate of Diageo, though since Diageo is a competitor he will step down from our board at our upcoming annual general meeting, before taking up this appointment. We wish him well. Jan du Plessis Chairman 10 June 2016 Jan du Plessis Chairman The most important task for the board in the year was our consideration and recommendation of the takeover offer from AB InBev. Nevertheless, the board remains focused on the need for our business to continue to perform strongly and to pursue its strategic objectives until the transaction is completed. Until that time, the board’s duties in relation to governance and leadership are unaffected.” 58 SABMiller plc Annual Report 2016
  • 63.
    Leadership Board of directors Wecurrently have 15 directors: our Chairman (Jan du Plessis); seven independent non-executive directors; five non-executive directors whom we do not consider to be independent; and two executive directors (Alan Clark, the Chief Executive and Domenic De Lorenzo, the Chief Financial Officer). The independent non-executive directors include Guy Elliott, who is our Deputy Chairman and Senior Independent Director. Short biographies of each of the directors are on pages 54 and 55. Our governance framework The size and certain aspects of the composition of our board and our audit, nomination and corporate accountability and risk assurance committees continue to be determined in part by the terms of our relationship agreements with our two largest shareholders, Altria Group, Inc. (Altria) and BevCo Ltd (a holding company of the Santo Domingo Group). Both agreements have been approved by SABMiller’s shareholders. Our agreement with Altria limits the size of the board to a maximum of 15 directors, of whom no more than two are to be executive directors, up to three are to be non-executive directors nominated by Altria, up to two are to be non-executive directors nominated by BevCo, and up to eight (including the chairman) are to be non-executive directors nominated by the board. Our agreement with BevCo allows it to nominate up to two non-executive directors for appointment to the board. Altria and BevCo have each exercised their right under their respective agreements to nominate one director for appointment to the nomination committee, being Geoff Bible and Alejandro Santo Domingo respectively. Both Altria and BevCo have the right to nominate directors for appointment to the corporate accountability and risk assurance committee (CARAC), which Altria has exercised (nominating Geoff Bible) but BevCo has not. Altria has also exercised its right to nominate one director (Dinyar Devitre) for appointment to the audit committee. Board of directors Board Committees Remuneration committee Members: Four independent non-executive directors Role: Determines the reward strategy for the executive directors and senior management, to align their interests with those of the shareholders Audit committee Members: Four independent non-executive directors and one non-executive director nominated by Altria Role: Monitors the integrity of the group’s financial statements and the effectiveness of the external and internal auditors Nomination committee Members: The Chairman and five non- executive directors, three independent and one each nominated by Altria and BevCo Role: Ensures the board and senior management team have the appropriate skills, knowledge and experience to operate effectively, and to develop and deliver the group’s strategy Corporate accountability and risk assurance committee Members: The Chairman, Chief Executive and four non-executive directors Role: Assists the board in the discharge of its responsibilities in relation to corporate accountability, including sustainable development, corporate social responsibility and corporate social investment. Disclosure committee Members: The Chairman, Deputy Chairman, Chief Executive, Chief Financial Officer, one other non-executive director, and the General Counsel, or the Group Company Secretary Role: Assists the board in ensuring compliance with the Disclosure and Transparency Rules and the Listing Rules Management committee Executive committee Members: Chief Executive, Chief Financial Officer, four regional managing directors and four directors of key group functions Role: Assists the Chief Executive with the development and implementation of the group’s strategy, the management of the business and the discharge of responsibilities delegated by the board Chairman Responsible for leadership of the board and presiding over its meetings Chief Executive Responsible for the day to day management of the business in accordance with the strategy approved by the board Chief Financial Officer Responsible for managing all aspects of the finance function, providing strategic input to the board and executive committee, and supporting the Chief Executive in the delivery of the group’s strategy Seven independent non-executive directors Five other non-executive directors Nominated by our two major shareholders GOVERNANCEGOVERNANCE 59SABMiller plc Annual Report 2016
  • 64.
    GOVERNANCE |Corporate governancecontinued Our application of the UK Corporate Governance Code The board applied all of the main principles and provisions of the Code throughout the year ended 31 March 2016, except in the following respects: i. Our audit committee did not consist solely of independent directors. Under our relationship agreement with Altria, as approved by the shareholders in 2002 and 2005, Altria has the right to nominate a director to the audit committee, and has nominated Dinyar Devitre, who the board does not consider to be an independent director for the purposes of the Code. The board nevertheless considers that the composition of the audit committee remains appropriate, given Altria’s interest as the company’s largest shareholder. Dinyar Devitre is a former Chief Financial Officer of Altria and the board considers that his experience and background in financial matters and his independence from management mean that the effectiveness of our audit committee in discharging its functions is considerably enhanced and not compromised by his membership. ii. The Code recommends that the performance evaluation of the boards of FTSE 350 companies should be externally facilitated at least every three years. In our 2015 annual report, we communicated that an externally facilitated performance evaluation would be undertaken early in the tenure of our new Chairman, Jan du Plessis. In light of the expected transaction timetable for the takeover offer by AB InBev, the board considered that it would have limited time to benefit from the findings of an externally facilitated effectiveness evaluation during its tenure. In addition, an extensive external evaluation would have absorbed time and significant resources at precisely the time that the board needed to focus its attention on the demands of the takeover offer. After careful consideration, the board took the decision not to conduct an external effectiveness evaluation in the year under review, and instead to conduct such an evaluation internally. If for any reason the takeover offer does not proceed to completion, the board intends then to undertake an externally facilitated effectiveness evaluation. A report on the assessment of the effectiveness of the board and its committees led by our Deputy Chairman Guy Elliott is set out on page 66 of this report. iii. Under the Code, the company is required to put its external audit contract out to tender at least every 10 years. The company has not tendered its external audit contract within the last 10 years. In the ordinary course, we would have conducted an audit tender during the 2016 calendar year as communicated in our 2015 annual report. In light of the exceptional circumstances of the takeover offer by AB InBev, the audit committee decided to defer the audit tender. The audit committee noted that an audit tender during the offer period would be inappropriate. If for any reason the takeover offer were not to proceed to completion, the audit committee intends then to conduct a tender process. iv. The Code recommends that a majority of members of the nomination committee should be independent non-executive directors. Following his appointment as Chairman of the company in July, Jan du Plessis, a member of the nomination committee and an independent non- executive director on his appointment to the board on 1 September 2014, was required to be disregarded in the determination of whether the majority of members of the committee were independent. Between 23 July 2015 and 24 September 2015 the nomination committee comprised Jan du Plessis, two non-executives directors considered to be independent and two non-executives not considered to be independent, and was therefore not compliant (although the committee did not meet during this period). On 24 September 2015 Lesley Knox, an independent non-executive director, was appointed to the committee, at which point the committee met the membership recommendations of the Code. v. One director, Mark Armour, was unable to attend the 2015 annual general meeting as he was attending a family funeral. 60 SABMiller plc Annual Report 2016
  • 65.
    Board meetings andattendance Board and committee meetings are held in an atmosphere of direct, robust and constructive challenge and debate among board and committee members. During the year we held seven regularly scheduled board meetings, as well as five specially convened meetings held on short notice to consider AB InBev’s proposals which led to the announcement on 11 November of the recommendation of AB InBev’s offer for SABMiller. Individual directors’ attendance at board and committee meetings and at the annual general meeting is set out in the table below. In the few instances when directors could not attend a board or committee meeting, any comments which they had on the matters to be considered were given in advance to the chairman of the meeting, to the General Counsel, or to the Group Company Secretary. Directors’ attendance (1 April 2015 to 31 March 2016) Board Audit Remuneration CARAC Independent Attended Possible Attended Possible Attended Possible Attended Possible Attended AGM P J Manser N/A 3 3 1 1 Y J P Du Plessis N/A 12 12 1 1 Y A J Clark N/A 12 12 2 2 Y D De Lorenzo N/A 10 10 N/A M H Armour Yes 11 12 4 4 4 4 N D R Beran No 10 10 Y G C Bible No 11 12 2 2 Y D S Devitre No 10 12 4 4 Y G R Elliott Yes 12 12 4 4 4 4 Y J F Ferrán Yes 10 10 3 3 Y L M S Knox Yes 12 12 4 4 4 4 Y T A Manuel Yes 11 12 1 1 Y J A Manzoni Yes 2 3 1 1 1 1 Y D F Moyo Yes 11 12 2 2 Y C A Pérez Dávila No 11 12 Y A Santo Domingo Dávila No 12 12 Y H A Weir Yes 12 12 4 4 2 2 Y H A Willard No 3 3 Y – The nomination committee did not meet during the year under review. – Mark Armour was unable to attend the July 2015 annual general meeting and associated board meeting as he was attending a family funeral. – Geoff Bible, Dinyar Devitre, John Manzoni and Carlos Pérez were unable to attend the board meeting in June, which was called at short notice to consider a possible transaction. – Trevor Manuel and Dambisa Moyo were each unable to attend one board meeting in October, which was called at short notice to consider the AB InBev transaction. – Dinny Devitre was unable to attend the board meeting in January due to a pre-existing business commitment. – Domenic De Lorenzo was appointed as a director after the conclusion of the annual general meeting. GOVERNANCEGOVERNANCE 61SABMiller plc Annual Report 2016
  • 66.
    GOVERNANCE |Corporate governancecontinued The work of the board The board brings leadership to the group and sets strategic objectives, determines investment policies, agrees on performance criteria, and delegates to management the detailed planning and implementation of those objectives and policies in accordance with appropriate risk parameters determined by the board. The board monitors achievement against objectives and compliance with policies by holding management accountable for its activities through monthly and quarterly performance reporting and budget updates. The board receives regular briefings from the Chief Executive, the Chief Financial Officer, the General Counsel and Corporate Affairs Director, and from the Group Company Secretary on legal, regulatory and corporate governance matters. Other members of our executive committee make regular presentations to the board, enabling directors to explore and interrogate specific issues and developments in greater detail. In the ordinary course, the board also schedules visits to our regions, normally holding two meetings a year outside the UK, allowing directors the opportunity to meet in-country management. The demands of the AB InBev takeover offer were such that it was necessary to defer executive committee member presentations and that it was not feasible or appropriate to undertake scheduled regional visits to Europe and Africa in September and January, respectively. At the end of each board meeting, the non-executive directors meet without management present. Matters reserved for the board There is a schedule of matters which are dealt with exclusively by the board. These include approval of financial statements; the group’s business strategy; the annual capital expenditure plan; major capital projects; significant changes to the group’s management and control structure; material investments or disposals; risk management strategy; sustainability and environmental policies; and treasury policies. Each standing board committee has specific written terms of reference issued by the board and adopted in committee. The terms of reference of the audit, remuneration and nomination committees are available on our website. All committee chairmen report orally on the proceedings of their committees at the next meeting of the board, and the minutes of all board committee meetings are circulated to all board members. The membership and work of these committees are described on the following pages. From time to time other ad hoc committees may be constituted for specific projects or tasks. Conflicts of interest Our directors are required to avoid situations where they have, or can have, a direct or indirect interest that conflicts, or may conflict, with the company’s interests. As permitted by the Companies Act 2006, the articles of association of the company allow the board to authorise potential conflicts of interest that may arise and to impose such limits or conditions as it thinks fit. Procedures are in place for the disclosure by directors of any potential conflicts and for the appropriate authorisation to be sought if a conflict arises. We are confident that our procedures concerning actual and potential conflicts of interest continue to operate effectively. From press speculation to a recommended offer The work of the SABMiller board Following press speculation, on 16 September 2015 SABMiller announced that it had been informed by AB InBev that it intended to make a proposal to acquire SABMiller. At that time no proposal had been received and the board of SABMiller had no further details about the terms of any such proposal. Under the UK Takeover Code that announcement triggered a 28 day ‘put up or shut up’ (PUSU) deadline for AB InBev to announce a firm intention to make an offer for SABMiller or to announce that it would not be making an offer, and started an intense period of work for the SABMiller board. As a result of the approach and the PUSU deadline, the board rescheduled planned strategy meetings and a market visit in order to focus on the possible transaction. The PUSU deadline was extended three times prior to the announcement of a recommended acquisition on 11 November 2015. During the eight week period from the first announcement on 16 September and 11 November: – the board received detailed briefings on Takeover Code issues and directors’ responsibilities; – five board meetings were held, with near 100% attendance at meetings by directors; – the scheduled SABMiller trading update in October was brought forward by 10 days; – new efficiency and cost savings targets were announced and reported on; – the board received and debated rigorous and detailed presentations on the stand-alone value and prospects of SABMiller; – a large number of board, shareholder, analyst, management and adviser calls and briefings were held; and – the recommended offer was negotiated with AB InBev and approved by the board, after AB InBev raised its initial cash offer of £38 per share six times to the final offer of £44 per share. The agreed terms which were recommended by the board included an undertaking by AB InBev to use its best efforts to secure regulatory clearances, and a break fee of US$3 billion payable to the company in certain circumstances. Throughout the period the board was advised by the General Counsel and by the Group Company Secretary, and by experienced external investment banking and legal advisers. 62 SABMiller plc Annual Report 2016
  • 67.
    The board’s committeesand the executive committee The board currently operates five committees. The composition of each of the audit and disclosure committees is set out below, as is that of the executive committee. The composition and work of the nomination, remuneration and corporate accountability and risk assurance committees are described on pages 64 and 65, and the work of the audit committee is fully described on pages 70 to 73. The audit committee During the year under review the audit committee was chaired by Mark Armour, who first joined the committee on 1 May 2010 and has been its chairman since 6 June 2013. Dinyar Devitre, Guy Elliott, Lesley Knox and Helen Weir also served on the committee throughout the year. Dinyar Devitre has been a member of the committee since 16 May 2007, Guy Elliott since 25 July 2013 and Lesley Knox and Helen Weir since 19 May 2011. The board is satisfied that Mark Armour, Dinyar Devitre, Guy Elliott, Lesley Knox and Helen Weir all have recent and relevant financial experience. Biographical information concerning Mark Armour and the other members of the committee is set out on pages 54 and 55. Further details of the work and responsibilities of the audit committee are included in the audit committee report on pages 70 to 73. The disclosure committee The disclosure committee consists of the Chairman, the Deputy Chairman, the Chief Executive, the Chief Financial Officer, any one other non-executive director, the General Counsel or the Group Company Secretary. The function of the disclosure committee is to meet as and when required to assist the board in ensuring compliance with the company’s obligations under the UK’s Disclosure and Transparency Rules and the Listing Rules, as guided by the General Counsel and by the Group Company Secretary. It also aims to ensure that the channels of communication between executive committee members, the disclosure committee, the Group Company Secretary’s office and the investor relations team are clear, and can enable any decision regarding potential inside information to be escalated rapidly to the disclosure committee, key advisers and the board. The executive committee (excom) The board delegates responsibility for proposing and implementing the group’s strategy and for managing the group to the Chief Executive, Alan Clark, who is supported by excom, which he chairs. Excom members are appointed by Alan Clark, after consultation with the board. The other members of excom are the Chief Financial Officer, regional managing directors and directors of key group functions (legal and corporate affairs, marketing, integrated supply, and human resources). Excom’s purpose is to support the Chief Executive in carrying out the duties delegated to him by the board and, in that context, it executes the strategy and budget approved by the board and, through the Chief Executive and the Chief Financial Officer, reports on these matters to the board. The excom also ensures that effective internal controls are in place and functioning, and that there is an effective risk management process in operation throughout the group. The audit committee reviews the risk management processes put in place by excom and the board reviews the group’s significant risks, following excom’s review of those risks. Roles and responsibilities Roles of the Chairman, Chief Executive, Deputy Chairman and Senior Independent Director The Chairman and Chief Executive have separate roles and the division of responsibilities between them is set out in a written statement of responsibilities approved by the board. The Senior Independent Director serves as an additional contact point for shareholders. He is also available to fellow non-executive directors, either individually or collectively, to discuss any matters of concern in a forum that does not include the Chairman, the executive directors or other members of the management team. The statement of responsibilities of the Deputy Chairman and Senior Independent Director was last revised following Guy Elliott’s appointment and was approved by the board in its meeting in March 2014. Our Chairman and Deputy Chairman are both available to consult with shareholders throughout the year. The board is kept informed of the views of shareholders through regular updates from the Chairman, the Deputy Chairman, the Chief Executive, the Chief Financial Officer, the General Counsel and Corporate Affairs Director, and the Group Company Secretary, as well as through regular circulation to the board and the inclusion in the board papers of reports on comments from, and exchanges with, shareholders, investor bodies and analysts. The roles of executive and non-executive directors Our executive directors are responsible for proposing strategy and for making and implementing operational and strategic decisions. Our non-executive directors complement the skills and experience of the executive directors. They bring independent judgement and constructive challenge to the boardroom and contribute to the formulation of strategy, policy and decision-making through their collective wealth of knowledge and experience of other businesses and sectors. The Group Company Secretary The Group Company Secretary acts as secretary to the board and its committees and attended all meetings during the year under review. The current Group Company Secretary, Stephen Shapiro, was appointed in November 2014, having served as Deputy Company Secretary from 2002. He is also Deputy General Counsel. GOVERNANCEGOVERNANCE 63SABMiller plc Annual Report 2016
  • 68.
    Jan du Plessis Chairmanof the nomination committee Nomination committee report For the first part of the year, the nomination committee was chaired by John Manser until he retired as chairman and as a member of the nomination committee on 23 July 2015, and Jan du Plessis was appointed as chairman of the committee. Jan du Plessis, Geoff Bible, Guy Elliott, Alejandro Santo Domingo and Helen Weir served as members throughout the year. John Manzoni served on the committee until his retirement from the board on 23 July 2015. Lesley Knox was appointed to the committee on 24 September 2015. The committee considers the composition of the board and its committees, and the retirement, appointment and replacement of directors, and makes appropriate recommendations to the board. In doing so it considers diversity in terms of age, experience, gender and balance of skills on the board. Currently three out of seven of the company’s independent non-executive directors are women, and the board comprises members from diverse backgrounds and nationalities. The nomination and appointment of Trevor Manuel, and the nomination of Javier Ferrán for appointment at the annual general meeting in July 2015, were concluded in the last quarter of the prior year and were overseen by the nomination committee. These two appointments concluded a sustained period of progressive renewal, with longer-standing directors standing down and new directors being appointed. The longest-serving independent director immediately following the annual general meeting in July 2015 had six years’ service. The board and the nomination committee are satisfied that the board is well balanced and that the nomination committee has effectively discharged its mandate in this regard. The process of selecting a new chief financial officer, resulting in the appointment of Domenic De Lorenzo, was managed directly by the board. Where vacancies arise, the committee prepares a description of the role and capabilities required for the appointment. Appropriate succession plans for the non-executive directors, executive directors, and senior management are also kept under close review. Where non-executive vacancies arise, the committee may use external consultants to identify suitable candidates for the board to consider. A rigorous selection process, led by search consultants JCA Associates under the guidance of the nomination committee, led to the appointment of Javier Ferrán, and an internal and external search, also assisted by JCA Associates, resulted in the appointment of Domenic De Lorenzo as Chief Financial Officer. JCA Associates has no other connection with the company. Chairman 1 Executive directors 2 Independent non-executives 7 Nominated non-executives 5 0–2 years 5 2–4 years 2 4–6 years 3 6+ years 5 Tenure of the board as at 31 March 2016 Balance of the board as at 31 March 2016 GOVERNANCE |Corporate governance continued 64 SABMiller plc Annual Report 2016
  • 69.
    The remuneration committeeThe corporate accountability and risk assurance committee (CARAC) Lesley Knox Chairman of the remuneration committee Dambisa Moyo Chairman of CARAC During the year, the remuneration committee consisted entirely of independent directors: Lesley Knox (chairman), Mark Armour, Guy Elliott and Javier Ferrán (replacing John Manzoni, who retired from the board in July 2015). The committee is responsible for the assessment and approval of remuneration strategy for the group, for the operation of the company’s share-based incentive plans and for reviewing and approving short-term and long-term remuneration for executive directors and executive committee members. The remuneration committee has implemented a strategy of ensuring that employees and executives are rewarded for their contribution to the group’s operating and financial performance at levels which take account of industry, market and country benchmarks. To ensure that executive and company goals are aligned, share incentives are considered critical elements of executive incentive pay. During the year, the committee was advised by Kepler Associates, which since June 2015 has been part of the Mercer group, which also consults to the group on pensions matters. Kepler Associates has no other connection with the company, as consultants. Details of the company’s remuneration policy and the work of the remuneration committee during the year, are in the directors’ remuneration report on pages 74 to 92. Dambisa Moyo chaired the committee throughout the year. Geoff Bible, Alan Clark and Helen Weir served as members for the entire period. John Manser and John Manzoni retired from the committee on 23 July 2015, and Jan du Plessis and Trevor Manuel joined the committee on 24 September 2015. The committee’s objective is to assist the board in the discharge of its responsibilities in relation to the corporate accountability, including sustainable development, corporate social responsibility and corporate social investment. More details of the committee’s activities are in the sustainable development section of this report and in our separate sustainable development summary report, which is available on our website. The CARAC met twice in the year, in May 2015 and again in March 2016 (this meeting had been scheduled for November 2015, but had to be postponed due to the AB InBev transaction). GOVERNANCEGOVERNANCE 65SABMiller plc Annual Report 2016
  • 70.
    Effectiveness Composition of theboard The board continues to believe that its overall composition remains appropriate, particularly in regard to the independence of character and integrity of all our directors, and the experience and skills they bring to their duties. It also believes that there is an appropriate balance of skills, collective experience, independence, background, knowledge and gender among our non-executive directors to enable them to discharge their duties and responsibilities effectively. Independence The board considers seven directors – Mark Armour, Guy Elliott, Javier Ferrán, Lesley Knox, Trevor Manuel, Dambisa Moyo and Helen Weir – to be independent for the purposes of the Code. The board considers five non-executive directors not to be independent for the purposes of the Code: Geoff Bible, Dinyar Devitre and Dave Beran, as they are nominees of Altria, the company’s largest shareholder; and Alejandro Santo Domingo and Carlos Pérez, as they are nominees of Bevco, the company’s second largest shareholder. Under the Code, a chairman is not considered to be an independent director but is required to be independent upon appointment. Jan du Plessis was appointed as an independent non-executive director in September 2014 before he became Chairman in July 2015. Board, committee and director performance evaluation Performance evaluations are carried out each year and are reported in the subsequent annual report. The board had previously intended to conduct an externally facilitated performance evaluation early in the tenure of our new Chairman, Jan du Plessis. However, as reported above, an extensive evaluation process would have absorbed significant board time and resources precisely when the board and management needed to focus all of their time and resources on the AB InBev takeover offer, and the takeover offer would have meant that the board would have had limited time to benefit from the findings of an external evaluation. We have therefore conducted an internal assessment of the board and its committees, led by our Deputy Chairman Guy Elliott, and report more fully on this evaluation below. If for any reason the takeover offer does not proceed to completion, the board intends then to conduct an externally facilitated evaluation. Effectiveness assessments were conducted in respect of the board and the audit and remuneration committees, and the CARAC, and the performance of the Chairman, individual directors and the Group Company Secretary was also evaluated. For the board and relevant committees, questionnaires were prepared by the Group Company Secretary, and were considered by the respective board and committee members. The views of the members of the respective bodies were canvassed in full and frank discussion. The Chairman and Deputy Chairman considered and reviewed the performance of individual directors and of the Group Company Secretary, while the board, led by the Deputy Chairman (the Chairman having recused himself), reviewed the performance of the Chairman. The effectiveness assessments concluded that the board and its committees were operating effectively, and that the performance of the Chairman, individual directors and the Group Company Secretary was in each case satisfactory. The most important task of the board in the year under review was its consideration of the AB InBev offer. The Chairman’s leadership of the board throughout the negotiation of the offer, in particular, was considered by the board (in his absence) to have been exemplary. Notwithstanding the intense focus required on the offer from AB InBev, good progress was made in addressing each of the areas identified in the prior year review that could benefit from particular focus. Board agendas were further refined to facilitate focus on these matters, the incoming Chief Financial Officer introduced enhanced reporting on financial, operational and brand performance and the CARAC has enhanced its systematic oversight of the group’s strategic focus on key licence to trade risks faced by the company. Information and training Our Group Company Secretary is responsible for advising the board, through the Chairman, on matters of corporate governance. The board and its committees are provided with full and timely information, including detailed financial information, to enable directors to discharge their responsibilities, and for the committees to undertake their duties. All directors have access to the advice of the Group Company Secretary. Independent professional advice is also available to directors in appropriate circumstances, at the company’s expense. During the year ended 31 March 2016 none of the directors sought independent external advice through the company. When directors join the board, tailored induction programmes are arranged which involve industry specific training and include visits to the group’s businesses and, as appropriate, meetings with senior management. New directors are also briefed on their duties to the company and their obligations as directors of a listed company, on risk management activities at head office and on relevant company policies and governance related matters. The planned induction of new directors Javier Ferrán, Dave Beran, and Domenic De Lorenzo was tailored appropriately to take account of the AB InBev offer. The company is committed to the continuing development of directors to help them build on their expertise and develop an ever deeper understanding of the business, and of the markets in which group companies operate. Members of board committees are encouraged to attend internal and external briefings and courses on aspects of their respective committee specialisms. Regular updates on relevant legal, regulatory, corporate governance and technical developments are presented to committee members at each meeting and, as appropriate, to the full board. The Chairman considers the training and development needs of the board and discusses these with the respective directors as necessary. Outside appointments Non-executive directors, including the Chairman, may serve on other boards provided that they continue to demonstrate the requisite commitment to discharge their duties effectively to SABMiller. The nomination committee keeps under review the extent of directors’ other interests to ensure that their external commitments do not compromise the effectiveness of the board and do not give rise to conflicts of interest. The board is satisfied that the Chairman and all of the non-executive directors commit sufficient time to their duties as directors of the company. The Chairman and the non-executive directors standing for re-election have confirmed that they have sufficient time to fulfil their respective obligations to the company. The board firmly believes in the benefit to the group of our executive directors and members of the executive committee accepting non-executive directorships of other companies to widen their experience and knowledge. Accordingly, subject to the agreement of the board, executive directors and executive committee members are permitted to accept external non-executive board appointments and to retain any fees from those appointments. GOVERNANCE |Corporate governance continued 66 SABMiller plc Annual Report 2016
  • 71.
    During the yearunder review none of the executive directors held any such appointment. Sue Clark, an executive committee member, was appointed on 29 February 2016 as a non-executive director of Britvic plc, a company listed on the London Stock Exchange. Of the other executive committee members, Mark Bowman is a non-executive director of Tiger Brands Limited, a company listed on the Johannesburg Stock Exchange, and Ari Mervis is a director of the Melbourne Business School. Retirement of directors The company’s articles of association require that new directors are subject to election at the first annual general meeting following their appointment, and that directors are subject to retirement and re-election by shareholders every three years. The re-appointment of non-executive directors is not automatic. However, the board has determined that all directors will stand for re-election annually. Independent non-executive directors who have served for nine years may be asked to stand for re-election but only if the board remains satisfied both with their performance and that nine years’ continuous service has not compromised their continuing independence. Accountability Risk and the board of directors The directors are ultimately responsible for corporate reporting, risk management and internal control and for reviewing effectiveness. There is a regular schedule for the board to consider and carry out a robust assessment of the group’s principal risks including those which would threaten its business model, future performance, solvency or liquidity and to review how these risks are being managed together with the mitigating actions. The principal risks and uncertainties facing the group are set out on pages 16 and 17. These are regularly reviewed by the board, and the principal risks facing the group have been robustly assessed by the board. The risk management system is designed to manage, rather than eliminate, the risk of failure to achieve business objectives. There is a continuous process in place for identifying, assessing, managing, monitoring and reporting on the significant risks faced by individual group companies and by the group as a whole. This process has been in place for the year under review and up to the approval of the annual report and accounts. The Financial Reporting Council updated the provisions of the Code on risk management and internal control in 2014. The revised Code, and new guidance under it apply to SABMiller in respect of the year under review and the group’s risk management systems has been reviewed to ensure compliance with the revised Code and guidance. The group’s systems of risk management comply with the revised Code and guidance. Audit committee A description of the composition of the audit committee during the year is included in the section dealing with the board and its committees. Information on the responsibilities and work of the audit committee is set out in the audit committee report on pages 70 to 73 and includes its role in overseeing the risk management process implemented by management and advising the board in this regard. Executive committee Excom has specific responsibility for implementing the group’s system of risk management and views the careful and appropriate management of risk as a key management role. Excom reviews our significant risks and subsequently reports to the board on material changes and the associated mitigating actions. Reviews of the effectiveness of the risk management system, and of the group’s principal risks, were carried out by excom in October and December 2015 and in March 2016 and the summary outputs were reported to the audit committee and board respectively. Enterprise-wide risk management Managing business risk to deliver opportunities is a key element of all our business activities, and is undertaken using a practical and flexible framework which provides a consistent and sustained approach to risk evaluation. Business risks, which may be strategic, operational, financial or environmental, or concern the group’s reputation, are understood and visible. The business context determines in each situation the level of acceptable risk and controls. Key features of the group’s system of risk management remain: – group statements on strategic priorities, ethics, purpose and values; – clear business objectives and business principles; – an established risk policy; – a continuous process for identification and evaluation of significant risks to the achievement of business objectives; – management processes to mitigate significant risks to an acceptable level; – continuing monitoring of significant risks and internal and external environmental factors that may change our risk profile; and – a regular review of both the type and amount of external insurance purchased, bearing in mind the availability of cover, its cost and the likelihood and magnitude of the risks involved. In addition to excom’s regular reports to the board on key risks, there is a process of regular reporting to the board through the audit committee on the status of the risk management process. Strategic planning, internal audit and other risk control specialist processes are integrated into line management’s risk processes and simplified risk reporting. Key reports include those that identify, assess and monitor strategic, financial, reputational and operational risks in each country, division, group function and on a group basis. Internal control The FRC Guidance recommends internal control practices for UK listed companies to assist them in assessing the application of the Code’s principles and compliance with the Code’s provisions with regard to internal control. Our systems of internal control are designed and operated to support the identification, evaluation and management of risks affecting the group. These include controls in relation to the financial reporting process and the preparation of consolidated accounts, and extend across all areas of operations. They are subject to continuous review as circumstances change and new risks emerge. GOVERNANCEGOVERNANCE 67SABMiller plc Annual Report 2016
  • 72.
    Key features ofthe systems of internal control are: – the risk management system described on page 67; – written policies and procedures within our businesses; – clearly defined lines of accountability and delegations of authority; – management of operating risk by using appropriate infrastructure (including regional hubs and specialist group functions), controls, systems and codified ways of working (including standard project methodology) and codified people management routines throughout the business; – business continuity planning, including preventative and contingency measures, back-up capabilities and the purchase of insurance; – maintenance of a state of preparedness towards compliance with the requirements of Section 404 of the US Sarbanes-Oxley Act through the identification and testing of key financial controls under our Internal Financial Control (IFC) programme. This is a voluntary initiative, which strengthens internal control systems and processes within the group; – risk management policies and procedures including segregation of duties, transaction authorisation, monitoring, financial and managerial review and comprehensive reporting and analysis against approved standards and budgets; – a treasury operating framework and group treasury team, accountable for all treasury activities, which establishes policies and manages liquidity and financial risks, including foreign exchange, interest rate and counterparty exposures, and incorporates group and regional treasury committees that monitor these activities and compliance with the policies. Treasury policies, risk limits and monitoring procedures are reviewed regularly by the audit committee on behalf of the board; – a group tax policy and tax operating framework which forms the basis of tax governance across the group and is managed by our group tax function which monitors tax risk and implements strategies and procedures to control it, and which is also reviewed regularly by the audit committee on behalf of the board. Assurance on systems of internal control and their effectiveness is obtained through: – an established, regular routine of management reviews and performance reviews by the Chief Executive and excom, with half-yearly reporting to the board; – reviews and testing of key financial controls; – internal audit reviews including programme assurance for large change projects; – testing of certain aspects of the internal financial control systems by the external auditors during the course of their statutory examinations and regular reports to the audit committee by the internal and external auditors; – our regional and group function finance, control and assurance committees consider the results of these reviews within each region and group function twice a year, together with feedback from country audit committees, to confirm that controls are functioning and to ensure that any material breakdowns and remedial actions have been reported to the appropriate boards of directors; and – in relation to our associated undertakings and joint ventures, these matters are reviewed at the level of the associates’ or joint ventures’ boards or equivalent governing committees. At the half year and at the year end the members of regional and country business executive committees, each of our functional directors (legal and corporate affairs; marketing; integrated supply; and human resources), each of the direct reports to the Chief Financial Officer (finance and control; internal audit; corporate finance and strategy; tax; treasury; and investor relations), and the head of our procurement and global business services units (including information technology) are required to submit to the Group Company Secretary on behalf of the board formal letters of representation on compliance with internal controls and key policies, including the group’s Code of Business Conduct and Ethics and Anti-Bribery Policy. These bi-annual letters also require the notification of continuing or potential significant financial, regulatory, environmental or other exposures. These letters form the subject of reports to the audit committee, and cover all subsidiary companies, as well as MillerCoors LLC. Certain of our executive directors and executive committee members sit on the boards of MillerCoors LLC and of relevant holding companies within major associates such as CR Snow, Anadolu Efes and Castel. Directors and members of the executive committee also make annual written declarations of interests and are obliged to report without delay any potential or actual conflicts of interest which may arise. Taking account of the information on principal risks and uncertainties provided on pages 16 and 17, and the ongoing work of the audit committee in monitoring the risk management and internal control systems on behalf of the board for whom the committee provides regular updates as noted on page 67, the board: – is satisfied that it has carried out a robust assessment of the principal risks facing the company including those which would threaten its business model, future performance, solvency and liquidity; and – has reviewed the effectiveness of the risk management and internal control systems including all material financial, operational and compliance controls (including those relating to the financial reporting process) and no significant failings or weaknesses were identified in the context of the group as a whole. In the review of the effectiveness of the risk management and internal control systems the board also took into account: – the bi-annual review of significant risks, including of key mitigating actions; – regular business reviews completed through the year; – matters arising from its oversight of tax and treasury matters; – its review and assessment of the activities of internal audit and the update of items arising from the previous external assessment of its effectiveness; – the outcome of the regional finance and control assurance meetings and the IFC programme; – the outcome of the bi-annual letters of representation process; and – the observations of the external auditors. GOVERNANCE |Corporate governance continued 68 SABMiller plc Annual Report 2016
  • 73.
    Internal audit Our globalinternal audit function consists of the group internal audit team, led by the Chief Internal Auditor, plus regional and country audit functions that operate in each of the group’s principal areas of business. The regional and country functions are centrally directed by the group internal audit team. The country internal audit functions are jointly accountable to local senior finance management and regional heads of internal audit. They also have direct access and accountability to local audit committees and the Chief Internal Auditor. Internal audit reviews, all of which are risk-based and include provision of assurance over financial, operational, IT and transformation programme activities, are performed by teams of appropriately qualified and experienced employees. Third parties may be engaged to support audit work as appropriate. The Chief Internal Auditor, who reports jointly to the audit committee and the Chief Financial Officer, has direct right of access to, and regular meetings with, the audit committee chairman and prepares formal reports for each audit committee meeting on the consolidated activities and key findings of the global internal audit function. The audit committee also has unrestricted access to all internal audit reports, should it wish to review them. Our global internal audit function uses a standardised group-wide internal audit methodology which is in compliance with the International Standards for the Professional Practice of Internal Auditing of the Institute of Internal Auditors. The function operates a formal global quality assurance and effectiveness programme. An annual process gathers feedback against specific performance criteria from a broad range of executive management at the group, regional and country levels and from certain board members. This process, supplemented by results from the function’s own quality assurance reviews, provides a basis for the annual review of the effectiveness of the global internal audit function (coordinated by the Group Company Secretary) and results in a report to the audit committee to support the committee’s formal annual assessment of the effectiveness of internal audit. In addition, a periodic review of internal audit is undertaken, most recently in 2014, by an independent external consultant in accordance with the guidelines of the Institute of Internal Auditors. The audit committee has satisfied itself that adequate, objective internal audit assurance standards and procedures exist within the group. The internal audit function is responsible for facilitating the risk management and reporting processes across the group. It also provides assurance on the effectiveness of the process to excom, the audit committee and the board. Whistleblowing measures The group whistleblowing arrangements provide global coverage for employees and others wishing to raise concerns freely, in local languages. All our employees have the opportunity to make confidential disclosures about suspected impropriety or wrongdoing. No action or retaliation is permitted against any employee making a good faith report about an actual or suspected violation of SABMiller policy. Country or regional ethics committees, the Group Company Secretary, or the General Counsel and Corporate Affairs Director, in consultation with the Chief Internal Auditor if appropriate, decide on the method and level of investigation. The audit committee reviews the group’s whistleblowing arrangements each year to assess whether they remain effective, is notified of all material disclosures made and receives reports on the results of investigations and actions taken. The audit committee has the power to request further information, conduct its own inquiries or order additional action. Relations with shareholders All shareholders were encouraged to attend our annual general meeting held in July 2015, which provided the opportunity to ask questions of the board and chairmen of all board committees. At the meeting, all resolutions were put to a vote on a poll, with the results being published on the company’s website, and on the London and Johannesburg stock exchange news services. As the geographic spread of shareholders inevitably means that they cannot all attend a meeting in the UK, a film and a full transcript of meeting proceedings were published on the company’s website. Similar arrangements are planned for the 2016 annual general meeting. We maintain a dedicated investor relations function which reports to the Chief Financial Officer. The investor relations team builds and maintains long-term relationships with institutional investors and analysts and, in partnership with our corporate and divisional management teams and within the scope of regulation, gives presentations on group performance and regional businesses and strives to ensure that these are understood across the global equity markets, including in one-to-one meetings with investors. Dialogue on sustainable development and socially responsible investment matters is primarily led by the General Counsel and Corporate Affairs Director and by the Director of Sustainable Development, who have focused on meetings with interested investors and stakeholders. During June 2015, our 20 largest shareholders (in addition to those represented on the board), and a number of other shareholders within our 50 largest shareholders who had expressed a wish to engage with the Chairman-elect, were invited to meet the Chairman-elect and Group Company Secretary to discuss any governance or other issues which they wished to raise, and the invitations were taken up by many of them. These meetings were intended to provide our major shareholders with the opportunity to meet and get to know our incoming Chairman, and vice versa, and to discuss matters relating to the group. Following the announcement of AB InBev’s intention to make an offer for SABMiller, we engaged with a large number of our major shareholders to ascertain their perspectives on an offer and the proposed terms, including the price and structure of the offer. Lastly, institutional and shareholder comments on the annual report are conveyed by the Group Company Secretary to the full board. Stephen Shapiro Group Company Secretary For and on behalf of the board of SABMiller plc 10 June 2016 GOVERNANCEGOVERNANCE 69SABMiller plc Annual Report 2016
  • 74.
    Audit committee report GOVERNANCE|Audit committee report Responsibilities The committee’s main role and responsibilities are to assist the board in fulfilling its responsibilities regarding: – the integrity of SABMiller’s interim and full year financial statements and reporting, including the appropriateness and consistent application of accounting policies, the adequacy of related disclosures, and compliance with relevant statutory and listing requirements; – risk management and internal controls, related compliance activities and reporting, and the effectiveness of the internal audit function and whistleblowing arrangements; and – the scope, resources, performance and effectiveness of the external auditors, including monitoring their independence and objectivity. The audit committee assists the board in fulfilling its oversight responsibilities regarding in particular the company’s financial and corporate reporting, risk management and internal controls, and the independence and effectiveness of the external auditors. This report sets out how it has discharged its responsibilities during the year and, in relation to the financial statements, the significant issues it considered and how these were addressed. The board is required to ensure that the annual report is fair, balanced and understandable, and the audit committee assists the board by considering this. Following recent revisions to the UK Corporate Governance Code, the board has included in the annual report a statement on the group’s longer-term viability, and the committee has supported the board by considering assumptions and sensitivities in relation to it. The work of the committee is far-ranging. Without attempting to summarise it here, I would draw attention to the following: In considering the integrity of financial reporting, we considered three particularly significant areas of judgement in detail: the carrying value of goodwill and investments in associates, provisioning for uncertain tax positions, and items excluded from adjusted earnings. In addition to the regular financial reporting of the company, we focused on other financial information issued in relation to the recommended offer for the company. In risk management and internal controls, we noted the additional emphasis on these matters in the recently revised UK Corporate Governance Code and put additional focus on the processes that support the board’s assessment of risk, the mitigating controls, and the effectiveness of their operation. We also focused among other matters on IT network and data security, anti-bribery and corruption policies and compliance, fraud, whistleblowing arrangements, and the cost and efficiency programme, and we reviewed the group’s tax policies. In relation to the external audit, the committee has agreed with our external auditors to continue the tenure of the lead audit partner for the current financial year ending 31 March 2017, which is one year beyond the normal five year rotation period, in view of the recommended offer for the company, the significant deal-related activity and additional workloads and pressures on management. This continuity, the committee believes, will best serve audit quality and reduce risk. Also in view of the recommended offer, the committee will not now hold the audit tender that was planned for later this year for appointment for the financial year commencing 1 April 2017. At the request of the board, the committee considers whether the annual report is fair, balanced and understandable and whether it provides the information necessary for shareholders to assess the group’s position and performance, business model and strategy. The committee has also supported the board by considering assumptions and sensitivities in relation to the board’s statement in the annual report on the group’s longer-term viability. The committee reports to the board on its activities, identifying any matters in respect of which it considers that action or improvement is needed and making recommendations as to the steps to be taken. Committee members, their relevant financial experience and the attendance record are set out in the corporate governance report on pages 61 and 63. The committee’s terms of reference are reviewed annually and are available on our website, www.sabmiller.com. Mark Armour Chairman of the audit committee 70 SABMiller plc Annual Report 2016
  • 75.
    Committee meetings The committeemeets four times in the year. Meetings are attended by the committee members and typically, by invitation, the Chairman, Chief Executive, Chief Financial Officer, senior members of the group finance team, General Counsel, Group Company Secretary, and Chief Internal Auditor. Other non-executive directors have a standing invitation to attend as observers. Other members of management are invited to attend certain meetings in order to provide the committee with greater insight into specific issues and developments. The audit partners and senior members of the group audit team from our external auditors, PwC, attend each meeting. The committee receives and discusses regular written and oral reports from the Chief Financial Officer, the Chief Internal Auditor, the General Counsel, and the external auditors relating to matters falling within the committee’s terms of reference. Reports are also received from time to time by other members of management and other external assurance providers in relation to specific topics addressed by the committee. The committee meets separately at least twice each year with the external auditors without management present and likewise at least annually with the Chief Internal Auditor. The committee chairman has separate meetings at least four times a year with the Chief Financial Officer, the Chief Internal Auditor, and with the external auditors. He also meets separately with the General Counsel, and with the Group Company Secretary. The Chief Internal Auditor, the external auditors, the General Counsel, and the Group Company Secretary have direct access to the committee, primarily through the chairman, on any matter that they regard as relevant to the fulfilment of the committee’s responsibilities. New members of the committee are briefed on matters relevant to the responsibilities of the committee and meet a range of finance management as part of their induction. Training is provided to committee members on financial, regulatory and other compliance matters through briefings presented by the external auditors, the Group Company Secretary and/or the General Counsel. Committee members have a standing invitation to attend the bi-annual finance, control and assurance meetings for each of the group’s regions, and do so on occasion. The committee also has a rotational programme for committee members to receive presentations from, and hold discussions with, the group’s regional finance directors. These focus on the regional finance organisation and succession plans, priorities for the finance teams, implementation within the region of the group’s global systems template and the cost and efficiency programme, and risk management and internal controls. The meetings provide greater insight on these matters to members of the committee and also reinforce the culture of integrity and accountability within the group. The committee chairman briefs the board on the matters discussed at each committee meeting and the minutes of each meeting are circulated to all board members. The committee’s effectiveness was reviewed as part of the effectiveness review of the board and its committees carried out in May 2016. This concluded that the committee was operating satisfactorily and was effective in fulfilling its mandate. Financial and corporate reporting In discharging its responsibilities in relation to the integrity of the interim and full year financial statements and reporting, before their submission to the board for approval, the committee reviewed reports from management and from the external auditors, and discussed with them: – the appropriateness and consistency of application of the accounting policies, their compliance with applicable accounting standards, and the implementation of changes in international financial reporting standards; – the critical accounting judgements and estimations made in the preparation of the financial statements and those matters where there have been substantive discussions between management and the external auditors; – the contingent liabilities and judgements made in respect of significant legal matters, on which the committee receives regular reports from the General Counsel; – the adequacy and clarity of reporting disclosures and compliance with applicable financial and other reporting requirements, including the treatment of exceptional and other items excluded from adjusted earnings used by management as an additional performance measure; – the appropriateness of the going concern basis of accounting and the newly required statement on the group’s longer-term viability, with reference to budgeted and projected future cash flows, debt maturities, cash resources and committed financing facilities, key credit ratios and sensitivity analyses; and – whether the annual report, taken as a whole, is fair, balanced and understandable and provides the information necessary for shareholders to assess the group’s position and performance, business model and strategy. Additionally, the committee reviewed, and discussed with management and the external auditors, other financial information issued in relation to the recommended offer for the company. Critical judgements and key sources of uncertainty in the accounts are set out in note 1 to the consolidated financial statements and these were reviewed by the committee. Of particular significance in the financial statements were the judgements made in respect of the carrying values of goodwill and investments in associates, the provisioning for uncertain tax positions, and the treatment of exceptional and other adjusting items in presenting underlying financial performance. These were addressed by the committee as follows: Carrying values of goodwill and investments in associates The judgements in respect of the carrying values of goodwill and investments in associates and potential asset impairment relate to the assumptions underlying the value in use and fair value less costs of disposal calculations and include the robustness of business plans, long-term growth assumptions and discount rates. The committee received and discussed reports from the Chief Financial Officer on the impairment methodologies applied, the bases for the key assumptions used, a range of sensitivity analyses, and the related disclosures. The committee sought additional information from management on the plans and growth expectations in Australia where carrying values are significant and market conditions are challenging. In the case of South Sudan and the investment in our Angolan associate, impairment had been identified and a charge recognised for the impairment of property, plant and equipment and the carrying value of the investment in the associate. GOVERNANCEGOVERNANCE 71SABMiller plc Annual Report 2016
  • 76.
    GOVERNANCE |Audit committeereport continued Uncertain tax positions The judgements in respect of provisioning for uncertain tax positions relate to the inherent uncertainties in the application of tax law and practice, the assumptions underlying deferred tax asset recognition, and the complexity of assessing potential liabilities across numerous jurisdictions. The committee received and discussed a report from the Chief Financial Officer on the potential liabilities identified and estimates applied and on assumptions used in respect of deferred tax asset recognition. Exceptional and adjusting items The judgements in relation to exceptional and other adjusting items relate to whether they are appropriate to exclude in presenting underlying financial performance in the group’s key performance indicators of EBITA and adjusted EPS. The committee received and discussed reports from the Chief Financial Officer on each exceptional and adjusting item to determine whether they were appropriate, and in accordance with the group’s established policy on these matters, consistently applied. The committee discussed in particular the adjustment for the impairments and related losses in South Sudan and Angola, the costs arising as a result of the AB InBev bid proposals and recommended offer, including whether or not accelerated recognition of share-based charges would be appropriate as a result of the offer, and the costs incurred in relation to the planned brewery closure in MillerCoors. The committee also monitored conformity with the agreed policy approach in relation to the exceptional and business as usual costs of the cost and efficiency programme, and considered the assurance provided on the allocation of costs and the reporting of benefits. The committee received reports from the external auditors on each of these matters and discussed with them the judgements made. The committee was satisfied with the explanations provided and conclusions reached. The committee reviewed and discussed with management the processes undertaken to ensure that the annual report was fair, balanced and understandable and reviewed drafts of the annual report to consider whether, based on the knowledge and understanding of committee members, it appeared to be so. The committee received reports from the Chief Internal Auditor and the external auditors on whether or not, having reviewed the document, the results of their respective reviews and other work would suggest otherwise. The General Counsel reported on the steps taken to verify the accuracy of statements in the annual report, and on compliance with legal disclosure requirements. Based on this, the committee recommended the annual report to the board as fair, balanced and understandable, and as providing the information necessary for shareholders to assess the group’s position and performance, business model and strategy. Risk management and internal controls With respect to its oversight of risk management and internal controls, the committee reviewed and discussed a wide range of matters with management, and with the internal auditors and external auditors as appropriate. These included the process changes appropriate to ensure that the risk management and internal control activities of the group aligned fully with the requirements of the recently revised UK Corporate Governance Code. It also included discussion of risks arising as a consequence of the recommended offer and how these would be mitigated during the period to completion of the transaction. The committee: – reviewed the processes for the identification, management and monitoring of material risks across the group, and discussed changes to the principal risks and risk profiles during the year; – discussed the principal risks identified by the risk management processes, the mitigating actions, the monitoring of their effectiveness, residual risk and risk appetite. These were also discussed by the board. As part of its review of the annual report, the committee reviewed disclosures with respect to principal risks and mitigating factors; – received and discussed regular reports from the Chief Internal Auditor on the progress of internal audit work against the agreed annual plan, the principal findings of the internal audit work undertaken, actions agreed with management, and the progress on implementation of prior recommendations. The reports also provided further detail on assurance activities in respect of major change projects under way in the group, including the findings of any third party firms appointed to provide related assurance services, and addressed any identified frauds of significance. Areas of assurance focus during the year included: management of the rollout of the global template; implementation of the cost and efficiency programme; IT network and data security; implementation of and compliance with anti-bribery and corruption policies; and progress towards voluntary compliance with the requirements of Section 404 of the Sarbanes-Oxley Act relating to the documentation and testing of internal controls over financial reporting; – reviewed and approved the annual internal audit plan and resource requirements; – reviewed the effectiveness of the internal audit function, including consideration of its scope as set out in the terms of reference, the adequacy of resources, including skills and expertise, the relevance of its findings and quality of reporting, and the impact of its recommendations. The committee reviewed a report on the implementation of the recommendations arising from the previous external review of the effectiveness of internal audit and noted progress, particularly in relation to the more extensive use of data analytics; – received and discussed regular reports from the General Counsel on compliance matters, including the operation of the group’s code of business conduct and ethics and related training programmes, the adequacy of the group’s anti-bribery and corruption framework and the implementation of its policies, and whistleblowing arrangements. In relation to the group’s whistleblowing arrangements the committee received reports from the General Counsel on concerns raised through these arrangements, both to assess whether these suggested any need for the enhancement of internal controls, and to assess whether the whistleblowing arrangements appear to be functioning effectively, with proportionate and independent investigation of reported matters, appropriate protection for whistleblowers, and suitable follow-up action. The General Counsel also reports to the committee on the bi-annual letters of representation received from the group’s businesses on compliance matters and on management actions taken on any issues identified; – received and discussed a presentation from the Chief Information Officer on cyber security, including a progress report on the programmes being implemented to protect the group against this evolving risk; – reviewed with the Chief Financial Officer and the Director of Group Tax the group’s tax policies and operating frameworks, revisions proposed to take account of evolving best practice and experience, and the annual Our Approach to Tax report. After discussion, amendments updating the policies were agreed by the committee for endorsement by the board; 72 SABMiller plc Annual Report 2016
  • 77.
    – received reportsat each meeting of the committee on compliance with treasury policies, including commodity hedging and counterparty credit limits; – received updates on the group’s global insurance arrangements, and on the operation and funding of the group’s defined benefit post-retirement plans; and – received regular updates from the Chief Financial Officer on developments within the finance function. As part of the year-end procedures, and based on the activities described above, the audit committee reviewed the effectiveness of the systems of internal control and risk management during the financial year. The objective of these systems is to manage, rather than eliminate, the risk of failure to achieve business objectives. Accordingly, they can only provide reasonable, but not absolute, assurance against material misstatement or loss. The committee reported to the board on this basis. External audit independence and effectiveness SABMiller has a well-established policy on the independence of the external auditors and management of the company’s relationship with them. This sets out: the committee’s responsibilities in the selection of auditors to be proposed for appointment or reappointment and for agreement on the terms of their engagement, audit scope and remuneration; the auditor independence requirements and the policy on the provision of non-audit services and the rotation of audit partners and staff; and the conduct of the relationship between the auditors and the committee. The auditors are precluded from engaging in non-audit services that would compromise their independence or violate any professional requirements or regulations affecting their appointment as auditors. The auditors may, however, provide non-audit services which do not interfere with their independence, and where their skills and experience make them a logical supplier, subject to pre-approval by the committee. The policy stipulates the types of work that are not permitted to be performed by the auditors and those which may be permitted in appropriate circumstances. The group’s procedures require that any non-audit services proposed to be provided by the auditors be supported by justification as to why the appointment of the external auditors to provide the services is in the best interests of the group, and how auditor independence would be safeguarded in the specific context of the proposed services. The committee has, at each meeting, reviewed and agreed the non-audit services provided in the year and the related fees, which are summarised in note 3 to the consolidated financial statements. SABMiller does not indemnify its external auditors and there are no contractual obligations restricting the choice of external auditors. The external auditors, PricewaterhouseCoopers, later becoming PricewaterhouseCoopers LLP (PwC) in 2003, were appointed as the company’s auditors in 1999 when the company moved its headquarters from Johannesburg to London and listed on the London Stock Exchange. PwC has confirmed to the committee its continuing independence and compliance with the SABMiller policy on auditor independence. The external auditors are required to rotate the lead audit partner responsible for the audit engagement every five years, unless there are unusual extenuating circumstances when a further year may be considered. The lead audit engagement partner, Richard Hughes, has now completed five years. In view of the recommended offer for the company, the significant deal-related activity and additional workloads and pressures on management, the committee has agreed with PwC that Richard Hughes should continue as the lead audit partner for the current financial year ending 31 March 2017, which is one year beyond the normal five year term. The committee believes that continuity at this time will best serve audit quality and reduce risk. To address any possible independence concerns arising from this extension of term, PwC has arranged to appoint an independent partner to monitor the execution of the audit. This is additional to the oversight of the audit by the engagement quality review partner assigned to our audit. This latter role is not part of an audit team per se but provides an internally independent view within an audit firm on the conduct of the audit and the audit judgements made. The committee conducted its annual review of the performance of the external auditors and the effectiveness of the external audit process for the year ended 31 March 2016. The review was based on a survey of key stakeholders across the group, consideration of public regulatory reports on PwC member firms, and the quality of the auditors’ reporting to and interaction with the committee. Based on this review, the committee was satisfied with the performance of the auditors, their objectivity and the effectiveness of the audit process. In the light of this and their continued independence, the committee has recommended to the board that a resolution for the reappointment of PwC as the external auditors for the financial year ending 31 March 2017 be proposed at the annual general meeting. The European Union has directed member states to adopt legislation by 2016 requiring that companies change their external auditors at least every 10 years, or every 20 years if an audit tender is held after 10 years, subject to transitional rules, and restricting further the non-audit services that may be provided. Under the transitional rules of the new EU regulations, mandatory auditor rotation would require that new auditors for the company be appointed for the year ending 31 March 2024 at the latest. The Competition and Markets Authority Statutory Audit Services Order 2014 is consistent with these requirements on audit tendering. The UK Corporate Governance Code requires, on a comply or explain basis, that the audit is put out to tender at least every 10 years, subject to transitional guidance that, when a tender has not been held in the past 10 years, it would be appropriate to coincide a tender with the next rotation of the lead audit engagement partner. In view of the recommended offer, the committee will not now hold the audit tender that was planned for later this year for appointment for the financial year commencing 1 April 2017. The committee believes avoiding the distraction of a tender during the period preceding a conclusion of the recommended offer to be in the best interests of shareholders. Should a transaction not be completed, it is the committee’s intention that an audit tender process be initiated as soon as practicable thereafter for appointment for the following year, which in these circumstances would likely be the financial statements for the year ending 31 March 2018. The Competition and Markets Authority Statutory Audit Services Order 2014 sets out certain regulations in respect of audit tendering and appointments and related audit committee responsibilities which came into effect for financial years commencing on or after 1 January 2015. The company has complied with the provisions of the Order for the financial year ended 31 March 2016. GOVERNANCEGOVERNANCE 73SABMiller plc Annual Report 2016
  • 78.
    GOVERNANCE Directors’ remuneration report Annualstatement by the chairman of the remuneration committee Dear shareholder On behalf of the board, I am pleased to present the remuneration committee’s report for 2016. I summarise the group’s performance and the resulting pay outcomes for the year ended 31 March 2016, and highlight some of the key issues that the remuneration committee considered during the year. Performance and outcome The strategy to strengthen core brands, expand the beer category to reach more consumers on more occasions, and place an emphasis on premiumisation, created superior underlying revenue, EBITA and adjusted EPS growth for the year ended 31 March 2016. Group net producer revenue was up 5% with group EBITA growth of 8% on an organic, constant currency basis. Adjusted EPS increased by 12% on the same basis over the year. It is a reflection of the dedication and focus of management and employees that this performance has been achieved in spite of the distraction of the recommended AB InBev offer. In terms of TSR, we remain ahead of our competitors, with growth of 115% over the five years to 31 March 2016. £100 invested in SABMiller five years ago was worth £215 on 31 March 2016, compared with £202 if invested in the median of our peer group, or only £126 if invested in the FTSE 100 index. Furthermore, £100 invested in SABMiller upon our listing in London in 1999 would have been worth £1,477 on 31 March 2016. Underlying revenue, EBITA and adjusted EPS growth resulted in above target bonuses for the year. However, the translational impact of currency depreciation against the US dollar caused some long-term incentive awards with three to five-year performance periods to lapse with a nil payout. Adjusted EPS increased by 9% per annum over the last three years, on a constant currency basis, but the continued strengthening of the US dollar (being the currency in which we report our group results) eroded those figures to show a decline in reported adjusted EPS of 2% per annum, which is below the threshold performance levels necessary for share options and performance shares to vest. TSR out-performed, and therefore the value shares with three to five-year performance periods ended in the year to 31 March 2016 have partially vested. Further details of the performance measures and resulting outcomes are shown on page 83 for the annual bonus plan, and on page 85 for the long-term incentives. Executive director changes Domenic De Lorenzo was appointed Chief Financial Officer and an executive director on 23 July 2015, having been the acting Chief Financial Officer since February 2015. Domenic was previously Director of Group Strategy and Corporate Development and a member of SABMiller’s executive committee. Therefore this was an internal appointment and the committee reviewed his pay Lesley Knox Chairman of the remuneration committee It is the remuneration committee’s responsibility to ensure that payments to executives are appropriate and aligned with shareholder interests.” 1 Apr 2011 31 Mar 2012 31 Mar 2013 31 Mar 2014 31 Mar 2015 31 Mar 2016 80 100 120 140 160 180 200 220 240 Value of £100 invested 5 years ago (1 April 2011) SABMiller £215 Peer median £202 FTSE 100 £126 26 Feb 1999 31 Mar 2016 80 280 480 680 880 1080 1280 1480 1680 Value of £100 invested upon London listing (1999) SABMiller £1,477 Peer median £495 FTSE 100 £179 74 SABMiller plc Annual Report 2016
  • 79.
    arrangements in accordancewith the recruitment policy for internal appointments as shown on page 78. Recognising that Domenic was new to the role, his base pay was set at £680,000 per annum, at the lower end of the market range and below the £762,200 per annum paid to the previous incumbent. This pay level was set in anticipation that future pay increases would enable his base pay to increase to around median over time, subject to performance. For the year commencing 1 April 2016, his base pay has been increased by 5.1% to £715,000. In accordance with the recruitment policy for internal appointments, Domenic’s long-term incentive awards that had not vested at the time of his appointment as an executive director would remain subject to their original performance conditions and vesting timescale. No sign-on or other similar compensation was paid, or is payable. Impact of change of control Following the approach by AB InBev, the committee met in October 2015 and again in November 2015 to consider the impact and determine the treatment of remuneration upon a change of control. The committee considered the remuneration policy and rules of the remuneration plans. The circumstances and likely timeline to a change of control were also considered. The following key principles and resulting treatment were determined in accordance with the remuneration policy and rules of the remuneration plans: – For the period before change of control – business continues as normal, and the treatment of remuneration also continues as normal. This includes pay reviews, annual bonus outcomes, vesting and grant of long-term incentive awards determined in the normal way. – Upon change of control – executive remuneration plans that are part-way through their performance periods will be brought to a close upon change of control, with the annual bonus opportunity pro-rated for the period to change of control. In accordance with the plan rules, unvested long-term incentives granted more than 12 months before change of control will vest in full where an EPS performance condition applies (the committee having considered financial forecasts and likelihood of vesting), and those with a TSR performance condition will be determined by TSR performance to change of control. Any long-term incentive awards granted within 12 months of change of control will be pro-rated for the period to change of control. The agreement reached with AB InBev, as part of the recommended offer, provides that certain employees (but not executive directors or executive committee members) may receive retention payments of up to a maximum of 100% of annual base pay, payable over a period of up to 24 months. Additional retention, transaction and integration bonus arrangements may also be put in place, as outlined in the joint announcement on 11 November 2015, available on our website. These additional arrangements do not form part of the group’s remuneration policy and do not apply to executive directors. If, as a result of change of control, an executive director’s employment is terminated, they will be entitled to receive a payment in lieu of their notice period (not exceeding 12 months) comprising base pay, retirement benefits and other benefits, plus any local or statutory redundancy entitlement, but no compensation is payable for annual bonus or long-term incentive opportunities forgone in respect of that notice period. Committee changes Javier Ferrán joined the board and the committee on 23 July 2015 and I am grateful for his contribution. I also thank the other committee members for their dedicated service to the company and this committee. It is the remuneration committee’s responsibility to ensure that payments to executives are appropriate and aligned with shareholder interests. Payments for the year ended 31 March 2016, the setting of new executive director pay, the treatment of remuneration upon change of control with the exclusion of executive directors from any retention, transaction and integration bonus arrangements, have maintained this principle. Yours sincerely, Lesley Knox Chairman of the remuneration committee 10 June 2016 Remuneration at a glance The table below summarises the pay of the executive directors in respect of the year ended 31 March 2016. Further details are contained in pages 81 to 85 of this report. Name Base pay Retirement and other benefits Annual bonus Long-term incentives2 Total remuneration £’000 £’000 £’000 % of maximum £’000 % of maximum 2016 £’000 2015 £’000 % change Alan Clark (Chief Executive) 1,167 593 1,709 84% 2,404 23% 5,873 7,072 -17% Domenic De Lorenzo (Chief Financial Officer)1 471 159 462 82% 992 41% 2,084 – n/a Fixed pay Short-term incentives Long-term incentives 1 Domenic De Lorenzo was appointed a director on 23 July 2015 and this table shows his remuneration from that date. 2 The value of long-term incentives includes those granted to executive directors in respect of their prior service as employees, rather than only those granted to them as, or in contemplation of their appointment as, executive directors. GOVERNANCEGOVERNANCE 75SABMiller plc Annual Report 2016
  • 80.
    Fixed pay Short-termincentives Base pay Retirement benefits Other benefits Annual bonus plan Purpose and link to strategy Provides a fixed level of earnings, appropriate to the market and requirements of the role. Provides a basis for savings to provide an income in retirement. Provides benefits and allowances appropriate to the market, and to assist executives in efficiently carrying out their duties. Incentivises and rewards the achievement of annual financial performance balanced with the delivery of the company’s strategic priorities. With base pay set at around median, the annual bonus plan ensures that above-market pay cannot be achieved unless challenging performance targets are met. Operation Base pay is reviewed annually with effect from the start of each financial year. There is no obligation to increase base pay upon any such review. SABMiller does not provide guaranteed retirement income (defined benefit pension), but makes defined contributions towards pension savings. In the UK, amounts up to the annual and lifetime allowances are generally contributed to the SABMiller plc UK Staff Pension Scheme (a registered defined contribution pension scheme in which all UK employees are eligible to participate). Any amounts in excess of these limits are notionally credited to the company’s unfunded retirement benefits scheme, or paid in lieu as a taxable cash amount. Benefits and allowances may include a company car or car allowance, fuel card, family medical and dental insurance, long-term disability insurance, life insurance, accompanied travel, occasional overnight accommodation, legal and professional fees relevant to duties, club subscriptions, and a beer allowance. In addition, executive directors may also participate in employee discount programmes and all-employee share plans on the same basis as other employees. Executive directors also have access to the same facilities as other UK employees, including access to on-site staff car parking at certain locations and a company bar. The total bonus opportunity is split: – minimum of 60% annual financial performance; and – maximum of 40% individual strategic objectives. This balance, with a significant proportion of the annual bonus opportunity based on longer term and sustainability metrics ensures that the achievement of short-term financial performance is not at the expense of enabling future shareholder value creation. If overall business performance is not satisfactory, or if there is required to be a material restatement of financial results (other than due to a change in accounting policy), misconduct, or other action causing harm to the reputation of the company, all or part of any annual bonus not already paid may be forfeited, and any annual bonus already paid may be clawed-back. Opportunity and maxima Around median for the relevant market (generally the FTSE-30 for UK-based executive directors), while recognising experience and responsibilities. Any increases will be in the context of overall business performance, with reference to the market median and any further increases will not exceed the average annual increase awarded to other UK-based employees. Pension contributions for executive directors are fixed at 30% of base pay. Company car allowance is fixed at £17,150 per annum. The maximum amount paid for other benefits will be the actual cost of providing those benefits which, particularly in the case of insured benefits, may vary from year to year, although the committee is mindful of achieving the best value from benefit providers. The policy maximum bonus opportunities for executive directors at each performance level are: – Maximum: 200% of base pay. – Target: 100% of base pay. – Threshold: 50% of base pay. The current bonus opportunities are: Chief Executive: up to a maximum of 175% of base pay, with 87.5% of base pay at target, and 43.75% of base pay at threshold. Other executive directors: up to a maximum of 120% of base pay, with 60% of base pay at target, and 30% of base pay at threshold. Performance measures Not applicable. Not applicable. Not applicable. The annual financial performance measures and weightings are reviewed each year, and may be changed to ensure that they continue to align with the company’s key strategic priorities. The range of performance measures will typically be selected from revenue, market share, volume, cost savings, profit, return on capital, cash, working capital, margin growth, EPS and sustainability metrics including water usage, reductions in fossil fuel emissions, and health and safety measures. Remuneration policy GOVERNANCE |Directors’ remuneration report continued Remuneration policy notes 1 The committee reserves the right to make any remuneration payment, notwithstanding the policy set out in this report, where the terms of the payment were determined before the policy came into effect, or if the individual was not an executive director at the date the remuneration was determined (unless that remuneration was set in consideration or in anticipation of becoming an executive director). The committee may make minor amendments to the policy (for regulatory, exchange control, or administrative purposes, or to take account of a change in other legislation) without obtaining shareholder approval for that minor amendment. 2 The remuneration policy for other UK employees is similar to that for executive directors in accordance with our philosophy that remuneration should be appropriate to the local competitive market. Certain components of remuneration (for example, car allowance and long-term incentives) are paid only to certain levels of employees. There are other variances depending on geographic location and local market practice, but the general approach is consistent across the group. This report covers the year from 1 April 2015 to 31 March 2016, and complies with the requirements of the Large and Medium-sized Companies and Groups (Accounts and Reports) Regulations 2008 (as amended) (‘the regulations’) and the provisions of the UK Corporate Governance Code relating to remuneration. The format and content take into account the Directors’ Remuneration Reporting Guidance of the GC100 and Investor Group, together with other guidance issued by institutional investor and governance bodies. It is intended that the remuneration policy will be put to a shareholder vote every three years (unless an earlier change of policy is proposed) and will apply from the date of the relevant general meeting. The policy described in the 2014 report took effect from 24 July 2014, following shareholder approval at the 2014 annual general meeting. No changes have been made to the policy and accordingly the policy is not being 76 SABMiller plc Annual Report 2016
  • 81.
    Long-term incentives Share optionplan Share award plan Shareholding requirement Non-executive directors’ fees Provides a direct and transparent link between executive pay and value creation for shareholders. Share options may be structured as stock appreciation rights (SARs), which are economically equivalent to share options but result in less dilution of share capital. The combination of a share option plan and share award plan enables executives to be incentivised and rewarded for achieving a broader range of performance measures, in addition to share price increase. Provides alignment with shareholder returns by ensuring a reduction in executive directors’ own wealth if there is a reduction in SABMiller’s share price. Compensates non-executive directors for their responsibilities and time commitment. Share options reward executive directors only if there is an absolute increase in the share price. Furthermore, to ensure that any share price increase is supported by a sustainable improvement in the group’s underlying financial performance, additional performance conditions are applied before vesting of: – two-thirds of the share options after three years; and – one-third of the share options after five years. Vesting at threshold cannot be greater than 65% of the maximum award for the Chief Executive and 80% of the maximum award for other executive directors (but see note 4 below). If these performance conditions are not met, the appropriate proportion of share options will lapse, and there is no opportunity for retesting. If there is required to be a material restatement of financial results (other than due to a change in accounting policy), misconduct, or other action causing harm to the reputation of the company, all or part of any share award not yet vested may be forfeited, and any share award already vested may be clawed-back. Share awards comprise performance shares and value shares. Performance shares vest in a single tranche on the third anniversary of the grant date, subject to achieving the performance conditions. 25% of the shares vest at threshold, with 100% vesting at maximum. Value shares vest only if SABMiller’s TSR out-performs the median of a comparator group. No shares vest for median performance or below, but for every £10 million of additional shareholder value created (being the percentage out-performance multiplied by the company’s market capitalisation at the commencement of the performance period), a fixed number of shares will vest. Value shares vest one-third on each of the third, fourth and fifth anniversaries of the grant date, based on performance to these fixed dates. If the performance conditions are not achieved by the relevant dates, the appropriate proportion of the share awards will lapse, and there is no opportunity for retesting. If there is required to be a material restatement of financial results (other than due to a change in accounting policy), misconduct, or other action causing harm to the company, all or part of any share award not yet vested may be forfeited, and any share award already vested may be clawed-back. Any shares arising from the exercise of share options or vesting of share awards must be retained (except those shares sold to pay the exercise price and any tax upon exercise or vesting of any such award) until the relevant shareholding requirement is met, unless the committee determines otherwise in exceptional circumstances. Fees are reviewed annually by the board, and the Chairman’s fee is determined annually by the committee. Fees are paid in cash, but may be paid in shares having the equivalent value at the request of the non-executive director. Non-executive directors are not eligible to participate in any of the company’s incentive plans, and receive no benefits other than a beer allowance which is at the same level as for UK-based employees. Grants are made annually at the discretion of the committee. Chief Executive: share options with a face value at grant up to a maximum of 500% of base pay. Other executive directors: share options with a face value at grant up to a maximum of 400% of base pay. Grants are made annually at the discretion of the committee. Chief Executive: performance shares with a face value at grant up to a maximum of 250% of base pay, plus value shares up to a maximum of 125 shares for every £10 million of additional shareholder value created. Other executive directors: performance shares with a face value at grant of up to a maximum of 200% of base pay, plus value shares up to a maximum of 100 shares for every £10 million of additional shareholder value created. Shares owned outright equivalent to: Chief Executive: 300% of base pay. Other executive directors: 200% of base pay. Fees are set at around median for the FTSE-30. Any increases will be in the context of overall business performance, and with reference to the market median. A core financial performance measure (being EPS growth over periods of three and five years). A core financial performance measure for performance shares (being EPS growth over three years). An external relative performance measure for value shares (being TSR out-performance of the median of a comparator group over three, four and five years). Not applicable. Not applicable. 3 The specific financial performance measures applicable to short-term and long-term incentive plans may be varied to align with the company’s key strategic priorities. The targets for each performance measure are set to be stretching, based on a number of reference points including company targets, analyst forecasts, and shareholder expectations. 4 The approved policy allows for threshold vesting of share options at up to 65% of maximum for the Chief Executive and up to 80% of maximum for other executive directors. However, the remuneration committee has confirmed that in applying the policy for share options granted from 2015, the percentage of any award capable of vesting at threshold performance will not exceed 25% of maximum. put to a shareholder vote this year. A full copy of the remuneration policy approved by shareholders is included in the 2014 annual report. Key aspects of the remuneration policy are reproduced in this year’s report for ease of reference. Remuneration policy table The table below sets out the remuneration policy that applies to executive directors from 24 July 2014, approved by shareholders at the 2014 annual general meeting. GOVERNANCEGOVERNANCE 77SABMiller plc Annual Report 2016
  • 82.
    Remuneration policy continued GOVERNANCE|Directors’ remuneration report continued Service contracts and notice periods It is the policy that executive directors have service contracts with the company which may be terminated with not less than 12 months’ notice given by the company or by the executive. The committee retains the discretion to appoint a new executive director on a notice period of up to 24 months reducing to 12 months during the first year, such that after 12 months’ service the notice period would have reverted to the standard 12 months. Non-executive directors do not have service contracts, but serve the company under letters of appointment which may be terminated without liability for compensation. Date first appointed to the board Date of current service contract or letter of appointment Date next due for election or re-election Non-executive chairman Jan du Plessis 1 September 2014 23 July 2015 2016 AGM Executive directors Alan Clark 26 July 2012 23 May 2013 2016 AGM Domenic De Lorenzo 23 July 2015 23 July 2015 2016 AGM Non-executive directors Mark Armour 1 May 2010 14 April 2010 2016 AGM Dave Beran1 23 July 2015 12 October 2005 2016 AGM Geoffrey Bible 1 August 2002 27 September 2002 2016 AGM Dinyar Devitre 16 May 2007 16 May 2007 2016 AGM Guy Elliott 1 July 2013 4 April 2013 2016 AGM Javier Ferrán2 23 July 2015 23 July 2015 n/a Lesley Knox 19 May 2011 17 May 2011 2016 AGM Trevor Manuel 1 March 2015 27 January 2015 2016 AGM Dambisa Moyo 1 June 2009 26 May 2009 2016 AGM Carlos Pérez Dávila 9 November 2005 12 October 2005 2016 AGM Alejandro Santo Domingo Dávila 9 November 2005 12 October 2005 2016 AGM Helen Weir 19 May 2011 17 May 2011 2016 AGM 1 Dave Beran was appointed to the board on 23 July 2015 under the company’s existing agreement with Altria Group, Inc (Altria) dated 12 October 2005. He has no separate letter of appointment. 2 Javier Ferrán will step down from the board at the annual general meeting on 21 July 2016. Copies of the relevant service contracts or letters of appointment can be viewed at the company’s registered office, or in the case of service contracts, on the company’s website at www.sabmiller.com. Recruitment policy The committee will pay no more than it considers necessary to attract appropriate candidates, and it is not contemplated that remuneration will need to be different from the structure or exceed the limits set out in the remuneration policy table. The maximum variable remuneration will be in line with that set out in the policy table on pages 76 and 77. For internal appointments, the committee may allow any unvested long-term incentive awards upon appointment to remain subject to the original performance conditions and vesting timescale applicable to those awards. For external appointments, where a newly appointed executive director forgoes a bonus or long-term incentive award (or similar) upon leaving a previous employer, the committee will determine the expected value of the amounts forgone (taking into account any performance conditions and duration until vesting), and may pay compensation in cash, in SABMiller shares, or an award of long-term incentives, but, in any event, the total compensation amount will not exceed the expected value of the amounts forgone. Furthermore, any such compensation will be subject to forfeiture and clawback if the executive leaves the company voluntarily within a fixed time period determined by the committee, being not less than two years. Compensation for amounts forgone upon recruitment is not payable to non-executive directors. 78 SABMiller plc Annual Report 2016
  • 83.
    Termination policy The committee’sapproach, when considering payments in the event of termination, is to take account of the individual circumstances including the reason for termination, any contractual or other legal obligations, and the relevant share plan and pension scheme rules. The overriding principle is that there should be no reward for failure. While the treatment applied is at the discretion of the committee, in normal circumstances the application is tabulated below. Reason Fixed pay Short-term incentives Long-term incentives Voluntary termination, giving notice to company. Nil after notice period has been completed, with provision for pay in lieu of notice, comprising base pay and benefits only. Forfeited. Any unvested share options, share awards and deferred shares are forfeited. Any vested but unexercised share options must be exercised before the date of termination. Retirement, injury, disability, or ill-health. Nil after leaving date. Long-term disability insurance may become payable. Not contractual, but normal practice is to pro-rate the annual bonus for the year in which the employee departs, subject to performance. Not contractual, but normal practice is that unvested share options and share awards are pro-rated for time served, with vesting subject to applicable performance conditions. Any vested but unexercised share options must be exercised within 12 months of termination. Redundancy, or other termination. Fixed pay in lieu for the remainder of the notice period, less any deduction considered appropriate and reasonable taking into account any accelerated receipt of payment and the employee’s duty to mitigate any loss, subject to any statutory minimum entitlements which may apply. Death in service. Fixed pay will cease at the end of the month in which death occurs. Life insurance and dependant pension (if any) may become payable. Subject to the absolute discretion of the committee. Any unvested share options and share awards may vest in full, or in part or may lapse completely depending on the specific circumstances and business performance to the date of death. Policy on external appointments Each executive director is permitted to accept a non-executive directorship in another company, subject to the prior approval of the board. This will normally be limited to one appointment. Fees received in respect of external appointments may be retained by the individual. Currently, no executive director has non-executive directorships in external companies. Pay and employment conditions across the group The company operates in a number of different locations with employees paid by reference to applicable market rates, and base pay reviewed annually. The ratio between fixed and variable pay for employees differs by level, geographic location and business unit. Variable performance- related pay and share plans operate across the group but may differ in terms of structure, award levels and performance measures. Long-term incentives on similar terms to executive directors are cascaded to the other executive committee members, and to around 1,700 other employees in the group. Employment conditions and benefits are determined according to the local market to enable high standards of health and safety and employee wellbeing. The company does not consult directly with employees when determining directors’ remuneration, but undertakes regular employee engagement surveys which provide a mechanism for feedback on a number of issues, including remuneration. Furthermore, many employees are also shareholders in SABMiller, and are able to participate in the votes on directors’ remuneration. Remuneration comparison measurements are not used routinely, because of the inconsistencies in comparing pay levels across different geographies and workforce profiles. Discretion and judgement Discretion is necessary to ensure that outcomes remain appropriate in all the circumstances, including those not anticipated by the remuneration policy. Mechanistic or formulaic remuneration outcomes are not always appropriate in context, and the committee may exercise discretion to adjust a payment, performance metric or targets in exceptional circumstances. Judgement is applied by the committee in setting performance targets to ensure they are sufficiently stretching, and to alter performance metrics and targets if they are no longer a fair measure of performance (providing any new metrics and targets are not materially less challenging than the originals). The committee has discretion to interpret the rules of any remuneration plan, and to determine the participation and level of the awards including the extent of vesting of awards under certain leaver situations. The committee also maintains discretion to adjust share awards in the event of a variation of capital, and to determine the treatment in the event of a corporate transaction, including whether incentives vest in full, or in part, or lapse completely, or are rolled over into replacement awards, and how any special dividend might be treated. If there is required to be a material restatement of financial results (other than due to a change in accounting policy), misconduct or other action causing harm to the reputation of the company, the committee has the discretion to adjust, forfeit or clawback payments and awards in respect of a participant, a group of participants, or all participants. GOVERNANCEGOVERNANCE 79SABMiller plc Annual Report 2016
  • 84.
    GOVERNANCE |Directors’ remunerationreport continued Annual report on remuneration During the year ended 31 March 2016 and to the date of this report, committee members’ attendance at meetings and details of the core agenda items discussed are shown below: Meeting Core agenda items Members eligible to attend Attended May 2015 – Determine base pay of executive directors and executive committee members for the year commencing 1 April 2015. – Consider and approve short-term incentive payments for the year ended 31 March 2015. – Consider and approve long-term incentive awards vesting in respect of the performance periods ended 31 March 2015. – Determine short-term incentive and long-term incentive performance measures and targets, and consider total remuneration for various performance outcomes for awards to be made during the year commencing 1 April 2015. – Approve long-term incentive awards to be granted in 2015. Lesley Knox (chairman) Mark Armour Guy Elliott John Manzoni July 2015 – Determine remuneration for the Chief Financial Officer. Lesley Knox (chairman) Mark Armour Guy Elliott Javier Ferrán October 2015 – Consider impact on remuneration plans upon a change of control. Lesley Knox (chairman) Mark Armour Guy Elliott Javier Ferrán November 2015 – Approve (off-cycle) long-term incentive awards to selected employees joining or promoted during the year. – Confirm treatment of remuneration plans upon a change of control. Lesley Knox (chairman) Mark Armour Guy Elliott Javier Ferrán March 2016 – Monitor and assess the progress towards performance goals. Lesley Knox (chairman) Mark Armour Guy Elliott Javier Ferrán May 2016 – Determine base pay of executive directors and executive committee members for the year commencing 1 April 2016. – Consider and approve short-term incentive payments for the year ended 31 March 2016. – Consider and approve long-term incentive awards vesting in respect of the performance periods ended 31 March 2016. – Determine short-term incentive and long-term incentive performance measures and targets, and consider total remuneration for various performance outcomes for awards to be made during the year commencing 1 April 2016. – Approve long-term incentive awards to be granted in 2016. Lesley Knox (chairman) Mark Armour Guy Elliott Javier Ferrán During the year, John Manser, Jan du Plessis, Alejandro Santo Domingo, Howard Willard, and Dave Beran attended some committee meetings as observers. Also present, at the invitation of the committee, were Alan Clark (Chief Executive), Stephen Shapiro (Group Company Secretary), John Davidson (General Counsel), Johann Nel (Group Human Resources Director), and Roger Fairhead (Group Compensation & Benefits Director), although none was present when their own remuneration was discussed. Advisers to the remuneration committee External advisers Kepler Associates is appointed by the committee, following a competitive tender, to provide independent advice on remuneration matters including current market practices, incentive design, performance measures, and independent monitoring of TSR. During the year Kepler Associates became a brand of Mercer. Both Kepler Associates and Mercer are founding members and signatories of the Code of Conduct for Remuneration Consultants. The committee reviews the advice provided by Kepler Associates to satisfy itself that it is independent. Kepler Associates does not provide any other advice to the group, and fees are charged on a time basis. Total fees for support to the committee during the year ended 31 March 2016 were £102,150. Market data is sourced by the group compensation & benefits function from a number of consultancies, including Towers Watson, Mercer and Hay Group to provide context for the committee. Other than Kepler Associates, the provision of information to the committee by other providers is incidental to their main function of advising the group compensation & benefits function on the remuneration of employees outside the scope of this report. Internal advisers The committee considers the views of the Chairman and the Chief Executive on the remuneration and performance of other members of the executive committee. The Group Company Secretary, the General Counsel, the Group Human Resources Director, and the Group Compensation & Benefits Director also provide information and advice to the committee on legal, regulatory and governance issues, and on the pay and conditions for employees throughout the group. 80 SABMiller plc Annual Report 2016
  • 85.
    Executive directors’ emolumentsfor the year ended 31 March 2016 (audited) £’000 Base pay Retirement benefits2 Other benefits3 Total fixed pay Annual bonus (see page 83) Long-term incentives (including the effect of share price growth)4 (see page 85) Total 2016 2015 2016 2015 2016 2015 2016 2015 2016 2015 2016 2015 2016 2015 Alan Clark 1,167 1,133 350 340 243 59 1,760 1,532 1,709 1,098 2,404 4,442 5,873 7,072 Domenic De Lorenzo1 471 – 140 – 19 – 630 – 462 – 992 – 2,084 – 1 Domenic De Lorenzo was appointed a director on 23 July 2015 and this table shows his remuneration from that date. 2 Retirement benefits consist solely of contributions to defined contribution arrangements. None of the directors have entitlements to defined benefit pensions in respect of their services as a director. 3 Other benefits include car allowance, family medical and dental insurance, long-term disability insurance, life insurance, accompanied travel, occasional overnight accommodation, legal and professional fees, and a beer allowance. Alan Clark also received a long-service award during the year of £145,875 (11 /2 months’ base pay) in recognition of 25 years’ service in accordance with the group’s policy for all UK employees. 4 The value of long-term incentives vesting in respect of performance periods ended in the year to 31 March 2016 includes those granted to executive directors in respect of their prior service as employees, rather than only those granted as, or in contemplation of their appointment as, executive directors. The charts below show the remuneration opportunity for the year ended 31 March 2016 (using the same assumptions as the remuneration scenario charts included in the remuneration policy approved by shareholders in 2014), with actual remuneration being shown with and without the effect of share price growth over the performance periods. In the five years ended 31 March 2016, SABMiller’s share price increased by 92%. Alan Clark £m Domenic De Lorenzo £m 2016 (including share price growth) 2016 (excluding share price growth) Opportunity Min On-target Max £0 £5 £10 £15 2016 (including share price growth) 2016 (excluding share price growth) Opportunity Min MaxOn-target £0 £1 £2 £3 £4 £5 GOVERNANCEGOVERNANCE 81SABMiller plc Annual Report 2016
  • 86.
    GOVERNANCE |Directors’ remunerationreport continued Annual report on remuneration continued Non-executive directors’ emoluments for the year ended 31 March 2016 (audited) £’000 Fees Benefits5 Total 2016 2015 2016 2015 2016 2015 Mark Armour 135 125 – – 135 125 Dave Beran (appointed 23 July 2015) 59 n/a – n/a 59 n/a Geoffrey Bible 97 92 – – 97 92 Dinyar Devitre 105 100 – – 105 100 Jan du Plessis1 476 47 – – 476 47 Guy Elliott 150 145 – – 150 145 Javier Ferrán (appointed 23 July 2015)2 67 n/a – n/a 67 n/a Lesley Knox 133 128 – – 133 128 John Manser (retired 23 July 2015) 203 650 – – 203 650 Trevor Manuel 91 7 – – 91 7 John Manzoni (retired 23 July 2015)3 – 62 – – – 62 Miles Morland (retired 24 July 2014) n/a 32 n/a – n/a 32 Dambisa Moyo 110 105 – – 110 105 Carlos Pérez Dávila 85 80 – – 85 80 Alejandro Santo Domingo Dávila 85 80 – – 85 80 Helen Weir 117 112 – – 117 112 Howard Willard (retired 23 July 2015)4 – – – – – – 1 Jan du Plessis was appointed to the board on 1 September 2014 and appointed Chairman on 23 July 2015. Under the terms of his appointment, his annual fee is £650,000 and his appointment may be terminated with 12 months’ notice. In his capacity as chairman of Rio Tinto plc, he is provided with a car and driver, and on occasions he uses this car and driver for SABMiller business. SABMiller reimburses Rio Tinto plc in respect of the travel costs incurred, but no amount payable by SABMiller relates to any personal use. For the year ended 31 March 2016, the amount paid to Rio Tinto plc was £45,600 inclusive of VAT. 2 Javier Ferrán will step down from the board at the annual general meeting on 21 July 2016. 3 John Manzoni announced his intention to step down as a director following the 2015 annual general meeting, and declined to accept his non-executive director’s fee from the date of this announcement on 30 October 2014. 4 Howard Willard is an executive officer of Altria Group, Inc (Altria), and in line with the company’s agreement with Altria, he did not receive a director’s fee from the company. 5 Non-executive directors do not participate in any of the company’s incentive plans, nor do they receive retirement or other benefits, other than a beer allowance (the value of which was considerably less than £1,000 for the year ended 31 March 2016). Base pay and non-executive directors’ fees Executive directors’ base pay, and non-executive directors’ fees, for the year ended 31 March 2016 and those for the year ending 31 March 2017 (annualised for ease of comparison), are as follows. Annualised Year ended 31 March 2016 £ Year ending 31 March 20171 £ % change Executive directors Chief Executive 1,167,000 1,200,000 2.8% Chief Financial Officer 680,000 715,000 5.1% Non-executive directors Non-executive Chairman’s fee (inclusive of all committee fees) 650,000 650,000 – Base fee 85,000 85,000 – Senior Independent Director (additional fee) 30,000 30,000 – Committee chairman fee (inclusive) – Audit 35,000 35,000 – – Remuneration 28,000 28,000 – – Nomination 25,000 25,000 – – CARAC 25,000 25,000 – Committee member fee – Audit 20,000 20,000 – – Remuneration 15,000 15,000 – – Nomination – – – – CARAC 12,000 12,000 – 1 At its meeting on 17 May 2016 the board considered the level of non-executive directors’ fees and resolved not to increase them for the year ending 31 March 2017. 82 SABMiller plc Annual Report 2016
  • 87.
    Annual bonus Outcome forthe year ended 31 March 2016 (audited) For the year ended 31 March 2016, the total bonus opportunity for executive directors was split: – 60% annual financial performance; and – 40% individual strategic objectives. The performance measures and achievement against each target for the year ended 31 March 2016 are shown in the table below. The actual financial targets and detailed strategic objectives of the executive directors for the year ended 31 March 2016 have not been disclosed as they remain commercially confidential. The board will review this position, and if the risk is no longer considered material, retrospective disclosure of the financial targets and strategic objectives may be made if appropriate. Retrospective disclosure of results and targets for the year ended 31 March 2014 is shown on page 84, as the commercial risk of this level of disclosure is no longer considered material. Performance measure Weighting Achievement Outcome Alan Clark Domenic De Lorenzo Financial performance targets: – Group net producer revenue growth 20% 33% 6.7% 6.7% – Group EBITA growth 20% 100% 20% 20% – Adjusted EPS growth 20% 100% 20% 20% 60% 46.7% 46.7% + + + Individual strategic objectives: – Alan Clark 40% 92.5% 37.0% – Domenic De Lorenzo 88% 35.2% = = = Total (% of maximum bonus opportunity) 100% 83.7% 81.9% x x Maximum bonus opportunity (% of base pay) 175% 120% x x Base pay during the year £1,167,000 £470,580 = = Annual bonus £1,709,000 £462,000 Alan Clark’s strategic objectives included his leadership of global initiatives on costs and category optimisation, for which achievement during the year ended 31 March 2016 was rated as 92.5% of maximum. Domenic De Lorenzo’s strategic objectives included efficiency savings and risk management, for which achievement during the year ended 31 March 2016 was rated as 88% of maximum. GOVERNANCEGOVERNANCE 83SABMiller plc Annual Report 2016
  • 88.
    GOVERNANCE |Directors’ remunerationreport continued Annual report on remuneration continued Retrospective disclosure of annual bonus targets for the year ended 31 March 2014 Performance measure Weighting Threshold (25%) Target (50%) Maximum (100%) Result Outcome Alan Clark Jamie Wilson Financial performance targets:1 – Group net producer revenue growth (%) 15% 6.5 9.9 13.4 4.3 (0%) nil nil – Group EBITA margin growth (bps) 15% – 10 50 61 (100%) 15% 15% – Adjusted EPS growth (%) 15% 5.2 10.1 16.1 9.0 (45%) 7% 7% – Group free cash flow (US$m) 15% 2,832 3,146 3,461 3,202 (59%) 9% 9% 60% 31% 31% + + + Individual strategic objectives: Alan Clark 40% 32% – Category strategy developed and implemented 90% – End-to-end supply chain established and cost savings delivered 70% Jamie Wilson – Global Business Services established to plan (time and cost) 75% 30% – Tsogo Sun exit achieved and managed to timetable 75% = = = Total (% of maximum bonus opportunity) 100% 63% 61% x x Maximum bonus opportunity (% of base pay) 175% 120% x x Base pay during the year £1,085,000 £740,000 = = Annual bonus £1,196,300 £541,700 1 Targets and outcomes are shown using budgeted exchange rates for the relevant performance period with adjustments for unbudgeted acquisition and disposal activities during the year to enable like-for-like comparison. Performance measures for the year commencing 1 April 2016 The performance measures and weightings that will determine the total bonus opportunity for the year commencing 1 April 2016 are: Performance measure Weighting Financial performance targets: – Group net producer revenue growth 25% – Group EBITA growth 25% – Net working capital 10% 60% – Individual strategic objectives 40% 100% If there is a change of control during the year ending 31 March 2017, any bonus amounts payable to executive directors shall be determined by reference to achievement of the above financial performance targets and individual strategic objectives, with annual bonus payments pro-rated for the period to change of control. 84 SABMiller plc Annual Report 2016
  • 89.
    Share option plan Outcomefor the year ended 31 March 2016 (audited) Share options provide a direct and transparent link between executive pay and value creation for shareholders, as no gains are possible unless there has been an absolute increase in the share price. Furthermore, to ensure that any share price increase is supported by a sustainable improvement in the group’s underlying financial performance, additional performance conditions are applied before vesting of: – two-thirds of the share options after three years; and – one-third of the share options after five years. If these performance conditions are not met, the appropriate proportion of share options will lapse, and there is no opportunity for retesting. The vesting of share options for the executive directors for the performance periods ended 31 March 2016 is shown in the table below, which includes share options granted in respect of their services as employees rather than as, or in contemplation of their appointment as, executive directors. Share options vesting shortly after the year end with performance periods ended 31 March 2016 have lapsed with a nil payout because the required performance threshold was not achieved. Performance conditions/period Performance Vesting Outcome Alan Clark Domenic De Lorenzo Compound annualised adjusted EPS growth, expressed in sterling, of UK RPI plus a fixed percentage compounded Threshold vesting: UK RPI + 3% pa Maximum vesting: UK RPI + 5% pa Performance achieved: Five years ended 31 March 2016 UK RPI + 1.6% pa nil nil – Performance achieved: Three years ended 31 March 2016 UK RPI - 2.0% pa nil nil nil Total number of share options vesting nil nil Value at vesting nil nil Share award plan Outcome for the year ended 31 March 2016 (audited) Share awards comprise performance shares and value shares to incentivise and reward executives for achieving: – long-term financial performance (adjusted EPS growth over three years) through the vesting of performance shares; and – long-term external relative performance (TSR outperformance of the median of a comparator group over three, four and five years) through the vesting of value shares. The number of shares which can be released under a value share award is dependent upon TSR outperformance compared with a comparator group (identified on page 86) so that: – at median or below median TSR performance, no shares will vest; but – for every £10 million of additional shareholder value created above the median, a pre-determined fixed number of shares will vest. The table below shows the vesting of the performance shares and value shares for the year ended 31 March 2016. Performance shares vesting shortly after the year end with performance periods ended 31 March 2016 have lapsed with a nil payout because the required performance threshold was not achieved. Performance conditions/period Performance Vesting/ multiplier Outcome Alan Clark Domenic De Lorenzo Compound growth in adjusted EPS Threshold vesting: 6% pa Maximum vesting: 11% pa Performance achieved: Three years ended 31 March 2016 -1.9% pa nil nil nil TSR outperformance achieved: Five years ended 31 March 20161 12.905% outperformance x £33,485m capitalisation = £4,321m additional value £4,321m/£10m = 432.1 432.1 x 115 = 49,691 shares 432.1 x 50 = 21,605 shares TSR outperformance achieved: Three years ended 31 March 20162 3.330% outperformance x £47,580m capitalisation = £1,584m additional value £1,584m/£10m = 158.4 158.4 x 41 = 6,494 shares 158.4 x 10 = 1,584 shares Total number of share vesting 56,185 23,189 Value at vesting (including share price growth) £2,404,312 £991,859 Value at vesting (excluding share price growth)3 £1,334,049 £536,699 1 Vested 31 May 2016, share price = £42.744. 2 Vested 3 June 2016, share price = £43.166. 3 Share price at award dates are shown on page 91. GOVERNANCEGOVERNANCE 85SABMiller plc Annual Report 2016
  • 90.
    GOVERNANCE |Directors’ remunerationreport continued Annual report on remuneration continued Performance conditions for share awards granted in the year commencing 1 April 2016 (audited) The performance condition and performance target for performance share awards granted in the year commencing 1 April 2016 are: Performance conditions Performance targets Compound growth in adjusted EPS – in constant currency Proportion of performance shares vesting Threshold vesting: 6% pa 25% of maximum Maximum vesting: 11% pa 100% of maximum The performance condition for value share awards remains TSR outperformance of the median of a comparator group. The comparator group was changed for performance periods commencing from 2014 to include other companies in the wider consumer goods categories considered to be more relevant comparators than some of the smaller scale, regional, beer, and alcoholic beverage companies in the previous comparator group. Weighting of comparator group constituents for awards granted: 2010 to 2013 from 2014 Anheuser-Busch InBev 21% 20% Heineken 21% 20% Molson Coors Brewing Co 11% – Carlsberg 11% 10% Diageo 11% 10% Pernod-Ricard 5% 10% Kirin Holdings 5% 10% Asahi Breweries 5% – Constellation Brands 5% – Sapporo Holdings 5% – The Coca-Cola Company – 5% Nestlé – 5% Unilever – 5% Mondelez – 5% 100% 100% Details of executive directors’ performance shares and value shares awarded during the year ended 31 March 2016 are shown on page 89, and those outstanding at 31 March 2016, are shown on page 91. 86 SABMiller plc Annual Report 2016
  • 91.
    Total shareholdings ofdirectors (audited) The total shareholdings and shareholding requirements at 31 March 2016 are shown in the table below. Shares held1 Options held (see table on page 90) Executive director Shares owned outright (see table below) Shares subject to performance conditions (see table on page 91) Subject to deferral Owned outright (vested and exercisable) Subject to performance conditions Shares owned outright as % of annualised base pay at 31 March 2016 @ £42.562 Shareholding requirement (shares owned outright as % of annualised base pay)2 Alan Clark3 311,608 219,061 – 636,851 525,570 1,136% 300% Domenic De Lorenzo4 126,355 59,065 – – 146,838 791% 200% 1 The numbers of shares shown in the table above include those held by connected persons. 2 Shares owned outright and shareholding requirement excludes any shares or share options that remain subject to performance conditions or deferral. 3 As a result of shares retained from awards vested in respect of the year ended 31 March 2016, but not received until after the year end, Alan Clark owned 341,886 shares outright at 10 June 2016, equivalent to 1,247% of base pay. 4 As a result of shares retained from awards vested in respect of the year ended 31 March 2016, but not received until after the year end, Domenic De Lorenzo owned 149,544 shares outright at 10 June 2016, equivalent to 936% of base pay. The company maintains a periodically updated table on its website, showing the shareholdings of the directors in accordance with the recommendation made by the GC100 and Investor Group. Directors’ interests in shares of the company (audited) Director Ordinary shares held at 31 March 2015 (or date of appointment if later)7 Ordinary shares acquired during the period Ordinary shares disposed of during the period Ordinary shares held as at 31 March 2016 (or date of ceasing to be a director if earlier)8 Alan Clark1,2 298,764 215,034 (202,190) 311,608 Domenic De Lorenzo3 126,355 – – 126,355 Mark Armour 3,000 – – 3,000 Dave Beran – – – – Geoffrey Bible 92,750 – – 92,750 Dinyar Devitre4 31,125 – (1,125) 30,000 Jan du Plessis 30,000 – – 30,000 Guy Elliott5 2,000 1,114 – 3,114 Javier Ferrán – – – – Lesley Knox 3,000 – – 3,000 John Manser 8,000 – – 8,000 Trevor Manuel – – – – John Manzoni 8,252 – – 8,252 Dambisa Moyo 386 – – 386 Carlos Pérez Dávila – – – – Alejandro Santo Domingo Dávila – – – – Helen Weir6 304 2 – 306 Howard Willard – – – – 1 Alan Clark had awards vested and exercised options in respect of 215,034 shares during the year ended 31 March 2016, selling 102,190 shares to pay the subscription price and to settle the resulting tax and social security charges, and retaining the balance of shares beneficially. Alan Clark disposed of 10,000 shares on 14 September 2015 by way of gifts, and The Clark Family Trust, a connected person with Alan Clark, disposed of 90,000 shares on 4 March 2016 at a price of £42.06 per share. 2 On 31 May 2016 and 3 June 2016, Alan Clark’s beneficial holding increased by a total of 30,278 shares following the release to him of 56,185 shares as the result of the vesting of his 2011 and 2013 value share awards (as shown on page 85), with 25,907 shares sold to pay the resulting tax liability, retaining the balance of shares beneficially. 3 On 31 May and 3 June 2016, Domenic De Lorenzo’s beneficial holding increased by a total of 23,189 shares following the release to him of 23,189 shares as the result of the vesting of his 2011 and 2013 value share awards (as shown on page 85), with the resulting tax liability paid directly by him without the sale of shares. 4 Dinyar Devitre disposed of 1,125 shares on 26 May 2015 at a price of £35.717 per share. 5 Guy Elliott acquired 219 and 895 shares on 31 July 2015 at prices of £33.486 and £33.565 per share respectively. 6 Helen Weir acquired 2 shares on 11 September 2015 at a price of £29.708 per share as part of a dividend reinvestment plan. 7 Domenic De Lorenzo was appointed a director on 23 July 2015, and his interest in shares is shown at that date. 8 John Manser, John Manzoni, and Howard Willard retired as non-executive directors on 23 July 2015, and their interest in shares is shown at that date. 9. The number of shares shown in the table above include those held by connected persons. During the year ended 31 March 2016 the highest and lowest market prices for the company’s shares were £42.65 and £27.73 respectively, and the closing market price on 31 March 2016 was £42.56. GOVERNANCEGOVERNANCE 87SABMiller plc Annual Report 2016
  • 92.
    GOVERNANCE |Directors’ remunerationreport continued Annual report on remuneration continued Performance review In accordance with the regulations, the company is required to include a line graph showing the company’s TSR performance compared with an appropriate broad equity market index for the preceding seven years. The chart compares the company’s TSR with the FTSE 100 Total Return Index over the period from 1 April 2009 to 31 March 2016, assuming an initial investment of £100. The company is a constituent of the FTSE 100 Total Return Index and, accordingly, this is considered to be an appropriate comparison to demonstrate the company’s relative performance. Chief Executive remuneration table Year 2010 2011 2012 2013 2014 2015 2016 Incumbent Graham Mackay Graham Mackay Graham Mackay Graham Mackay Alan Clark Alan Clark Alan Clark Total remuneration ‘single figure’ (£’000) 8,515 12,713 13,728 13,910 6,463 7,072 5,873 Annual variable pay (as a % of maximum) 79% 85% 77% 62% 63% 55% 84% LTI vesting (as a % of maximum) 100% 98% 100% 100% 87% 37% 23% Percentage change in remuneration for the Chief Executive compared with other employees The table below shows the percentage change in remuneration for the Chief Executive from the prior year, compared with a comparator group of other employees of the SABMiller group based in the UK over the same time period. Given the global nature of SABMiller’s operations and the diverse pay markets in which our employees operate, the UK employees were deemed to provide the most appropriate comparator to the Chief Executive, who is also UK-based. Salary and fees (annualised) Taxable benefits Annual cash bonus Chief Executive (% change) +3.0% +312% +56% UK employees (% change) +3.0% +21% +32% Alan Clark’s taxable benefits increased for the year ended 31 March 2016, mostly due to the payment of a long service award during the year and an increase in insurance premiums. The value of taxable benefits for UK employees increased by 21% as a result of an increase in medical insurance premiums, which had otherwise remained fixed for the prior two years. Payments to past directors (audited) There were no payments to past directors, termination payments or payments for loss of office in respect of the year. Relative importance of expenditure on pay The table below sets out the remuneration paid to or receivable by all employees, in the years ended 31 March 2016 and 31 March 2015 compared with the distributions to shareholders. The variation in total employee pay is a function of the number of employees and the percentage changes in their remuneration in the countries in which they are employed, and the depreciation of key currencies against the US dollar during the year. 2016 US$m 2015 US$m % change Total employee pay 2,235 2,491 (10)% Dividends to shareholders 1,860 1,705 9% Note: Spot prices 1 Apr 2009 31 Mar 2012 31 Mar 2011 31 Mar 2010 31 Mar 2013 31 Mar 2014 31 Mar 2015 31 Mar 2016 0 100 200 300 400 500 Seven-year cumulative TSR performance Value of £100 invested 1 April 2009 SABMiller FTSE 100 88 SABMiller plc Annual Report 2016
  • 93.
    Scheme interests awardedduring the year (audited) On 1 June 2015, the following share options were granted and share awards conditionally allocated to executive directors, subject to the achievement of the relevant performance conditions as disclosed on pages 90 to 91. Executive director Award type Number of share options/ conditional shares Face value of share options and shares1 Face value of share options and shares as percentage of annualised base pay Percentage achievable if minimum performance is achieved Latest performance period ending Alan Clark Share options 98,169 £3,430,025 294% 25% at threshold 31 Mar 2018 Share options 49,084 £1,714,995 147% 25% at threshold 31 Mar 2020 Performance shares 73,627 £2,572,527 220% 25% at threshold 31 Mar 2018 Value shares 125 £4,367 per £10m of additional shareholder value Nil at median or below 31 Mar 2020 Domenic De Lorenzo Share options 49,958 £1,745,533 257% 25% at threshold 31 Mar 2018 Share options 9,991 £349,086 51% 25% at threshold 31 Mar 2020 Performance shares 29,975 £1,047,327 154% 25% at threshold 31 Mar 2018 Value shares 60 £2,096 per £10m of additional shareholder value Nil at median or below 31 Mar 2020 1 The face value of share options and performance shares has been calculated by multiplying the maximum number of shares under option and the maximum number of shares possible to vest by the share price on the date of grant, being £34.94 on 1 June 2015. Statement of shareholder voting The table below sets out the result of the vote on the directors’ remuneration policy at the 2014 annual general meeting, and the vote on the annual report on remuneration at the 2015 annual general meeting. Votes for Votes against Votes withheld Remuneration policy 1,111,025,026 92,388,744 178,551,996 92.32% 7.68% Annual report on remuneration 1,262,211,914 83,528,932 6,529,077 93.79% 6.21% 0% 25% 50% 75% 100% 92.32% 93.79% GOVERNANCEGOVERNANCE 89SABMiller plc Annual Report 2016
  • 94.
    Annual report onremuneration continued GOVERNANCE |Directors’ remuneration report continued Share options (audited) Director Exercisable for 3-10 years from Performance period (year ending 31 March) Subscription price £ Outstanding as at 31 March 2015 Granted during the year Exercised during the year Lapsed during the year Outstanding as at 31 March 2016 Vested and exercisable as at 31 March 2016 Sale price/ market price £ Alan Clark1 19 May 2006 Vested 10.61 100,000 – (100,000) – – – 42.51 18 May 2007 Vested 11.67 100,000 – – – 100,000 100,000 16 May 2008 Vested 12.50 100,000 – – – 100,000 100,000 1 Aug 2008 Vested 10.49 50,000 – – – 50,000 50,000 15 May 2009 Vested 12.31 125,250 – – – 125,250 125,250 15 May 2009 Vested 12.31 24,750 – – – 24,750 24,750 1 Jun 2010 Vested 19.51 108,550 – – – 108,550 108,550 1 Jun 2010 Vested 19.51 21,450 – – – 21,450 21,450 1 Jun 2011 Vested 22.495 65,000 – – – 65,000 65,000 1 Jun 2011 Vested 22.495 41,851 – – – 41,851 41,851 1 Jun 2011 5 years (2016) 22.495 21,450 – – – 21,4503 – 1 Jun 2012 Lapsed 23.95 134,000 – – (134,000) – – 1 Jun 2012 5 years (2017) 23.95 66,000 – – – 66,000 – 3 Jun 2013 3 years (2016) 33.30 93,800 – – – 93,8003 – 3 Jun 2013 5 years (2018) 33.30 46,200 – – – 46,200 – 2 Jun 2014 3 years (2017) 33.11 101,081 – – – 101,081 – 2 Jun 2014 5 years (2019) 33.11 49,786 – – – 49,786 – 1 Jun 2015 3 years (2018) 34.94 – 98,169 – – 98,169 – 1 Jun 2015 5 years (2020) 34.94 – 49,084 – – 49,084 – 1,249,168 147,253 (100,000) (134,000) 1,162,421 636,851 Domenic De Lorenzo 1 Dec 2011 5 years (2016) 22.40 12,210 – – – 12,210 – 1 Jun 2012 5 years (2017) 23.95 16,500 – – – 16,500 – 3 Jun 2013 3 years (2016) 33.30 18,760 – – – 18,7603 – 3 Jun 2013 5 years (2018) 33.30 9,240 – – – 9,240 – 2 Jun 2014 3 years (2017) 33.11 15,090 – – – 15,090 – 2 Jun 2014 3 years (2017) 33.11 10,110 – – – 10,110 – 2 Jun 2014 5 years (2019) 33.11 4,979 – – – 4,979 – 1 Jun 2015 3 years (2018) 34.94 – 49,958 – – 49,958 – 1 Jun 2015 5 years (2020) 34.94 – 9,991 – – 9,991 – 86,889 59,949 – – 146,838 – 1 On 29 March 2016 Alan Clark exercised an option to purchase 100,000 shares at an option price of £10.61 per share. 51,352 shares were sold at a price of £42.51 per share with the proceeds being used to cover the subscription price and to meet applicable income tax and social security charges. The balance of the shares were retained by him beneficially. 2 On 31 May 2016 Alan Clark and Domenic De Lorenzo were granted an option over a maximum of 123,285 shares and 66,779 shares respectively at an exercise price of £42.8275 per share, subject to the performance conditions listed below. If there is a change of control during the year ending 31 March 2017, the number of shares vesting on a change of control will be pro-rated. 3 Share options vesting in June 2016 with performance periods ended 31 March 2016 have lapsed with a nil payout because the required performance threshold was not achieved, as shown on page 85. Share options granted to executive directors before 2014 have a performance condition that requires compound annualised adjusted EPS growth, expressed in sterling, of: – UK RPI + 3% per annum for any of the share options to vest; and – UK RPI + 5% per annum for full vesting. Share options granted to executive directors from 2014 have a performance condition that requires compound growth in adjusted EPS in constant currency of: – 6% per annum for any of the share options to vest; and – 11% per annum for full vesting. 90 SABMiller plc Annual Report 2016
  • 95.
    Performance shares (audited) DirectorAward date Performance period (year ending 31 March) Share price at award date £ Outstanding as at 31 March 2015 Awarded during the year Released during the year Lapsed during the year Outstanding as at 31 March 2016 Share price/ market price £ Alan Clark2 1 Jun 2012 Lapsed 23.95 100,000 – – (100,000) – 3 Jun 2013 3 years (2016) 33.30 70,0001 – – – 70,000 2 Jun 2014 3 years (2017) 33.11 75,434 – – – 75,434 1 Jun 2015 3 years (2018) 34.94 – 73,627 – – 73,627 245,434 73,627 – (100,000) 219,061 Domenic De Lorenzo2 3 Jun 2013 3 years (2016) 33.30 14,0001 – – – 14,000 2 Jun 2014 3 years (2017) 33.11 15,090 – – – 15,090 1 Jun 2015 3 years (2018) 34.94 – 29,975 – – 29,975 29,090 29,975 – – 59,065 1 Performance shares vesting in June 2016 with a performance period ended 31 March 2016 have lapsed with a nil payout because the required performance threshold was not achieved, as shown on page 85. 2 On 31 May 2016 Alan Clark and Domenic De Lorenzo were each granted a performance share award over a maximum of 61,643 shares and 33,389 shares respectively, subject to the performance conditions listed below. If there is a change of control during the year ending 31 March 2017, the number of shares vesting on a change of control will be pro-rated. For performance share awards granted from 2011 onwards, the performance condition is compound growth in adjusted EPS (from 2014 onwards, in constant currency) of: – 6% per annum for any performance shares to vest; and – 11% per annum for full vesting. Value shares (audited) Director Award date Share price at award date £ Outstanding as at 31 March 2015 (shares per £10m of additional shareholder value) Awarded during the year (shares per £10m of additional value) Released during the year (shares per £10m of additional value) Lapsed during the year (shares per £10m of additional value) Outstanding as at 31 March 2016 (shares per £10m of additional value) Earliest possible release date Final vesting date Share price/ market price £ Alan Clark 1 Jun 2010 19.51 115 – (115) – – 1 Jun 2013 1 Jun 2015 35.74 1 Jun 2011 22.495 115 – – – 115 1 Jun 2014 1 Jun 2016 1 Jun 2012 23.95 175 – – – 175 1 Jun 2015 1 Jun 2017 3 Jun 2013 33.30 125 – – – 125 3 Jun 2016 3 Jun 2018 2 Jun 2014 33.11 125 – – – 125 2 Jun 2017 2 Jun 2019 1 Jun 2015 34.94 – 125 – – 125 1 Jun 2018 1 Jun 2020 655 125 (115) – 665 Domenic De Lorenzo 1 Dec 2011 22.40 50 – – – 50 1 Dec 2014 1 Jun 2016 1 Jun 2012 23.95 50 – – – 50 1 Jun 2015 1 Jun 2017 3 Jun 2013 33.30 30 – – – 30 3 Jun 2016 3 Jun 2018 2 Jun 2014 33.11 30 – – – 30 2 Jun 2017 2 Jun 2019 1 Jun 2015 34.94 – 60 – – 60 1 Jun 2018 1 Jun 2020 160 60 – – 220 On 31 May 2016 Alan Clark and Domenic De Lorenzo were conditionally awarded 125 value shares and 100 value shares respectively, of which one-third are capable of vesting for every £10 million of additional shareholder value created over three, four and five-year performance periods commencing 1 April 2016. If there is a change of control during the year ending 31 March 2017, TSR outperformance of the median of a comparator group will be measured through to change of control, and any shares vesting on a change of control will be pro-rated. The number of shares which can be released under a value share award is dependent upon TSR outperformance compared with the median of a comparator group (identified on page 86) over three, four and five-year performance periods: – at median or below median TSR performance, no shares will vest; and – for every £10 million of additional shareholder value created, a predetermined fixed number of shares will vest (as set out in the table above). GOVERNANCEGOVERNANCE 91SABMiller plc Annual Report 2016
  • 96.
    Annual report onremuneration continued GOVERNANCE |Directors’ remuneration report continued Additional shareholder value represents the amount of additional return to shareholders as a result of the company’s TSR performance exceeding the median of the comparator group. It is calculated as the percentage change in TSR of the company, less the percentage change in TSR of the median of the comparator group, multiplied by the company’s market capitalisation at the commencement of the performance period. The maximum number of shares that can vest is capped at the level at which additional shareholder value at the end of each performance period equals the market capitalisation of the company at the commencement of the performance period. The maximum value for all participants (including executive directors) in the aggregate is therefore capped at 0.5% of additional shareholder value created for any five-year performance period. This is the maximum theoretical percentage that can be earned in aggregate by all participants, with 99.5% of the additional value created accruing to shareholders. Value share awards granted before 2013 vest on the fifth anniversary of the grant date, subject to TSR outperformance, but participants may request the release of all or part of the award from the third anniversary of the grant date. If the committee exercises its discretion to release shares in such circumstances, the number of shares is determined based on TSR outperformance to that date, with the shares partially deferred and released in equal instalments over the period until the fifth anniversary of the grant date. There is no opportunity for retesting against future TSR performance, and the deferred shares are subject to forfeiture under certain circumstances should the participant’s employment terminate before the fifth anniversary. Value share awards granted from 2013 vest one-third on each of the third, fourth and fifth anniversaries of the grant date respectively. Any shares are then released, based on TSR outperformance to the preceding 31 March. If the performance conditions for any award are not achieved at the relevant date, the appropriate proportion of shares will lapse and there is no opportunity for retesting. At 31 March 2016, TSR outperformance, additional shareholder value created, and the indicative value of shares capable of vesting for the highest paid executive (Alan Clark) were: Performance period commencing 1 April 2011 1 April 2012 1 April 2013 1 April 2014 1 April 2015 SABMiller’s TSR to 31 March 2016 114.963% 87.503% 46.071% 40.837% 19.701% Comparator group median TSR to 31 March 2016 102.058% 103.698% 42.741% 30.258% 11.254% Outperformance 12.905% nil 3.330% 10.579% 8.447% SABMiller market capitalisation (at commencement of the performance period) £33,485m £37,639m £47,580m £48,459m £56,264m Additional shareholder value created £4,321m nil £1,584m £5,126m £4,753m Value of shares capable of vesting (at £42.56 per share) £2.1m nil £0.8m £2.7m £2.5m Value of shares as % of additional shareholder value created 0.05% – 0.05% 0.05% 0.05% Approval This report complies with the requirements of the regulations. Those parts of the report that are subject to audit are identified separately. This report and the recommendations of the committee were approved by the board on 10 June 2016 as recommended by the committee on 16 May 2016 and will be submitted to shareholders for approval at the 2016 annual general meeting. Signed on behalf of the board of directors by Stephen Shapiro Group Company Secretary 10 June 2016 92 SABMiller plc Annual Report 2016
  • 97.
    Directors’ report The directorshave pleasure in submitting their report to shareholders, together with the audited annual financial statements for the year ended 31 March 2016. Much of the information previously provided as part of the directors’ report is required to be presented as part of the strategic report, which includes a description of the principal risks and uncertainties we face, our development and performance during the year, our position at the end of the year, key performance indicators, and information relating to environmental matters, employee matters and social, community, and human rights issues. The directors’ report includes information required under the Companies Act 2006, the Listing Rules, and the Disclosure and Transparency Rules. For the purposes of compliance with the Disclosure and Transparency Rules, the strategic report and this directors’ report, including those sections of the annual report incorporated by reference, constitute a management report. Directors The names and biographical details of the current directors are set out on pages 54 and 55. All the current directors served throughout the period, except Dave Beran and Javier Ferrán who were elected as directors at the annual general meeting on 23 July 2015, and Domenic De Lorenzo, who was appointed as a director immediately after the annual general meeting. John Manser, John Manzoni and Howard Willard served as directors until their retirement on 23 July 2015. Javier Ferrán will retire from the conclusion of the 2016 annual general meeting. Details of the interests in shares and options of the directors who held office during the year and any persons connected to them are set out in the directors’ remuneration report on pages 74 to 92. Corporate governance The directors’ approach to corporate governance and statements of our application of the UK Corporate Governance Code are set out in the corporate governance report, which forms part of this directors’ report, on pages 58 to 69, in the audit committee report on pages 70 to 73 and in the directors’ remuneration report on pages 74 to 92. Share capital Details of the issued share capital and movement in it during the year are provided in note 25 to the consolidated financial statements. During the year 3,190,462 ordinary shares were purchased by the trustee of the SABMiller Employees’ Benefit Trust (EBT) (at an average price of £30.89 per share) which amounted to 0.19% of the issued ordinary shares of the company, in order to ensure that the trustee of EBT continued to hold sufficient ordinary shares to meet expected future obligations in respect of performance share awards under the Share Award Plan. Annual general meeting Our 2016 annual general meeting will be held at the InterContinental London Park Lane, One Hamilton Place, London W1V 7QY, UK at 11.00am on Thursday 21 July 2016. Copies of the notice of this meeting may be obtained from our website. Dividends An interim dividend of 28.25 US cents per share was paid to shareholders on 4 December 2015 in respect of the year ended 31 March 2016. Details of the final dividend proposed by the board for the year ended 31 March 2016 are set out below: Amount of final dividend proposed by the board: – 93.75 US cents per share. Total proposed dividend for the year ended 31 March 2016: – 122 US cents per share. If approved, and the proposed acquisition of the company by a Belgian company formed for the purposes of the recommended transaction by AB InBev has not become effective prior to 12 August 2016, the final dividend will be payable to shareholders on either section of the register on 5 August 2016 in the following way: Dividend payable on: 12 August 2016. Currency of payment: – South African rands – to shareholders on the RSA section of the register; – US dollars – to shareholders shown as having an address in the USA and recorded on the UK section of the register (unless mandated otherwise); and – Pounds sterling – to all other shareholders on the UK section of the register. Ex-dividend dates: – 3 August 2016 for shares traded on the JSE Limited, South Africa. – 4 August 2016 for shares traded on the London Stock Exchange (LSE). The rate of exchange for conversion from US dollars will be calculated on 20 July 2016 and published on the RNS of the LSE and the SENS of the JSE Limited on 21 July 2015. Shareholders registered on the RSA section of the register will, unless a shareholder qualifies for an exemption, be subject to a dividend withholding tax at a rate of 15%. The dividend withholding tax is only of direct application to shareholders registered on the RSA section of the register, who should direct any questions about the application of the dividend withholding tax to Computershare Investor Services (Pty) Limited, tel: +27 11 373 0004. Note 9 to the consolidated financial statements discloses dividends waived. Purchase of own shares At the last annual general meeting, shareholder authority was obtained for us to purchase our own shares up to a maximum of 10% of the number of ordinary shares in issue as at 1 June 2015. This authority is due to expire at the earlier of the next annual general meeting or 23 October 2016, and remains exercisable provided that certain conditions relating to the purchase are met. The notice of annual general meeting proposes that shareholders approve a resolution updating and renewing the authority allowing us to purchase our own shares. We did not repurchase any shares during the year for the purpose of cancellation, holding in treasury, or for any other purpose. GOVERNANCEGOVERNANCE 93SABMiller plc Annual Report 2016
  • 98.
    Political donations It remainsour policy not to make donations to political organisations in the European Union. Other political donations are only made by exception, and where permitted by local laws, and must be consistent with the support of multi-party democracy. Our subsidiary in Mozambique made a donation totalling US$142,914 to Mozambique’s Ministry of Foreign Affairs, as a contribution to the costs of the 2015 Presidential inauguration ceremony. Employment, environmental and social policies Our aim is to be the employer of choice in each country in which our group companies operate. To achieve this, each operating company designs employment policies which attract, retain and motivate the highest quality of staff. We are committed to an active equal opportunities policy, from recruitment and selection, through training and development, appraisal and promotion to retirement. Within the constraints of local law, it is our policy to ensure that everyone is treated equally, regardless of gender, colour, nationality, ethnic origin, race, disability, marital status, sexual orientation, religion or trade union affiliation. We value the benefits of employing people of different races, genders, creeds and backgrounds. If employees become disabled, efforts are made to allow them to continue in their role, or a suitable alternative role, through making reasonable adjustments. Full consideration is given to applications for employment from disabled persons, having regard to their particular aptitudes and abilities. We are committed to regular communication and consultation with our employees and we encourage employee involvement in our performance. We have distribution of real time news through our intranet, which is available to businesses to help inform employees about what is happening in our global operations. Further information is provided to employees at regional and country level by way of a mix of channels such as newsletters, employees’ boards, meetings and electronic communication. Certain employees throughout the group are eligible to participate in the group’s share incentive plans. The sustainable development review on pages 48 to 51 gives an overview of the progress of the implementation of our sustainable development ambition, Prosper, and of the impact of our business on the environment. More detailed information is provided in our 2016 sustainable development report, available on our website. Research and development To ensure improved overall operational effectiveness, we place considerable emphasis on research and development in our global technical activities. This enables us to develop new products, packaging, processes and manufacturing technologies. Continued progress was made in our research in the key areas of raw materials, brewing, flavour stability, packaging materials and energy and water saving. Greenhouse gas emissions Disclosures concerning greenhouse gas emissions required by law are included in the strategic report, on page 50. Overseas branches SABMiller plc does not have any branches registered overseas. Substantial shareholdings As at 7 June 2016, we had received the following notifications of interests in voting rights of the issued share capital of the company pursuant to Rule 5.1.2 of the Disclosure and Transparency Rules: Date of notification Number of shares Percentage of issued share capital1 Altria Group, Inc. 29 June 2012 430,000,000 26.99 BevCo Ltd. 2 June 2014 225,000,000 13.99 Public Investment Corporation 11 March 2015 50,780,462 3.14 The Companies Act 2006 requires disclosure of persons with significant direct or indirect holdings of securities as at the year end. At the year-end we were aware of the following shareholdings of 3.00% or more: Percentage of issued share capital1 Altria Group, Inc. 26.52 BevCo Ltd 13.88 BlackRock Inc. 3.93 1 Excluding shares held in treasury. Directors’ indemnities The company has granted rolling indemnities to the directors, uncapped in amount, in relation to certain losses and liabilities which they may incur in the course of acting as directors of the company or of one or more of its subsidiaries and associates. The company secretary has also been granted an indemnity, on similar terms, covering his role as group company secretary of the company, and as a director or as company secretary of one or more of the company’s subsidiaries and associates. The board believes that it is in the best interests of the group to attract and retain the services of the most able and experienced directors and officers by offering competitive terms of engagement, including the granting of such indemnities. These indemnities are categorised as qualifying third-party indemnity provisions as defined by Section 234 of the Companies Act 2006. They will continue in force for the benefit of directors and officers in respect of their periods of office. Financial instruments Information on our financial risk management objectives and policies and details of our exposure to price risk, credit risk, liquidity risk and cash flow risk are contained in note 21 to the consolidated financial statements. Future developments Details of likely future developments in the business of the group are included in the strategic report. Other disclosures required by the Companies Act and the Disclosure and Transparency Rules We do not have any contractual or other arrangements that individually are essential to the business of the company or the group as a whole. The structure of our share capital, including the rights and obligations attaching to each class of share and the percentage of the share capital that each class of share comprises, is set out in note 25 to the consolidated financial statements. There are no securities of the company that grant the holder special control rights. Directors’ report continued GOVERNANCE |Directors’ report 94 SABMiller plc Annual Report 2016
  • 99.
    At 31 March2016 our employees’ benefit trust (EBT) held 11,476,675 ordinary shares in the company and our Employee Share Purchase Plan Trust (ESPPT) held 12,153 shares. By agreement with the company, voting rights attached to the EBT are not exercised unless shares are beneficially owned by a participant and that participant has instructed the Trustee to vote. As at 31 March 2016 there were no shares beneficially owned by a participant in our EBT. All the shares in our ESPPT are eligible to vote except for 22 shares held by the trustee which were unallocated and the trustee has agreed that the voting rights attached to those shares will not be exercised. The directors are responsible for the management of the business of the company and may exercise all the powers of the company subject to the articles of association and relevant statutes. Powers of the directors relating to the issuing and buying back of shares are set out in the articles of association. These powers are subject to renewal by our shareholders each year at the annual general meeting. Our articles of association give the board of directors power to appoint directors. The articles of association may be amended by special resolution of the shareholders. Directors appointed by the board are required to submit themselves for election by the shareholders at the next annual general meeting. Additionally, as disclosed in the corporate governance report on pages 58 to 69, Altria Group, Inc. (Altria) and BevCo Ltd (BevCo) have power under their respective relationship agreements with the company to nominate directors for appointment to the board and certain committees. These relationship agreements also regulate orderly marketing processes applicable in relation to any disposal of shares by Altria and BevCo. A change of control of the company would give The Coca-Cola Company certain rights under its bottling agreements with various subsidiaries of the company, and in certain limited circumstances may give China Resources Beer (Holdings) Company Limited the ability to exercise certain rights under a shareholders’ agreement in relation to our associate CR Snow. A change of control may also give the Molson Coors Brewing Company the ability to exercise certain rights under the MillerCoors operating agreement, and would result in certain minority protection rights contained in our relationship agreement with the Anadolu Group and Anadolu Efes ceasing to apply. The Anheuser- Busch InBev SA/NV transaction, if completed, will trigger some of the various change of control provisions mentioned above. We also have a number of facility agreements with banks which contain provisions giving rights to the banks upon a change of control of the company. The company does not have any agreements with any director or officer that would provide compensation for loss of office or employment resulting from a takeover. Our articles of association allow directors, in their absolute discretion, to refuse to register the transfer of a share in certificated form which is not fully paid or the transfer of a share in certificated form on which the company has a lien. If that share has been admitted to the Official List, the board may not refuse to register the transfer if this would prevent dealings in our shares from taking place on an open and proper basis. The board may also refuse to register a transfer of a share in certificated form unless the instrument of transfer is lodged, duly stamped (if stampable), at the address at which our register is held or at such other place as the directors may appoint, and (except in the case of a transfer by a financial institution where a certificate has not been issued in respect of the share) is accompanied by the certificate for the share to which it relates and such other evidence as the directors may reasonably require to show the right of the transferor to make the transfer, is in respect of only one class of share and is in favour of not more than four transferees jointly. Transfers of shares in uncertificated form must be made in accordance with, and subject to, the Uncertificated Securities Regulations (the Regulations), the facilities and requirements of the relevant CREST system and such arrangements as the board may determine in relation to the transfer of certificated shares (subject to the Regulations). Transfers of shares listed on the JSE in uncertificated form must be made in accordance with, and subject to, the Securities Services Act 2004, the Rules and Directives of the JSE and STRATE Ltd. Certificated shares may be transferred prior to dematerialisation, but share certificates must be dematerialised prior to trading in the STRATE environment. Pursuant to our code for securities transactions, directors and persons discharging managerial responsibilities, and employees may, in certain circumstances, require approval to deal in the company’s shares. Unless the directors otherwise determine, no shareholder is entitled in respect of any share held by them to vote either personally or by proxy at a shareholders’ meeting or to exercise any other right conferred by membership in relation to shareholders’ meetings if any call or other sum presently payable by them to the company in respect of that share remains unpaid. In addition, no shareholder will be entitled to vote if they have been served with a notice after failing to provide the company with information concerning interests in those shares required to be provided under Section 793 of the Companies Act 2006. Restrictions on the rights of the holders of convertible shares and deferred shares are set out in note 25 to the consolidated financial statements (although there are no convertible shares currently in issue). Votes may be exercised in person, by proxy, or in relation to corporate members, by a corporate representative. The deadline for delivering proxy forms is 48 hours before the time for holding the meeting. Going concern The directors have reviewed the group’s performance for the year and the principal risks it faces, together with the budget and cash flow forecasts, in particular with reference to the period to the end of September 2017, and the application of reasonably possible sensitivities associated with these forecasts. On the basis of this review, and in light of the current financial position and existing committed borrowing facilities, the directors are satisfied that the group has adequate resources to continue in operational existence and therefore have continued to adopt the going concern basis in preparing the consolidated financial statements. Viability statement The strategic report, set out on pages 2 to 53, includes information about SABMiller’s strategy, financial condition, cash flows and liquidity, as well as the factors, including the principal risks, likely to affect its future development. The directors have carried out a robust assessment of the principal risks, including those that would threaten its business model, future performance, solvency or liquidity. These risks and the ways they are being managed and mitigated are summarised on pages 16 and 17. GOVERNANCEGOVERNANCE 95SABMiller plc Annual Report 2016
  • 100.
    In accordance withprovision C.2.2 of the Code, the directors have assessed the prospects of the company over a period significantly longer than 12 months. The directors believe that a three year assessment period is most appropriate as it aligns with our normal and well established three year business planning processes. This three year period balances the long-term nature of investments in the brewing industry with an assessment of the variability of the key drivers of near-term business performance as well as external factors and regulation impacting the business. The directors’ assessment included a review of the financial impact of severe but plausible scenarios that could lessen the viability of the company, and an assumed inability to access the capital markets to refinance maturing term debt, and the likely effectiveness of the potential mitigations that management reasonably believes would be available to the company over this period. Based on this assessment, and taking into account the current position and principal risks, the directors have a reasonable expectation that the company will be able to continue in operation and meet its liabilities as they fall due over the three years. In assessing the prospects of the company, the directors noted that such assessment is subject to a degree of uncertainty that can be expected to increase looking out over time and, accordingly, that future outcomes cannot be guaranteed or predicted with certainty. Directors’ responsibility statement The directors are responsible for preparing the annual report, the directors’ remuneration report and the financial statements in accordance with applicable law and regulations. Company law requires the directors to prepare financial statements for each financial year. The directors have prepared the consolidated financial statements in accordance with International Financial Reporting Standards (IFRSs) as adopted by the European Union, and the parent company financial statements in accordance with United Kingdom Generally Accepted Accounting Practice (United Kingdom Accounting Standards) and applicable law. Under company law the directors must not approve the consolidated financial statements unless they are satisfied that they give a true and fair view of the state of affairs of the group and company and of the profit or loss of the group for that period. In preparing these financial statements, the directors are required to: – select suitable accounting policies and then apply them consistently; – make judgements and accounting estimates that are reasonable and prudent; – state whether IFRSs as adopted by the European Union and applicable UK Accounting Standards have been followed, subject to any material departures disclosed and explained in the group and parent company financial statements respectively; and – prepare the financial statements on the going concern basis unless it is inappropriate to presume that the group and the company will continue in business. The directors are responsible for keeping adequate accounting records that are sufficient to show and explain the transactions of the company and group and disclose with reasonable accuracy at any time the financial position of the company and group and enable them to ensure that the company and consolidated financial statements and the directors’ remuneration report comply with the Companies Act 2006 and, as regards the consolidated financial statements, Article 4 of the IAS Regulation. They are also responsible for safeguarding the assets of the company and group and hence for taking reasonable steps for the prevention and detection of fraud and other irregularities. A copy of the consolidated and company financial statements is placed on the company’s website. The directors are responsible for the maintenance and integrity of the statutory and audited information on the company’s website. Legislation in the United Kingdom governing the preparation and dissemination of financial statements may differ from legislation in other jurisdictions. The directors consider that the annual report and accounts, taken as a whole, is fair, balanced and understandable and provides the information necessary for shareholders to assess the group’s position and performance, business model and strategy. Each of the directors, whose names and functions are listed on pages 54 and 55 of this annual report, confirms that, to the best of his or her knowledge: – the consolidated financial statements, which have been prepared in accordance with IFRSs as adopted by the EU, the Companies Act 2006 and Article 4 of the IAS Regulation, give a true and fair view of the assets, liabilities, financial position and profit of the group; and – the management report contained in this annual report includes a fair review of the development and performance of the business and the position of the group, together with a description of the principal risks and uncertainties that it faces. The directors in office at the date of this report have each confirmed that: – so far as the director is aware, there is no relevant audit information of which the group’s auditors are unaware; and – he or she has taken all the steps that he or she ought to have taken as a director in order to make himself or herself aware of any relevant audit information and to establish that the group’s auditors are aware of that information. Post balance sheet events In May 2016 the South African Competition Tribunal approved, with agreed conditions, the formation of Coca-Cola Beverages Africa, Africa’s largest soft drinks operation. The transaction is expected to complete in early July 2016. Stephen Shapiro Group Company Secretary For and on behalf of the board of SABMiller plc 10 June 2016 GOVERNANCE |Directors’ report continued Directors’ report continued 96 SABMiller plc Annual Report 2016
  • 101.
    In accordance withListing Rule 9.8.4 R the table below gives the location of information required by that Rule to be included in the annual report and accounts. Listing Rule Information Location LR 9.8.4 (1) Amount of interest capitalised and amount and treatment of tax relief. Not applicable: no interest capitalised. LR 9.8.4 (2) Information required by Listing Rule 9.2.18 regarding the prior publication of unaudited financial information. Not applicable: no relevant information published in advance of this annual report and accounts. LR 9.8.4 (3) Rule deleted. Not applicable. LR 9.8.4 (4) Long-term incentive schemes where the only participant is a director or prospective director of the company and the arrangement is established specifically to facilitate the recruitment or retention of the director. Not applicable: no such arrangements exist. LR 9.8.4 (5) Arrangements under which a director has waived or agreed to waive emoluments from the company or any subsidiary undertaking. In accordance with our agreement with Altria, Howard Willard, as an executive director of Altria, did not receive a director’s fee from SABMiller (see page 82). LR 9.8.4 (6) Agreements with a director to waive future emoluments. Not applicable: no such agreement exists. LR 9.8.4 (7) Details of shares allotted during the period under review which have not been allotted to existing shareholders in proportion to their shareholdings and which have not been specifically authorised by the company’s shareholders. Not applicable: the only shares that have been allotted during the period have been to satisfy the exercise of options under various share incentive plans as approved by the company’s shareholders. See note 25 to the consolidated financial statements for further details of these allotments. LR 9.8.4 (8) Shares allotted in major subsidiary undertakings during the period under review which have not been allotted to existing shareholders in proportion to their shareholdings. Not applicable: no individual subsidiary is a major subsidiary undertaking as defined by the Listing Rules. LR 9.8.4 (9) Details of any parent undertaking’s participation in any placing during the period under review. Not applicable: SABMiller does not have a parent undertaking. LR 9.8.4 (10) Details of any contract of significance (as defined by the Listing Rules) existing between SABMiller, or any of its subsidiaries, in which either a director is materially interested or one of the parties is a controlling shareholder of SABMiller. Not applicable: no such contract of significance exists. LR 9.8.4 (11) Details of any contract for the provision of services to SABMiller, or any of its subsidiaries, by a controlling shareholder. Not applicable: SABMiller does not have a controlling shareholder. LR 9.8.4 (12) Details of any arrangement under which a shareholder has waived or agreed to waive any dividends. The trustees of two employees’ benefit trusts have elected to waive dividends, except in circumstances where they may be holding shares beneficially owned by participants. See notes 9 and 26 to the consolidated financial statements. LR 9.8.4 (13) Details of any arrangement under which a shareholder has agreed to waive future dividends. As noted above the trustees of the employees’ benefit trusts have elected to waive dividends, except in circumstances where they may be holding shares beneficially owned by participants. See notes 9 and 26 to the consolidated financial statements. LR 9.8.4 (14) Agreements with any controlling shareholder. Not applicable: SABMiller does not have a controlling shareholder. GOVERNANCEGOVERNANCE 97SABMiller plc Annual Report 2016
  • 102.
    FINANCIAL STATEMENTS Independent auditors’report to the members of SABMiller plc Report on the financial statements Our opinion In our opinion: – SABMiller plc’s consolidated financial statements and company financial statements (the financial statements) give a true and fair view of the state of the group’s and of the company’s affairs as at 31 March 2016 and of the group’s profit and cash flows for the year then ended; – the consolidated financial statements have been properly prepared in accordance with International Financial Reporting Standards (IFRSs) as adopted by the European Union; – the company financial statements have been properly prepared in accordance with United Kingdom Generally Accepted Accounting Practice; and – the financial statements have been prepared in accordance with the requirements of the Companies Act 2006 and, as regards the consolidated financial statements, Article 4 of the IAS Regulation. What we have audited SABMiller plc’s financial statements comprise: – the consolidated income statement and the consolidated statement of comprehensive income for the year ended 31 March 2016; – the consolidated and company balance sheets as at 31 March 2016; – the consolidated cash flow statement for the year then ended; – the consolidated and company statements of changes in equity for the year then ended; and – the notes to the consolidated and company financial statements, which include a summary of significant accounting policies and other explanatory information. Certain required disclosures have been presented elsewhere in the Annual Report, rather than in the notes to the financial statements. These are cross-referenced from the financial statements and are identified as audited. The financial reporting framework that has been applied in the preparation of the consolidated financial statements is IFRSs as adopted by the European Union and applicable law. The financial reporting framework that has been applied in the preparation of the company financial statements is United Kingdom Accounting Standards, comprising FRS 101 ‘Reduced Disclosure Framework’, and applicable law (United Kingdom Generally Accepted Accounting Practice). Our audit approach Overview Materiality − Overall group materiality: US$230 million which represents approximately 5% of consolidated profit before tax and exceptional items included within operating profit. Audit scope – The group is structured into five geographic segments and one corporate segment. Each geographic segment is a consolidation of a number of country-based operating businesses. We identified three segments (Latin America, Africa and Corporate), three country-based operating businesses (Poland, Czech Republic and Australia) and one joint venture (MillerCoors) which, in our view, required an audit of their complete financial information. Specified audit procedures were also performed on certain of the group’s associates (Castel, CR Snow and Anadolu Efes). – Taken together, the components at which audit work was performed accounted for 73% of consolidated revenue, 72% of consolidated profit before tax and 76% of consolidated profit before tax and exceptional items. Areas of focus – Recoverability of the carrying value of the Australian cash generating unit (CGU). – Carrying value of the investment in the Angolan associate. – Provisions for uncertain tax positions. – Classification of exceptional items. The scope of our audit and our areas of focus We conducted our audit in accordance with International Standards on Auditing (UK and Ireland) (ISAs (UK & Ireland)). We designed our audit by determining materiality and assessing the risks of material misstatement in the financial statements. In particular, we looked at where management made judgements, for example in respect of significant accounting estimates that involved making assumptions and considering future events that are inherently uncertain. Consistent with all of our audits, we also addressed the risk of management override of internal controls, including evaluating whether there was evidence of bias by management that represented a risk of material misstatement due to fraud, and the risk of fraud in revenue recognition. Procedures designed to address these risks included testing of material journal entries and post-close adjustments, testing and evaluating management’s key accounting estimates for reasonableness and consistency, undertaking cut-off procedures to check proper cut-off of revenue and expenses and testing the occurrence and accuracy of revenue transactions. In addition, we incorporate an element of unpredictability into our audit work each year. The risks of material misstatement that had the greatest effect on our audit, including the allocation of our resources and effort, are identified as areas of focus in the table below. We have also set out how we tailored our audit to address these specific areas in order to provide an opinion on the financial statements as a whole. Any comments we make on the results of our procedures should be read in this context. This is not a complete list of all risks identified by our audit. 98 SABMiller plc Annual Report 2016
  • 103.
    Area of focusHow our audit addressed the area of focus Recoverability of the carrying value of the Australian CGU As required by applicable accounting standards in relation to goodwill, management conducts an impairment review on an annual basis to identify if the carrying values of goodwill and associated assets are considered to be impaired. We specifically focused on the Australian CGU given the size of the goodwill balance, and because the assessment of value involves subjective judgements which are highly sensitive to small changes in assumptions. Management determines the recoverable amount of the Australian CGU utilising a discounted cash flow model with five-year projections and a terminal value. Key assumptions within this model include net producer revenue (NPR) and associated estimates of short-term EBITA growth, long-term growth rate, and discount rate. Despite continued decline in the local beer category during the year, growth has been achieved through the successful execution of a number of initiatives, increased market share and improved customer relationships. As a result of its assessment, management estimated the recoverable amount is greater than the carrying value. Refer to the audit committee review of areas of significant judgement (page 71) and goodwill note 10. We satisfied ourselves that it was appropriate to use fair value less costs to dispose (FVLCD) as the basis for determining the recoverable amount and verified the mathematical accuracy of the cash flow model used to estimate FVLCD. We considered the accuracy of management’s forecasting process by comparing budgeted results to actual performance of the Australian business. We assessed the consistency of the assumptions used in management’s cash flow forecasts with those a market participant would use when valuing the business. As part of this process we disaggregated and understood the individual cash flow components such as developments in the Australian beer category, Carlton and United Breweries’ market share, the drivers of NPR growth projections such as price and mix, costs and the resultant EBITA forecasts. This included comparing inputs to the business’s own forecasts based on latest internal board approved budgets and external market data. We also assessed the risks associated with achieving the forecast, which provided data points on which to sensitise management’s assumptions over the first five years of the model. We compared the discount and long-term growth rates used with market information and determined that they all fall within a range of external data. We satisfied ourselves that the assumptions used in determining management’s estimate of the recoverable amount were reasonable. We also considered the EBITDA multiple implied by management’s estimate and determined that it falls within a range of independently derived data. Our sensitivity analysis highlighted that the model continues to be sensitive to a combination of changes in key assumptions. Any reasonably possible change in these assumptions could reduce headroom and may result in an impairment. We satisfied ourselves that this was appropriately highlighted within the disclosures in note 10. Carrying value of the investment in the Angolan associate The devaluation of the Angolan kwanza, liquidity restrictions and a deterioration in macroeconomic conditions in the second half of the year led to a significant downscaling of Castel’s business within Angola. Based on these factors, management determined that an impairment trigger existed and accordingly assessed the carrying value of the group’s investment in its Angolan associate. The recoverable amount for the business, which was a key determinant of the recoverable value of the investment, was based on a discounted cash flow model involving five-year projections with a terminal value. Key assumptions within this model include estimates of short-term growth, long-term growth rate and discount rate. As a result of the assessment management has recorded an impairment charge of US$372 million in relation to the investment in associate in addition to the recognition of the group’s share of Castel’s impairment and related charges. We specifically focused on the Angolan assessment given the quantum of the impairment charge, the economic uncertainties and the judgemental nature of the future cash flow forecasts. Refer to the audit committee review of areas of significant judgement (page 71) and investments in associates note 14. We verified the mathematical accuracy of the cash flow model used to support the recoverable amount and determine the impairment charge. We assessed management’s future cash flow forecasts by comparing them to latest internal board approved plans and considering them in light of macroeconomic indicators and production forecasts, recognising that the operations have been significantly scaled down. We also assessed the reasonableness of the country discount and long-term growth rates used and determined that they were within a range of independently derived data and the model was not sensitive to reasonably possible changes in these assumptions. The significant decline in the recoverable amount is primarily driven by a decrease in forecast profitability. We sensitised the cash flows to illustrate the impact of increased profitability compared to plan and satisfied ourselves that the impairment charge was appropriate given the deterioration in the macroeconomic environment and the downscaling of Castel’s operations within Angola. We satisfied ourselves that the assumptions used to determine the recoverable value of the investment were reasonable. We also satisfied ourselves that the impairment was appropriately highlighted and disclosed in note 14. 99SABMiller plc Annual Report 2016 FINANCIALSTATEMENTS
  • 104.
    FINANCIAL STATEMENTS Independent auditors’report to the members of SABMiller plc continued Area of focus How our audit addressed the area of focus Provisions for uncertain tax positions Due to the group operating across a number of different tax jurisdictions it is subject to periodic challenges by local tax authorities on a range of tax matters during the normal course of business including transaction related tax matters and transfer pricing arrangements where centralised functions support a number of different countries. Where the amount of tax payable or recoverable is uncertain, the directors establish provisions based on their judgement of the probable amount of the liability, or recovery. We focused on these judgements in assessing the quantification and likelihood of the potential exposures and therefore the level of provisions required against them. In particular we focused on the impact of recent rulings and the status of ongoing local tax authority audits. Refer to the audit committee review of areas of significant judgement (page 72). We obtained a detailed understanding of the potential consequences of the group’s tax policies and the status of the ongoing local tax authority audits. We assessed key technical tax issues and risks related to business and legislative developments using, where applicable, our local and international specialised tax knowledge. We obtained explanations regarding the tax treatment applied to material transactions and arrangements and the corresponding provisions recorded. We obtained corroborative evidence supporting these explanations, including reading communications with local tax authorities and copies of tax advice obtained by management from its external tax advisers. We also challenged the tax positions taken for each material exposure, in particular where there have been significant developments with local tax authorities, and satisfied ourselves that relevant provisions were appropriate. Classification of exceptional items The group has historically had significant levels of exceptional items which are disclosed separately within the income statement and are excluded from management’s reporting of the underlying results of the business. In the year the group identified US$556 million of net exceptional items within operating profit comprising charges of US$585 million and credits of US$29 million. The treatment of exceptional items is explained within the group accounting policy. In the year exceptional items primarily relate to impairments and other related charges in respect of the group’s investment in Angola and costs associated with the proposed Anheuser-Busch InBev transaction. We focused on this area because the classification of exceptional items requires judgement and they are also excluded from the calculation of elements of executive remuneration. Consistency in the identification and presentation of these items is also important to ensure comparability of year on year reporting within the Annual Report. Refer to the audit committee review of areas of significant judgement (page 72). We substantiated the nature and quantum of individual items to appropriate corroborating evidence. We considered whether the classification of individual items as exceptional was consistent with the group’s accounting policy and treatment in prior years where applicable. We considered whether the group has taken a balanced approach to disclosure of these items, checking that exceptional one-off items of income were treated consistently with one-off items of cost. Based on our procedures, we were satisfied that the treatment and classification of these items was consistent with prior years and in line with the group’s policy. 100 SABMiller plc Annual Report 2016
  • 105.
    How we tailoredthe audit scope We tailored the scope of our audit to ensure that we performed enough work to be able to give an opinion on the financial statements as a whole, taking into account the geographic structure of the group, the accounting processes and controls, and the industry in which the group operates. The group is structured in five geographic segments being Latin America, Africa, Asia Pacific, Europe and North America. A sixth corporate head office segment is managed at a group level. Each geographic segment is a consolidation of a number of country-based operating businesses, regional and central functions and the group’s interests in associates and joint ventures within that geographical region. Based on this, we determined the appropriate segment and operating businesses to perform work over based on factors such as the size of the balances, the areas of focus as noted above, known or historical accounting issues and the desire to include some unpredictability in our audit procedures. We considered the type of work that needed to be performed on these segments and operating businesses by us, as the group engagement team, or by component auditors within PwC UK and from other PwC network firms and other firms operating under our instruction. Where the work was performed by component auditors, we determined the level of involvement we needed to have in the audit work at those segments or operating businesses to be able to conclude whether sufficient appropriate audit evidence had been obtained as a basis for our opinion on the consolidated financial statements as a whole. We identified three segments (Latin America, Africa and Corporate), three country-based operating businesses (Poland, Czech Republic and Australia) and one joint venture (MillerCoors) which, in our view, required an audit of their complete financial information. Specified audit procedures were also performed on certain of the group’s associates (Castel, CR Snow and Anadolu Efes). This, together with procedures performed on regional and central functions and at the group level, accounted for 73% of consolidated revenue, 72% of consolidated profit before tax and 76% of consolidated profit before tax and exceptional items. At the group level, we also carried out analytical and other procedures on the financial information not covered by the procedures described above. The involvement of the group engagement team in the work of the component auditors included site visits, conference calls, meetings with local management, review of work papers, attendance at audit clearance meetings, and other forms of communication as considered necessary depending on the significance of the component and the extent of accounting and audit issues arising. Materiality The scope of our audit was influenced by our application of materiality. We set certain quantitative thresholds for materiality. These, together with qualitative considerations, helped us to determine the scope of our audit and the nature, timing and extent of our audit procedures on the individual financial statement line items and disclosures and in evaluating the effect of misstatements, both individually and on the financial statements as a whole. Based on our professional judgement, we determined materiality for the financial statements as a whole as follows: Overall group materiality US$230 million (2015: US$250 million). How we determined it Approximately 5% of profit before tax (US$4,074 million), adjusted for exceptional items included within operating profit (US$556 million). Rationale for benchmark applied We considered this adjusted measure to be the most relevant in assessing the recurring financial performance of the group. We agreed with the audit committee that we would report to them misstatements identified during our audit above US$20 million (2015: US$20 million) as well as misstatements below that amount that, in our view, warranted reporting for qualitative reasons. Going concern Under the Listing Rules we are required to review the directors’ statement, set out on page 95, in relation to going concern. We have nothing to report having performed our review. Under ISAs (UK & Ireland) we are required to report to you if we have anything material to add or to draw attention to in relation to the directors’ statement about whether they considered it appropriate to adopt the going concern basis in preparing the financial statements. We have nothing material to add or to draw attention to. As noted in the directors’ statement, the directors have concluded that it is appropriate to adopt the going concern basis in preparing the financial statements. The going concern basis presumes that the group and company have adequate resources to remain in operation, and that the directors intend them to do so, for at least one year from the date the financial statements were signed. As part of our audit we have concluded that the directors’ use of the going concern basis is appropriate. However, because not all future events or conditions can be predicted, these statements are not a guarantee as to the group’s and company’s ability to continue as a going concern. Other required reporting Consistency of other information Companies Act 2006 opinion In our opinion, the information given in the strategic report and the directors’ report for the financial year for which the financial statements are prepared is consistent with the financial statements. ISAs (UK & Ireland) reporting Under ISAs (UK & Ireland) we are required to report to you if, in our opinion: − information in the Annual Report is: – materially inconsistent with the information in the audited financial statements; or – apparently materially incorrect based on, or materially inconsistent with, our knowledge of the group and company acquired in the course of performing our audit; or – otherwise misleading. We have no exceptions to report arising from this responsibility. – the statement given by the directors on page 96, in accordance with provision C.1.1 of the UK Corporate Governance Code (the Code), that they consider the Annual Report taken as a whole to be fair, balanced and understandable and provides the information necessary for members to assess the group’s and company’s position and performance, business model and strategy is materially inconsistent with our knowledge of the group and company acquired in the course of performing our audit. We have no exceptions to report arising from this responsibility. – the section of the Annual Report on page 71, as required by provision C.3.8 of the Code, describing the work of the audit committee does not appropriately address matters communicated by us to the audit committee. We have no exceptions to report arising from this responsibility. 101SABMiller plc Annual Report 2016 FINANCIALSTATEMENTS
  • 106.
    FINANCIAL STATEMENTS Independent auditors’report to the members of SABMiller plc continued The directors’ assessment of the prospects of the group and of the principal risks that would threaten the solvency or liquidity of the group Under ISAs (UK & Ireland) we are required to report to you if we have anything material to add or to draw attention to in relation to: – the directors’ confirmation on page 16 of the Annual Report, in accordance with provision C.2.1 of the Code, that they have carried out a robust assessment of the principal risks facing the group, including those that would threaten its business model, future performance, solvency or liquidity. We have nothing material to add or to draw attention to. – the disclosures in the Annual Report that describe those risks and explain how they are being managed or mitigated. We have nothing material to add or to draw attention to. – the directors’ explanation on pages 95 and 96 of the Annual Report, in accordance with provision C.2.2 of the Code, as to how they have assessed the prospects of the group, over what period they have done so and why they consider that period to be appropriate, and their statement as to whether they have a reasonable expectation that the group will be able to continue in operation and meet its liabilities as they fall due over the period of their assessment, including any related disclosures drawing attention to any necessary qualifications or assumptions. We have nothing material to add or to draw attention to. Under the Listing Rules we are required to review the directors’ statement that they have carried out a robust assessment of the principal risks facing the group and the directors’ statement in relation to the longer-term viability of the group. Our review was substantially less in scope than an audit and only consisted of making inquiries and considering the directors’ process supporting their statements; checking that the statements are in alignment with the relevant provisions of the Code; and considering whether the statements are consistent with the knowledge acquired by us in the course of performing our audit. We have nothing to report having performed our review. Adequacy of accounting records and information and explanations received Under the Companies Act 2006 we are required to report to you if, in our opinion: – we have not received all the information and explanations we require for our audit; or – adequate accounting records have not been kept by the company, or returns adequate for our audit have not been received from branches not visited by us; or – the company financial statements and the part of the directors’ remuneration report to be audited are not in agreement with the accounting records and returns. We have no exceptions to report arising from this responsibility. Directors’ remuneration Directors’ remuneration report – Companies Act 2006 opinion In our opinion, the part of the directors’ remuneration report to be audited has been properly prepared in accordance with the Companies Act 2006. Other Companies Act 2006 reporting Under the Companies Act 2006 we are required to report to you if, in our opinion, certain disclosures of directors’ remuneration specified by law are not made. We have no exceptions to report arising from this responsibility. Corporate governance statement Under the Listing Rules we are required to review the part of the corporate governance statement relating to ten further provisions of the Code. We have nothing to report having performed our review. Responsibilities for the financial statements Our responsibilities and those of the directors As explained more fully in the directors’ responsibilities statement, the directors are responsible for the preparation of the financial statements and for being satisfied that they give a true and fair view. Our responsibility is to audit and express an opinion on the financial statements in accordance with applicable law and ISAs (UK & Ireland). Those standards require us to comply with the Auditing Practices Board’s Ethical Standards for Auditors. This report, including the opinions, has been prepared for and only for the company’s members as a body in accordance with Chapter 3 of Part 16 of the Companies Act 2006 and for no other purpose. We do not, in giving these opinions, accept or assume responsibility for any other purpose or to any other person to whom this report is shown or into whose hands it may come save where expressly agreed by our prior consent in writing. What an audit of financial statements involves An audit involves obtaining evidence about the amounts and disclosures in the financial statements sufficient to give reasonable assurance that the financial statements are free from material misstatement, whether caused by fraud or error. This includes an assessment of: – whether the accounting policies are appropriate to the group’s and the company’s circumstances and have been consistently applied and adequately disclosed; – the reasonableness of significant accounting estimates made by the directors; and – the overall presentation of the financial statements. We primarily focus our work in these areas by assessing the directors’ judgements against available evidence, forming our own judgements, and evaluating the disclosures in the financial statements. We test and examine information, using sampling and other auditing techniques, to the extent we consider necessary to provide a reasonable basis for us to draw conclusions. We obtain audit evidence through testing the effectiveness of controls, substantive procedures or a combination of both. In addition, we read all the financial and non-financial information in the Annual Report to identify material inconsistencies with the audited financial statements and to identify any information that is apparently materially incorrect based on, or materially inconsistent with, the knowledge acquired by us in the course of performing the audit. If we become aware of any apparent material misstatements or inconsistencies we consider the implications for our report. Richard Hughes BA FCA (Senior Statutory Auditor) for and on behalf of PricewaterhouseCoopers LLP Chartered Accountants and Statutory Auditors London 10 June 2016 102 SABMiller plc Annual Report 2016
  • 107.
    Consolidated income statement forthe year ended 31 March Notes 2016 US$m 2015 US$m Revenue 2 19,833 22,130 Net operating expenses 3 (16,379) (17,746) Operating profit 2 3,454 4,384 Operating profit before exceptional items 2 4,010 4,459 Exceptional items 4 (556) (75) Net finance costs 5 (506) (637) Finance costs 5a (763) (1,047) Finance income 5b 257 410 Share of post-tax results of associates and joint ventures 2 1,126 1,083 Profit before taxation 4,074 4,830 Taxation 7 (1,152) (1,273) Profit for the year 27a 2,922 3,557 Profit attributable to non-controlling interests 223 258 Profit attributable to owners of the parent 26a 2,699 3,299 2,922 3,557 Basic earnings per share (US cents) 8 167.8 205.7 Diluted earnings per share (US cents) 8 166.0 203.5 The notes on pages 108 to 170 are an integral part of these consolidated financial statements. 103SABMiller plc Annual Report 2016 FINANCIALSTATEMENTS
  • 108.
    FINANCIAL STATEMENTS Consolidated statementof comprehensive income for the year ended 31 March Notes 2016 US$m 2015 US$m Profit for the year 2,922 3,557 Other comprehensive loss: Items that will not be reclassified to profit or loss Net remeasurements of defined benefit plans 30 5 (7) Tax on items that will not be reclassified 7 (29) 70 Share of associates’ and joint ventures’ other comprehensive income/(loss) 72 (178) Total items that will not be reclassified to profit or loss 48 (115) Items that may be reclassified subsequently to profit or loss Currency translation differences on foreign currency net investments: (1,230) (5,387) – Decrease in foreign currency translation reserve during the year (1,230) (5,550) – Recycling of foreign currency translation reserve on disposals – 163 Net investment hedges: – Fair value gains arising during the year 26b 88 608 Cash flow hedges: 26b (64) 30 – Fair value (losses)/gains arising during the year (56) 45 – Fair value gains transferred to inventory (24) (8) – Fair value (gains)/losses transferred to property, plant and equipment (1) 1 – Fair value losses/(gains) transferred to profit or loss 17 (8) Tax on items that may be reclassified subsequently to profit or loss 7 18 (3) Share of associates’ and joint ventures’ other comprehensive loss (89) (120) Total items that may be reclassified subsequently to profit or loss (1,277) (4,872) Other comprehensive loss for the year, net of tax (1,229) (4,987) Total comprehensive income/(loss) for the year 1,693 (1,430) Attributable to: Non-controlling interests 169 179 Owners of the parent 1,524 (1,609) Total comprehensive income/(loss) for the year 1,693 (1,430) The notes on pages 108 to 170 are an integral part of these consolidated financial statements. 104 SABMiller plc Annual Report 2016
  • 109.
    Consolidated balance sheet at31 March Notes 2016 US$m 2015 US$m Assets Non-current assets Goodwill 10 14,268 14,746 Intangible assets 11 6,526 6,878 Property, plant and equipment 12 7,750 7,961 Investments in joint ventures 13 5,512 5,428 Investments in associates 14 4,114 4,459 Available for sale investments 19 21 Derivative financial instruments 22 565 770 Trade and other receivables 16 121 126 Deferred tax assets 19 209 163 39,084 40,552 Current assets Inventories 15 993 1,030 Trade and other receivables 16 1,742 1,711 Current tax assets 59 190 Derivative financial instruments 22 281 463 Cash and cash equivalents 17 1,430 965 4,505 4,359 Total assets 43,589 44,911 Liabilities Current liabilities Derivative financial instruments 22 (213) (101) Borrowings 20 (2,926) (1,961) Trade and other payables 18 (3,870) (3,728) Current tax liabilities (830) (1,184) Provisions 24 (270) (358) (8,109) (7,332) Non-current liabilities Derivative financial instruments 22 (26) (10) Borrowings 20 (8,814) (10,583) Trade and other payables 18 (28) (18) Deferred tax liabilities 19 (2,250) (2,275) Provisions 24 (274) (338) (11,392) (13,224) Total liabilities (19,501) (20,556) Net assets 24,088 24,355 Equity Share capital 25 168 168 Share premium 6,849 6,752 Merger relief reserve 3,628 3,963 Other reserves 26b (6,758) (5,457) Retained earnings 26a 19,005 17,746 Total shareholders’ equity 22,892 23,172 Non-controlling interests 1,196 1,183 Total equity 24,088 24,355 The balance sheet of SABMiller plc is shown on page 171. The notes on pages 108 to 170 are an integral part of these consolidated financial statements. The financial statements were authorised for issue by the board of directors on 10 June 2016 and were signed on its behalf by: Alan Clark Domenic De Lorenzo Chief Executive Chief Financial Officer 105SABMiller plc Annual Report 2016 FINANCIALSTATEMENTS
  • 110.
    FINANCIAL STATEMENTS Consolidated cashflow statement for the year ended 31 March Notes 2016 US$m 2015 US$m Cash flows from operating activities Cash generated from operations 27a 5,116 5,812 Interest received 273 352 Interest paid (659) (1,003) Tax paid (1,315) (1,439) Net cash generated from operating activities 27b 3,415 3,722 Cash flows from investing activities Purchase of property, plant and equipment (1,210) (1,394) Proceeds from sale of property, plant and equipment 74 68 Purchase of intangible assets (103) (178) Proceeds from disposal of available for sale investments – 1 Proceeds from disposal of associates – 979 Acquisition of businesses (net of cash acquired) (191) (5) Investments in joint ventures 13 (301) (216) Investments in associates (4) (3) Dividends received from joint ventures 13 998 976 Dividends received from associates 253 430 Dividends received from other investments – 1 Net cash (used in)/generated from investing activities (484) 659 Cash flows from financing activities Proceeds from the issue of shares 113 202 Proceeds from the issue of shares in subsidiaries to non-controlling interests – 29 Purchase of own shares for share trusts 26a (149) (146) Purchase of shares from non-controlling interests – (3) Proceeds from borrowings 1,064 594 Repayment of borrowings (1,847) (4,413) Capital element of finance lease payments (10) (10) Net cash receipts on derivative financial instruments 547 243 Dividends paid to shareholders of the parent 9 (1,860) (1,705) Dividends paid to non-controlling interests (153) (173) Net cash used in financing activities (2,295) (5,382) Net cash inflow/(outflow) from operating, investing and financing activities 636 (1,001) Effects of exchange rate changes (115) (117) Net increase/(decrease) in cash and cash equivalents 521 (1,118) Cash and cash equivalents at 1 April 750 1,868 Cash and cash equivalents at 31 March 27c 1,271 750 The notes on pages 108 to 170 are an integral part of these consolidated financial statements. 106 SABMiller plc Annual Report 2016
  • 111.
    Consolidated statement ofchanges in equity for the year ended 31 March Notes Share capital US$m Share premium US$m Merger relief reserve US$m Other reserves US$m Retained earnings US$m Total shareholders’ equity US$m Non- controlling interests US$m Total equity US$m At 1 April 2014 167 6,648 4,321 (702) 15,885 26,319 1,163 27,482 Total comprehensive loss – – – (4,755) 3,146 (1,609) 179 (1,430) Profit for the year – – – – 3,299 3,299 258 3,557 Other comprehensive loss – – – (4,755) (153) (4,908) (79) (4,987) Dividends paid 9 – – – – (1,705) (1,705) (185) (1,890) Issue of SABMiller plc ordinary shares 1 104 – – 97 202 – 202 Proceeds from the issue of shares in subsidiaries to non-controlling interests – – – – – – 29 29 Share of movements in associates’ other reserves 26a – – – – (6) (6) – (6) Payment for purchase of own shares for share trusts 26a – – – – (146) (146) – (146) Buyout of non-controlling interests – – – – – – (3) (3) Utilisation of merger relief reserve 26a – – (358) – 358 – – – Credit entry relating to share-based payments 26a – – – – 117 117 – 117 At 31 March 2015 168 6,752 3,963 (5,457) 17,746 23,172 1,183 24,355 Total comprehensive income – – – (1,223) 2,747 1,524 169 1,693 Profit for the year – – – – 2,699 2,699 223 2,922 Other comprehensive loss – – – (1,223) 48 (1,175) (54) (1,229) Dividends paid 9 – – – – (1,860) (1,860) (156) (2,016) Issue of SABMiller plc ordinary shares – 97 – – 16 113 – 113 Share of movements in associates’ other reserves 26a – – – – 2 2 – 2 Payment for purchase of own shares for share trusts 26a – – – – (149) (149) – (149) Utilisation of merger relief reserve 26a – – (335) – 335 – – – Transfer between reserves 26a – – – (78) 78 – – – Credit entry relating to share-based payments 26a – – – – 90 90 – 90 At 31 March 2016 168 6,849 3,628 (6,758) 19,005 22,892 1,196 24,088 The notes on pages 108 to 170 are an integral part of these consolidated financial statements. Merger relief reserve At 1 April 2015 the merger relief reserve comprised US$3,395 million in respect of the excess of value attributed to the shares issued as consideration for Miller Brewing Company over the nominal value of those shares and US$568 million (2014: US$926 million) relating to the merger relief arising on the issue of SABMiller plc ordinary shares for the buyout of non-controlling interests in the group’s Polish business. In the year ended 31 March 2016 the group transferred US$335 million (2015: US$358 million) of the reserve relating to the Polish business to retained earnings upon realisation of qualifying consideration. 107SABMiller plc Annual Report 2016 FINANCIALSTATEMENTS
  • 112.
    FINANCIAL STATEMENTS Notes tothe consolidated financial statements 1. Accounting policies The principal accounting policies adopted in the preparation of the group’s financial statements are set out below. These policies have been consistently applied to all the years presented, unless otherwise stated. a) Basis of preparation The consolidated financial statements of SABMiller plc have been prepared in accordance with International Financial Reporting Standards as adopted by the European Union (IFRSs as adopted by the EU), and the Companies Act 2006 applicable to companies reporting under IFRS. The financial statements are prepared under the historical cost convention, except for the revaluation to fair value of certain financial assets and liabilities, and post-retirement assets and liabilities as described in the accounting policies below. The financial statements have been prepared on a going concern basis. The preparation of financial statements in conformity with IFRS requires the use of certain critical accounting estimates. It also requires management to exercise its judgement in the process of applying the group’s accounting policies. Actual results could differ from those estimates. b) Recent accounting developments (i) New standards, amendments and interpretations of existing standards adopted by the group The following standards, interpretations and amendments have been adopted by the group as of 1 April 2015 and which have had no material impact on the consolidated results of operations or financial position of the group. − Amendment to IAS 19, ‘Employee benefits’ on defined benefit plans; − IFRIC 21, ‘Levies’; − Annual improvements to IFRS 2012; and – Annual improvements to IFRS 2013. (ii) New standards, amendments and interpretations of existing standards that are not yet effective and have not been early adopted by the group The following standards, interpretations and amendments to existing standards mandatory for the group’s accounting periods beginning on or after 1 April 2016 are not expected to have a material impact on the consolidated results of operations or financial position of the group. − Amendment to IAS 1, ‘Presentation of financial statements’ on the disclosure initiative is effective from 1 January 2016; − Amendments to IFRS 10, ‘Consolidated financial statements’, IFRS 12, ‘Disclosure of interests in other entities’, and IAS 28, ‘Investments in associates and joint ventures’, on investment entities applying the consolidation exemption, are effective from 1 January 20161 . − Amendment to IFRS 11, ‘Joint arrangements’, on acquisition of an interest in a joint operation, is effective from 1 January 2016; − Amendments to IAS 16, ‘Property, plant and equipment’, and IAS 38, ‘Intangible assets’, on depreciation and amortisation, are effective from 1 January 2016; − Amendments to IAS 16, ‘Property, plant and equipment’, and IAS 41, ‘Agriculture’, regarding bearer plants, are effective from 1 January 2016; − Amendment to IAS 27, ‘Separate financial statements’, is effective from 1 January 2016; and − Annual improvements to IFRS 2014, are effective from 1 January 2016. The group has yet to assess the full impact of the following standards and amendments to existing standards mandatory for the group’s accounting periods beginning on or after 1 April 2017 or later periods, which have not been early adopted. − IFRS 9, ‘Financial instruments’, is effective from 1 January 20181 ; − IFRS 15, ‘Revenue from contracts with customers’, is effective from 1 January 20181 ; and – IFRS 16, ‘Leases’, is effective from 1 January 20191 . 1 Not yet endorsed by the EU. c) Significant judgements and estimates In determining and applying accounting policies, judgement is often required where the choice of specific policy, assumption or accounting estimate to be followed could materially affect the reported results or net position of the group, should it later be determined that a different choice be more appropriate. Management considers the following to be areas of significant judgement and estimation for the group due to greater complexity and/or particularly subject to the exercise of judgement. The group has reconsidered the significant judgements and estimates applied, in particular the determination of exceptional items and share-based compensation, where it has not assumed the completion of the AB InBev transaction. (i) Impairment reviews Goodwill arising on business combinations is allocated to the relevant cash generating unit (CGU). Impairment reviews in respect of the relevant CGUs, and also in respect of the investments in joint ventures and associates, are performed at least annually or more regularly if events indicate that this is necessary. Impairment reviews are based on future cash flows discounted using the weighted average cost of capital for the relevant country with terminal values calculated applying a long-term growth rate. The future cash flows which are based on business forecasts, the long-term growth rates and the discount rates used are dependent on management estimates and judgements. Future events could cause the assumptions used in these impairment reviews to change with a consequent adverse impact on the results and net position of the group. Details of the estimates used in the impairment reviews for the year are set out in note 10. (ii) Taxation The group operates in many countries and is subject to taxes in numerous jurisdictions. Significant judgement is required in determining the provision for taxes as the tax treatment is often by its nature complex, and cannot be finally determined until a formal resolution has been reached with the relevant tax authority which may take several years to conclude. Amounts provided are accrued based on management’s interpretation of country specific tax laws and the likelihood of settlement. Actual liabilities could differ from the amount provided which could have a consequent adverse impact on the results and net position of the group. Further significant judgement is required in determining whether a deferred tax asset is recoverable, and thus recognised. This is based on management’s expectations with regard to taxable temporary differences and forecasts of future taxable profits. 108 SABMiller plc Annual Report 2016
  • 113.
    (iii) Business combinations Onthe acquisition of a company or business, a determination of the fair value of the assets acquired and liabilities assumed, and the useful life of intangible assets and property, plant and equipment acquired is performed, which requires the application of management judgement. Future events could cause the assumptions used by the group to change which could have a significant impact on the results and net position of the group. (iv) Exceptional items Exceptional items are expense or income items recorded in a period which have been determined by management as being material by their size or incidence and are presented separately within the results of the group. The determination of which items are disclosed as exceptional items will affect the presentation of profit measures including EBITA and adjusted earnings per share, and requires a degree of judgement. Details relating to exceptional items reported during the year are set out in note 4. (v) Share-based compensation Accounting for share-based compensation requires certain assumptions to be made in order to determine the amounts to be recognised in the income statement in accordance with IFRS 2. The income statement charge spreads the fair value of each award at the grant date over the vesting period on a straight-line basis, after considering an estimate of the share awards that will eventually vest. The estimate of the level of vesting is reviewed at least annually, with any impact on the cumulative charge recognised immediately. The completion of the proposed AB InBev transaction has not been assumed in determining the extent and timing of the vesting of awards. The fair value at the date of grant is calculated by various binomial model calculations and Monte Carlo simulations which require various management assumptions including, inter alia, forfeiture rates, dividend yield, volatility, and risk-free interest rates. Details of the assumptions used in determining fair values of grants in the year are set out in note 25. d)Segmental reporting Operating segments reflect the management structure of the group and the way performance is evaluated and resources allocated based on group net producer revenue and EBITA by the group’s chief operating decision maker, defined as the executive directors. The group is focused geographically, and while not meeting the definition of a reportable segment, the group reports separately as a segment Corporate (and in the prior year South Africa: Hotels and Gaming) as this provides useful additional information. Segmental performance is reported after the specific apportionment of attributable head office costs. e) Basis of consolidation SABMiller plc (the company) is a public limited company incorporated in Great Britain and registered in England and Wales. The consolidated financial statements include the financial information of the subsidiaries, associates and joint ventures owned by the company. (i) Subsidiaries Subsidiaries are entities controlled by the company. Control is where the company has power to vary the returns from its investment in the entity and exposure to the variability of those returns. Where the company’s interest in subsidiaries is less than 100%, the share attributable to outside shareholders is reflected in non-controlling interests. Subsidiaries are included in the financial statements from the date control commences until the date control ceases. On the subsequent disposal or termination of a business, the results of the business are included in the group’s results up to the effective date of disposal. The profit or loss on disposal or termination is calculated after charging the amount of any related goodwill to the extent that it has not previously been taken to the income statement. Intra-group balances, and any unrealised gains and losses or income and expenses arising from intra-group transactions, are eliminated in preparing the consolidated financial statements. Unrealised losses are eliminated unless the transaction provides evidence of an impairment of the asset transferred. Some of the company’s subsidiaries have a local statutory balance sheet date of 31 December. These are consolidated using management prepared information on a basis coterminous with the company’s balance sheet date. (ii) Associates Associates are entities in which the group has a long-term interest and over which the group has directly or indirectly significant influence, where significant influence is the ability to influence the financial and operating policies of the entity. The associate, Distell Group Ltd, has a statutory balance sheet date of 30 June. In respect of each year ending 31 March, this company is included based on financial statements drawn up to the previous 31 December, but taking into account any changes in the subsequent period from 1 January to 31 March that would materially affect the results. All other associates are included on a coterminous basis. (iii) Joint ventures The group has assessed the nature of its joint arrangements and determined them to be joint ventures. Joint ventures are contractual arrangements which the group has entered into with one or more parties to undertake an economic activity that is subject to joint control. Joint control is the contractually agreed sharing of control over an economic activity, and exists only when decisions relating to the relevant activities require the unanimous consent of the parties sharing the control. The group’s share of the recognised income and expenses of associates and joint ventures is accounted for using the equity method from the date significant influence or joint control commences to the date it ceases based on present ownership interests. The group recognises its share of associates’ and joint ventures’ post-tax results as a one line entry before profit before taxation in the income statement and its share of associates’ and joint ventures’ equity movements as one line entries under each of items of other comprehensive income that will not be reclassified to profit or loss, and items of other comprehensive income that may be reclassified to profit or loss, in the statement of comprehensive income. When the group’s interest in an associate or joint venture has been reduced to nil because the group’s share of losses exceeds its interest in the associate or joint venture, the group only provides for additional losses to the extent that it has incurred legal or constructive obligations to fund such losses, or make payments on behalf of the associate or joint venture. Where the investment in an associate or joint venture is disposed, the investment ceases to be equity accounted. (iv) Transactions with non-controlling interests Transactions with non-controlling interests are treated as transactions with equity owners of the group. For purchases from non-controlling interests, the difference between any consideration paid and the relevant share acquired of the carrying value of net assets of the subsidiary is recorded in equity. Gains or losses on disposals to non-controlling interests are also recorded in equity where there is no loss of control. 1. Accounting policies continued 109SABMiller plc Annual Report 2016 FINANCIALSTATEMENTS
  • 114.
    FINANCIAL STATEMENTS (v) Reductionin interests When the group ceases to have control, joint control or significant influence, any retained interest in the entity is remeasured to its fair value, with the change in carrying amount recognised in profit or loss. The fair value is the initial carrying amount for the purposes of subsequently accounting for the retained interest as an associate, joint venture or financial asset. In addition, certain amounts previously recognised in other comprehensive income in respect of that entity are accounted for as if the group had directly disposed of the related assets or liabilities. This may mean that certain amounts previously recognised in other comprehensive income are reclassified to profit or loss. If the ownership interest in an associate is reduced but significant influence is retained, or if the ownership interest in a joint venture is reduced but joint control is retained, only the proportionate share of the carrying amount of the investment and of the amounts previously recognised in other comprehensive income are reclassified to profit or loss where appropriate. f) Foreign exchange (i) Foreign exchange translation Items included in the financial statements of each of the group’s entities are measured using the currency of the primary economic environment in which the entity operates (the functional currency). The consolidated financial statements are presented in US dollars which is the group’s presentational currency. The key exchange rates to the US dollar used in preparing the consolidated financial statements were as follows. Year ended 31 March 2016 Year ended 31 March 2015 Average rate Australian dollar (AUD) 1.36 1.15 Colombian peso (COP) 2,922 2,097 Czech koruna (CZK) 24.66 21.56 Euro (€) 0.90 0.78 Peruvian nuevo sol (PEN) 3.29 2.90 Polish zloty (PLN) 3.81 3.26 South African rand (ZAR) 13.78 11.08 Turkish lira (TRY) 2.81 2.22 Closing rate Australian dollar (AUD) 1.31 1.31 Colombian peso (COP) 3,022 2,576 Czech koruna (CZK) 23.76 25.59 Euro (€) 0.88 0.93 Peruvian nuevo sol (PEN) 3.31 3.10 Polish zloty (PLN) 3.73 3.80 South African rand (ZAR) 14.77 12.13 Turkish lira (TRY) 2.82 2.60 The average exchange rates have been calculated based on the average of the exchange rates during the relevant year which have been weighted according to the phasing of revenue of the group’s businesses. (ii) Transactions and balances The financial statements for each group company have been prepared on the basis that transactions in foreign currencies are recorded in their functional currency at the rate of exchange ruling at the date of the transaction. Monetary items denominated in foreign currencies are retranslated at the rate of exchange ruling at the balance sheet date with the resultant translation differences being included in operating profit in the income statement other than those arising on financial assets and liabilities which are recorded within net finance costs and those which are deferred in equity as qualifying cash flow hedges and qualifying net investment hedges. Translation differences on non-monetary assets such as equity investments classified as available for sale assets are included in other comprehensive income. (iii) Overseas subsidiaries, associates and joint ventures One-off items in the income and cash flow statements of overseas subsidiaries, associates and joint ventures expressed in currencies other than the US dollar are translated to US dollars at the rates of exchange prevailing on the day of the transaction. All other items are translated at weighted average rates of exchange for the relevant reporting period. Assets and liabilities of these undertakings are translated at closing rates of exchange at each balance sheet date. All translation exchange differences arising on the retranslation of opening net assets together with differences between income statements translated at average and closing rates are recognised as a separate component of equity. For these purposes net assets include loans between group companies that form part of the net investment, for which settlement is neither planned nor likely to occur in the foreseeable future. When a foreign operation is disposed of, any related exchange differences in equity are reclassified to the income statement as part of the gain or loss on disposal. Goodwill and fair value adjustments arising on the acquisition of a foreign entity are treated as assets and liabilities of the foreign entity and translated at the closing rate. (iv) Hyperinflationary economies In hyperinflationary economies, when translating the results of operations into US dollars, adjustments are made to local currency denominated non-monetary assets, liabilities, income statement and equity accounts to reflect the changes in purchasing power. South Sudan was considered to be a hyperinflationary economy in the year ended 31 March 2016. The effect of inflation accounting in South Sudan for the year ended 31 March 2016 was not material. g) Business combinations (i) Subsidiaries The acquisition method is used to account for business combinations. The identifiable net assets (including intangibles) are incorporated into the financial statements on the basis of their fair value from the effective date of control, and the results of subsidiary undertakings acquired during the financial year are included in the group’s results from that date. On the acquisition of a company or business, fair values reflecting conditions at the date of acquisition are attributed to the identifiable assets (including intangibles), liabilities and contingent liabilities acquired. Fair values of these assets and liabilities are determined by reference to market values, where available, or by reference to the current price at which similar assets could be acquired or similar obligations entered into, or by discounting expected future cash flows to present value, using either market rates or the risk-free rates and risk-adjusted expected future cash flows. The consideration transferred is measured as the fair value of the assets given, equity instruments issued and liabilities incurred or assumed at the date of the acquisition, and also includes the group’s estimate of the fair value of any deferred consideration payable. Acquisition-related costs are expensed as incurred. Where the business combination is achieved in stages and results in a change in control, the acquisition date fair value of the acquirer’s previously held equity interest in the acquiree is remeasured to fair value at the acquisition date through profit or loss. Where the business combination agreement provides for an adjustment to the cost that is contingent on future events, the consideration transferred includes the fair value of any asset or liability resulting from a contingent consideration arrangement. On an acquisition by acquisition basis, the group recognises any non-controlling interest in the acquiree either at fair value or at the non-controlling interest’s proportionate share of the acquiree’s net assets. 1. Accounting policies continued Notes to the consolidated financial statements continued 110 SABMiller plc Annual Report 2016
  • 115.
    (ii) Associates andjoint ventures On acquisition the investment in associates and joint ventures is recorded initially at cost. Subsequently, the carrying amount is increased or decreased to recognise the group’s share of the associates’ and joint ventures’ income and expenses after the date of acquisition less any impairment losses. Fair values reflecting conditions at the date of acquisition are attributed to the group’s share of identifiable assets (including intangibles), liabilities and contingent liabilities acquired. The consideration transferred is measured as the fair value of the assets given, equity instruments issued and liabilities incurred or assumed at the date of the acquisition, and also includes the group’s estimate of the fair value of any deferred consideration payable. The date significant influence or joint control commences is not necessarily the same as the closing date or any other date named in the contract. (iii) Goodwill Goodwill arising on consolidation represents the excess of the consideration transferred, the amount of any non-controlling interest in the acquiree and the acquisition-date fair value of any previous equity interest in the acquiree over the fair value of the identifiable assets (including intangibles), liabilities and contingent liabilities of the acquired entity at the date of acquisition. Where the fair value of the group’s share of identifiable net assets acquired exceeds the fair value of the consideration, the difference is recognised immediately in the income statement. Goodwill is stated at cost less impairment losses and is reviewed for impairment on an annual basis. Any impairment identified is recognised immediately in the income statement and is not reversed. The carrying amount of goodwill in respect of associates and joint ventures is included in the carrying value of the investment in the associate or joint venture. h) Intangible assets Intangible assets are stated at cost less accumulated amortisation on a straight-line basis (if applicable) and impairment losses. Cost is usually determined as the amount paid by the group, unless the asset has been acquired as part of a business combination. Intangible assets acquired as part of a business combination are recognised at their fair value at the date of acquisition. Amortisation is included within net operating expenses in the income statement. Internally generated intangibles are not recognised except for computer software and applied development costs referred to under computer software and research and development below. Intangible assets with finite lives are amortised over their estimated useful economic lives, and only tested for impairment where there is a triggering event. The group regularly reviews all of its amortisation rates and residual values to take account of any changes in circumstances. The directors’ assessment of the useful life of intangible assets is based on the nature of the asset acquired, the durability of the products to which the asset attaches and the expected future impact of competition on the business. (i) Brands Brands are recognised as an intangible asset where the brand has a long-term value. Acquired brands are only recognised where title is clear or the brand could be sold separately from the rest of the business and the earnings attributable to it are separately identifiable. Acquired brands are amortised. In respect of brands currently held the amortisation period is 10 to 40 years, being the period for which the group has exclusive rights to those brands, up to a maximum of 40 years. (ii) Contract brewing and other licences recognised as part of a business combination Contractual arrangements for contract brewing and competitor licensing arrangements are recognised as an intangible asset at a fair value representing the remaining contractual period with an assumption about the expectation that such a contract will be renewed, together with a valuation of this extension. Acquired licences or contracts are amortised. In respect of licences or contracts currently held, the amortisation period is the period for which the group has exclusive rights to these assets or income streams. (iii) Customer lists and distributor relationships recognised as part of a business combination The fair value of businesses acquired may include customer lists and distributor relationships. These are recognised as intangible assets and are calculated by discounting the future revenue stream attributable to these lists or relationships. Acquired customer lists or distributor relationships are amortised. In respect of contracts currently held, the amortisation period is the period for which the group has the benefit of these assets. (iv) Computer software Where computer software is not an integral part of a related item of property, plant and equipment, the software is capitalised as an intangible asset. Acquired computer software licences are capitalised on the basis of the costs incurred to acquire and bring them to use. Direct costs associated with the production of identifiable and unique internally generated software controlled by the group that will probably generate economic benefits exceeding costs beyond one year are capitalised. Direct costs include software development employment costs (including those of contractors used), capitalised interest and an appropriate portion of overheads. Capitalised computer software, licence and development costs are amortised over their useful economic lives of between three and eight years. Internally generated costs associated with maintaining computer software programmes are expensed as incurred. (v) Research and development Research and general development expenditure is written off in the period in which it is incurred. Certain applied development costs are only capitalised as internally generated intangible assets where there is a clearly defined project, separately identifiable expenditure, an outcome assessed with reasonable certainty (in terms of feasibility and commerciality), expected revenues exceed expected costs and the group has the resources to complete the task. Such assets are amortised on a straight-line basis over their useful lives once the project is complete. i) Property, plant and equipment Property, plant and equipment are stated at cost net of accumulated depreciation and any impairment losses. Cost includes expenditure that is directly attributable to the acquisition of the assets. Subsequent costs are included in the asset’s carrying value or recognised as a separate asset as appropriate, only when it is probable that future economic benefits associated with the specific asset will flow to the group and the cost can be measured reliably. Repairs and maintenance costs are charged to the income statement during the financial period in which they are incurred. (i) Assets in the course of construction Assets in the course of construction are carried at cost less any impairment loss. Cost includes professional fees and for qualifying assets certain borrowing costs as determined below. When these assets are ready for their intended use, they are transferred into the appropriate category. At this point, depreciation commences on the same basis as on other property, plant and equipment. 1. Accounting policies continued 111SABMiller plc Annual Report 2016 FINANCIALSTATEMENTS
  • 116.
    FINANCIAL STATEMENTS (ii) Assetsheld under finance leases Assets held under finance leases which result in the group bearing substantially all the risks and rewards incidental to ownership are capitalised as property, plant and equipment. Finance lease assets are initially recognised at an amount equal to the lower of their fair value and the present value of the minimum lease payments at inception of the lease, then depreciated over the lower of the lease term or their useful lives. The capital element of future obligations under the leases is included as a liability in the balance sheet classified, as appropriate, as a current or non-current liability. The interest element of the lease obligations is charged to the income statement over the period of the lease term to reflect a constant rate of interest on the remaining balance of the obligation for each financial period. (iii) Returnable containers Returnable containers in circulation are recorded within property, plant and equipment at cost net of accumulated depreciation less any impairment loss. Depreciation of returnable bottles and containers is recorded to write the containers off over the course of their economic life. This is typically undertaken in a two stage process: − the excess over deposit value is written down over a period of one to 10 years. – provisions are made against the deposit values for breakages and losses in the trade together with a design obsolescence provision held to write off the deposit value over the expected container design period – which is a period of no more than 14 years from the inception of a container design. This period is shortened where appropriate by reference to market dynamics and the ability of the entity to use containers for different brands. (iv) Depreciation No depreciation is provided on freehold land or assets in the course of construction. In respect of all other property, plant and equipment, depreciation is provided on a straight-line basis at rates calculated to write off the cost, less the estimated residual value, of each asset over its expected useful life as follows. Freehold buildings 20 – 50 years Leasehold buildings Shorter of the lease term or 50 years Plant, vehicles and systems 2 – 30 years Returnable containers (non-returnable 1 – 14 years containers are recorded as inventory) Assets held under finance leases Lower of the lease term or life of the asset The group regularly reviews all of its depreciation rates and residual values to take account of any changes in circumstances. When setting useful economic lives, the principal factors the group takes into account are the expected rate of technological developments, expected market requirements for the equipment and the intensity at which the assets are expected to be used. The profit or loss on the disposal of an asset is the difference between the disposal proceeds and the net book amount. (v) Capitalisation of borrowing costs Financing costs incurred, before tax, on major capital projects during the period of development or construction that necessarily take a substantial period of time to be developed for their intended use, are capitalised up to the time of completion of the project. j) Advance payments made to customers (principally hotels, restaurants, bars and clubs) Advance payments made to customers are conditional on the achievement of contracted sales targets or marketing commitments. The group records such payments as prepayments initially at fair value and amortises them in the income statement over the relevant period to which the customer commitment is made (typically three to five years). These prepayments are recorded net of any impairment losses. Where there is a volume target the amortisation of the advance is included in sales discounts as a reduction to revenue and where there are specific marketing activities/commitments the amortisation is included as an operating expense. The amounts capitalised are reassessed annually for achievement of targets and are impaired where there is objective evidence that the targets will not be achieved. Assets held at customer premises are included within property, plant and equipment and are depreciated in line with group policies on similar assets. k) Inventories Inventories are stated at the lower of cost incurred in bringing each product to its present location and condition, and net realisable value, as follows. − raw materials, consumables and goods for resale: Purchase cost net of discounts and rebates on a first-in first-out basis (FIFO). – finished goods and work in progress: Raw material cost plus direct costs and a proportion of manufacturing overhead expenses on a FIFO basis. Net realisable value is based on estimated selling price less further costs expected to be incurred to completion and disposal. Costs of inventories include the transfer from equity of any gains or losses on matured qualifying cash flow hedges of purchases of raw materials. l) Financial assets and financial liabilities Financial assets and financial liabilities are initially recorded at fair value (plus any directly attributable transaction costs, except in the case of those classified at fair value through profit or loss). For those financial instruments that are not subsequently held at fair value, the group assesses whether there is any objective evidence of impairment at each balance sheet date. Financial assets are recognised when the group has rights or other access to economic benefits. Such assets consist of cash, equity instruments, a contractual right to receive cash or another financial asset, or a contractual right to exchange financial instruments with another entity on potentially favourable terms. Financial assets are derecognised when the right to receive cash flows from the asset have expired or have been transferred and the group has transferred substantially all risks and rewards of ownership. Financial liabilities are recognised when there is an obligation to transfer benefits and that obligation is a contractual liability to deliver cash or another financial asset or to exchange financial instruments with another entity on potentially unfavourable terms. Financial liabilities are derecognised when they are extinguished, that is discharged, cancelled or expired. If a legally enforceable right exists to set off recognised amounts of financial assets and liabilities, which are in determinable monetary amounts, and there is the intention to settle net, the relevant financial assets and liabilities are offset. Interest costs are charged to the income statement in the year in which they accrue. Premiums or discounts arising from the difference between the net proceeds of financial instruments purchased or issued and the amounts receivable or repayable at maturity are included in the effective interest calculation and taken to net finance costs over the life of the instrument. 1. Accounting policies continued Notes to the consolidated financial statements continued 112 SABMiller plc Annual Report 2016
  • 117.
    There are fourcategories of financial assets and financial liabilities. These are described as follows. (i) Financial assets and financial liabilities at fair value through profit or loss Financial assets and financial liabilities at fair value through profit or loss include derivative assets and derivative liabilities not designated as effective hedging instruments. All gains or losses arising from changes in the fair value of financial assets or financial liabilities within this category are recognised in the income statement. a. Derivative financial assets and financial liabilities Derivative financial assets and financial liabilities are financial instruments the value of which changes in response to an underlying variable, require little or no initial investment and are settled in the future. These include derivatives embedded in host contracts. Such embedded derivatives need not be accounted for separately if the host contract is already fair valued; if it is not considered as a derivative if it was freestanding; or if it can be demonstrated that it is closely related to the host contract. There are certain currency exemptions which the group has applied to these rules which limit the need to account for certain potential embedded foreign exchange derivatives. These are: if a contract is denominated in the functional currency of either party; where that currency is commonly used in international trade of the good traded; or if it is commonly used for local transactions in an economic environment. Derivative financial assets and liabilities are analysed between current and non-current assets and liabilities on the face of the balance sheet, depending on when they are expected to mature. For derivatives that have not been designated to a hedging relationship, all fair value movements are recognised immediately in the income statement. (See note x for the group’s accounting policy on hedge accounting). (ii) Loans and receivables Loans and receivables are non-derivative financial assets with fixed or determinable payments that are not quoted on an active market. They arise when the group provides money, goods or services directly to a debtor with no intention of trading the receivable. They are included in current assets, except for maturities of greater than 12 months after the balance sheet date which are classified as non-current assets. Loans and receivables are initially recognised at fair value including originating fees and transaction costs, and subsequently measured at amortised cost using the effective interest method less provision for impairment. Loans and receivables include trade receivables, amounts owed by associates, amounts owed by joint ventures, accrued income and cash and cash equivalents. a. Trade receivables Trade receivables are initially recognised at fair value and subsequently measured at amortised cost less provision for impairment. A provision for impairment of trade receivables is established when there is objective evidence that the group will not be able to collect all amounts due according to the terms of the receivables. The amount of the provision is the difference between the asset’s carrying value and the present value of the estimated future cash flows discounted at the original effective interest rate. This provision is recognised in the income statement. b. Cash and cash equivalents In the consolidated balance sheet, cash and cash equivalents includes cash in hand, bank deposits repayable on demand and other short-term highly liquid investments with original maturities of three months or less. In the consolidated cash flow statement, cash and cash equivalents also includes bank overdrafts which are shown within borrowings in current liabilities on the balance sheet. (iii) Available for sale investments Available for sale investments are non-derivative financial assets that are either designated in this category or not classified as financial assets at fair value through profit or loss, or loans and receivables. Investments in this category are included in non-current assets unless management intends to dispose of the investment within 12 months of the balance sheet date. They are initially recognised at fair value plus transaction costs and are subsequently remeasured at fair value and tested for impairment. Gains and losses arising from changes in fair value including any related foreign exchange movements are recognised in other comprehensive income. On disposal or impairment of available for sale investments, any gains or losses in other comprehensive income are reclassified to the income statement. Purchases and sales of investments are recognised on the date on which the group commits to purchase or sell the asset. Investments are derecognised when the rights to receive cash flows from the investments have expired or have been transferred and the group has transferred substantially all risks and rewards of ownership. (iv) Financial liabilities held at amortised cost Financial liabilities held at amortised cost include trade payables, accruals, amounts owed to associates, amounts owed to joint ventures, other payables and borrowings. a. Trade payables Trade payables are initially recognised at fair value and subsequently measured at amortised cost using the effective interest method. Trade payables are analysed between current and non-current liabilities on the face of the balance sheet, depending on when the obligation to settle will be realised. b. Borrowings Borrowings are recognised initially at fair value, net of transaction costs, and are subsequently stated at amortised cost and include accrued interest and prepaid interest. Borrowings are classified as current liabilities unless the group has an unconditional right to defer settlement of the liability for at least 12 months from the balance sheet date. Borrowings classified as hedged items are subject to hedge accounting requirements (see note x). Bank overdrafts are shown within borrowings in current liabilities and are included within cash and cash equivalents on the face of the cash flow statement as they form an integral part of the group’s cash management. m) Impairment This policy covers all assets except inventories (see note k), financial assets (see note l), non-current assets classified as held for sale (see note n), and deferred tax assets (see note u). Impairment reviews are performed by comparing the carrying value of the non-current asset with its recoverable amount, being the higher of the fair value less costs of disposal and value in use. The fair value less costs of disposal is considered to be the amount that could be obtained on disposal of the asset, and therefore is determined from a market participant perspective. The recoverable amount under both calculations is determined by discounting the future post-tax cash flows generated from continuing use of the cash generating unit (CGU) using a post-tax discount rate. For value in use, this closely approximates applying pre-tax discount rates to pre-tax cash flows. Where a potential impairment is identified using post-tax cash flows and post-tax discount rates, the impairment review is reperformed on a pre-tax basis in order to determine the impairment loss to be recorded. Fair value less costs of disposal calculations are prepared on a post-tax basis, and are classified as level 3 in the fair value hierarchy. Where the asset does not generate cash flows that are independent from the cash flows of other assets, the group estimates the recoverable amount of the CGU to which the asset belongs. For the purpose of conducting impairment reviews, CGUs are considered to be groups of assets that have separately identifiable cash flows. They also include those assets and liabilities directly involved in producing the income 1. Accounting policies continued 113SABMiller plc Annual Report 2016 FINANCIALSTATEMENTS
  • 118.
    FINANCIAL STATEMENTS Notes tothe consolidated financial statements continued and a suitable proportion of those used to produce more than one income stream. An impairment loss is taken first against any specifically impaired assets. Where an impairment is recognised against a CGU, the impairment is first taken against goodwill balances and if there is a remaining loss it is set against the remaining intangible and tangible assets on a pro-rata basis. Should circumstances or events change and give rise to a reversal of a previous impairment loss, the reversal is recognised in the income statement in the period in which it occurs and the carrying value of the asset is increased. The increase in the carrying value of the asset is restricted to the amount that it would have been had the original impairment not occurred. Impairment losses in respect of goodwill are irreversible. Goodwill is tested annually for impairment. Assets subject to amortisation or depreciation are reviewed for impairment if circumstances or events change to indicate that the carrying value may not be fully recoverable. n) Non-current assets (or disposal groups) held for sale Non-current assets and all assets and liabilities classified as held for sale are measured at the lower of carrying value and fair value less costs of disposal. Such assets are classified as held for sale if their carrying amount will be recovered through a sale transaction rather than through continued use. This condition is regarded as met only when a sale is highly probable, the asset or disposal group is available for immediate sale in its present condition and when management is committed to the sale which is expected to qualify for recognition as a completed sale within one year from date of classification. o) Provisions Provisions are recognised when there is a present obligation, whether legal or constructive, as a result of a past event for which it is probable that a transfer of economic benefits will be required to settle the obligation and a reliable estimate can be made of the amount of the obligation. Such provisions are calculated on a discounted basis where the effect is material to the original undiscounted provision. The carrying amount of the provision increases in each period to reflect the passage of time and the unwinding of the discount and the movement is recognised in the income statement within net finance costs. Restructuring provisions comprise lease termination penalties and employee termination payments. Provisions are not recognised for future operating losses. Provisions are recognised for onerous contracts where the unavoidable cost exceeds the expected benefit. p) Share capital Ordinary shares are classified as equity. Incremental costs directly attributable to the issue of new shares or options are shown in equity as a deduction, net of tax, from the proceeds. q)Investments in own shares (treasury and shares held by employee benefit trusts) Shares held by employee share ownership plans, employee benefit trusts and in treasury are treated as a deduction from equity until the shares are cancelled, reissued, or disposed. Purchases of such shares are classified in the cash flow statement as a purchase of own shares for share trusts or purchase of own shares for treasury within net cash from financing activities. Where such shares are subsequently sold or reissued, any consideration received, net of any directly attributable incremental costs and related tax effects, is included in equity attributable to the company’s equity shareholders. r) Revenue recognition (i) Sale of goods and services Revenue represents the fair value of consideration received or receivable for goods and services provided to third parties and is recognised when the risks and rewards of ownership are substantially transferred. The group presents revenue gross of excise duties because unlike value added tax, excise is not directly related to the value of sales. It is not generally recognised as a separate item on invoices, increases in excise are not always directly passed on to customers, and the group cannot reclaim the excise where customers do not pay for product received. The group therefore considers excise as a cost to the group and reflects it as a production cost. Consequently, any excise that is recovered in the sale price is included in revenue. Revenue excludes value added tax. It is stated net of price discounts, promotional discounts, settlement discounts and after an appropriate amount has been provided to cover the sales value of credit notes yet to be issued that relate to the current and prior periods. The same recognition criteria also apply to the sale of by-products and waste (such as spent grain, malt dust and yeast) with the exception that these are included within other income. (ii) Interest income Interest income is recognised on an accruals basis using the effective interest method. When a receivable is impaired the group reduces the carrying amount to its recoverable amount by discounting the estimated future cash flows at the original effective interest rate, and continuing to unwind the discount as interest income. (iii) Royalty income Royalty income is recognised on an accruals basis in accordance with the relevant agreements and is included in other income. (iv) Dividend income Dividend income is recognised when the right to receive payment is established. s) Operating leases Rentals paid and incentives received on operating leases are charged or credited to the income statement on a straight-line basis over the lease term. t) Exceptional items Where certain expense or income items recorded in a period are material by their size or incidence, the group reflects such items as exceptional items within a separate line on the income statement except for those exceptional items that relate to associates, joint ventures, net finance costs and tax. (Associates’ and joint ventures’ net finance costs and tax exceptional items are only referred to in the notes to the consolidated financial statements). Exceptional items are also summarised in the segmental analyses, excluding those that relate to net finance costs and tax. The group presents alternative earnings per share calculations on a headline and adjusted basis. The adjusted earnings per share figure excludes the impact of amortisation of intangible assets (excluding computer software), certain non-recurring items and post-tax exceptional items in order to present an additional measure of performance for the years shown in the consolidated financial statements. Headline earnings per share is calculated in accordance with the South African Circular 2/2015 entitled ‘Headline Earnings’ which forms part of the listing requirements for the JSE Ltd (JSE). u) Taxation The tax expense for the period comprises current and deferred tax. Tax is recognised in the income statement, except to the extent that it relates to items recognised in other comprehensive income or directly in equity, in which case it is recognised in other comprehensive income or directly in equity, respectively. 1. Accounting policies continued 114 SABMiller plc Annual Report 2016
  • 119.
    Current tax expenseis based on the results for the period as adjusted for items that are not taxable or not deductible. The group’s liability for current taxation is calculated using tax rates and laws that have been enacted or substantively enacted by the balance sheet date. Deferred tax is provided in full using the liability method, in respect of all temporary differences arising between the tax bases of assets and liabilities and their carrying values in the consolidated financial statements, except where the temporary difference arises from goodwill (in the case of deferred tax liabilities) or from the initial recognition (other than a business combination) of other assets and liabilities in a transaction that affects neither accounting nor taxable profit. Deferred tax liabilities are recognised where the carrying value of an asset is greater than its tax base, or where the carrying value of a liability is less than its tax base. Deferred tax is recognised in full on temporary differences arising from investment in subsidiaries, associates and joint ventures, except where the timing of the reversal of the temporary difference is controlled by the group and it is probable that the temporary difference will not reverse in the foreseeable future. This includes taxation in respect of the retained earnings of overseas subsidiaries only to the extent that, at the balance sheet date, dividends have been accrued as receivable or a binding agreement to distribute past earnings in future periods has been entered into by the subsidiary. Deferred income tax is also recognised in respect of the unremitted retained earnings of overseas associates and joint ventures as the group is not able to determine when such earnings will be remitted and when such additional tax such as withholding taxes might be payable. A net deferred tax asset is regarded as recoverable and therefore recognised only when, on the basis of all available evidence, it is expected that sufficient existing taxable temporary differences will reverse in the future or there will be sufficient taxable profit available against which the temporary differences (including carried forward tax losses) can be utilised. Deferred tax is measured at the tax rates expected to apply in the periods in which the timing differences are expected to reverse based on tax rates and laws that have been enacted or substantively enacted at balance sheet date. Deferred tax is measured on a non-discounted basis. v) Dividend distributions Dividend distributions to equity holders of the parent are recognised as a liability in the group’s financial statements in the period in which the dividends are approved by the company’s shareholders. Interim dividends are recognised when paid. Dividends declared after the balance sheet date are not recognised, as there is no present obligation at the balance sheet date. w) Employee benefits (i) Wages and salaries Wages and salaries for current employees are recognised in the income statement as the employees’ services are rendered. (ii) Vacation and long-term service awards costs The group recognises a liability and an expense for accrued vacation pay when such benefits are earned and not when these benefits are paid. The group also recognises a liability and an expense for long-term service awards where cash is paid to the employee at certain milestone dates in a career with the group. Such accruals are appropriately discounted to reflect the future payment dates at discount rates determined by reference to local high-quality corporate bonds. (iii) Profit-sharing and bonus plans The group recognises a liability and an expense for bonuses and profit-sharing, based on a formula that takes into consideration the profit attributable to the company’s shareholders after certain adjustments. The group recognises a provision where contractually obliged or where there is a past practice that has created a constructive obligation. At a mid-year point an accrual is maintained for the appropriate proportion of the expected bonuses which would become payable at the year end. (iv) Share-based compensation The group operates a variety of equity-settled share-based compensation plans. The equity-settled plans comprise share option and stock appreciation rights plans (with and without market performance conditions attached), performance share award plans (with and without market performance conditions attached) and awards related to the employee element of the Broad-Based Black Economic Empowerment (BBBEE) scheme in South Africa. An expense is recognised to spread the fair value of each award over the vesting period on a straight-line basis, after considering an estimate of the share awards that will eventually vest. A corresponding adjustment is made to equity over the remaining vesting period. The estimate of the level of vesting is reviewed at least annually, with any impact on the cumulative charge being recognised immediately. In addition the group has granted an equity-settled share-based payment to retailers in relation to the retailer element of the BBBEE scheme. A one-off charge has been recognised based on the fair value at the grant date with a corresponding adjustment to equity. The charge will not be adjusted in the future. The charges are based on the fair value of the awards as at the date of grant, as calculated by various binomial model calculations and Monte Carlo simulations. The charges are not reversed if the options and awards are not exercised because the market value of the shares is lower than the option price at the date of grant. The proceeds received net of any directly attributable transaction costs are credited to share capital (nominal value) and share premium when the options are exercised. (v) Pension obligations The group has both defined benefit and defined contribution plans. The liability recognised in the balance sheet in respect of defined benefit pension plans is the present value of the defined benefit obligation at the balance sheet date less the fair value of plan assets. The defined benefit obligation is calculated annually by independent actuaries using the projected unit credit method. The present value of the defined benefit obligation is determined by discounting the estimated future cash outflows using interest rates of high-quality corporate bonds that are denominated in the currency in which the benefits will be paid, and that have terms to maturity approximating to the terms of the related pension liability. Actuarial gains and losses arising from experience adjustments and changes in actuarial assumptions are recognised in full as they arise and are charged or credited to equity in other comprehensive income in the period in which they arise. The current service cost, the net interest cost, any past service costs, and the effect of any curtailments and settlements are recognised in operating costs in the income statement. The contributions to defined contribution plans are recognised as an expense as the costs become payable. The contributions are recognised as employee benefit expense when they are due. Prepaid contributions are recognised as an asset to the extent that a cash refund or a reduction in the future payments is available. (vi) Other post-employment obligations Some group companies provide post-retirement healthcare benefits to qualifying employees. The expected costs of these benefits are assessed in accordance with the advice of qualified actuaries and contributions are made to the relevant funds over the expected service lives of the employees entitled to those funds. Actuarial gains and losses 1. Accounting policies continued 115SABMiller plc Annual Report 2016 FINANCIALSTATEMENTS
  • 120.
    FINANCIAL STATEMENTS Notes tothe consolidated financial statements continued arising from experience adjustments, and changes in actuarial assumptions are recognised in full as they arise and are charged or credited to equity in other comprehensive income in the period in which they arise. These obligations are valued annually by independent qualified actuaries. (vii)Termination benefits Termination benefits are payable when employment is terminated before the normal retirement date, or whenever an employee accepts voluntary redundancy in exchange for these benefits. The group recognises termination benefits when it is demonstrably committed to terminating the employment of current employees according to a detailed formal plan without possibility of withdrawal, or providing termination benefits as a result of an offer made to encourage voluntary redundancy. Benefits falling due more than 12 months after balance sheet date are discounted to present value in a similar manner to all long-term employee benefits. x) Derivative financial instruments – hedge accounting Financial assets and financial liabilities at fair value through profit or loss include all derivative financial instruments. The derivative instruments used by the group, which are used solely for hedging purposes (i.e. to offset foreign exchange, commodity price and interest rate risks), comprise interest rate swaps, cross currency swaps, forward foreign exchange contracts, commodity contracts and other specific instruments as necessary under the approval of the board. Such derivative instruments are used to alter the risk profile of an existing underlying exposure of the group in line with the group’s risk management policies. The group also has derivatives embedded in other contracts, primarily cross border foreign currency supply contracts for raw materials. Derivatives are initially recorded at fair value on the date a derivative contract is entered into and are subsequently remeasured at their fair value. The method of recognising the resulting gain or loss depends on whether the derivative is designated as a hedging instrument, and, if so, the nature of the hedging relationship. In order to qualify for hedge accounting, the group is required to document at inception the relationship between the hedged item and the hedging instrument as well as its risk management objectives and strategy for undertaking hedging transactions. The group is also required to document and demonstrate that the relationship between the hedged item and the hedging instrument will be highly effective. This effectiveness test is reperformed at each period end to ensure that the hedge has remained and will continue to remain highly effective. The group designates certain derivatives as either: hedges of the fair value of recognised assets or liabilities or a firm commitment (fair value hedge); hedges of highly probable forecast transactions or commitments (cash flow hedge); or hedges of net investments in foreign operations (net investment hedge). (i) Fair value hedges Fair value hedges comprise derivative financial instruments designated in a hedging relationship to manage the group’s interest rate risk and foreign exchange risk to which the fair value of certain assets and liabilities are exposed. Changes in the fair value of the derivative offset the relevant changes in the fair value of the underlying hedged item attributable to the hedged risk in the income statement in the period incurred. Gains or losses on fair value hedges that are regarded as highly effective are recorded in the income statement together with the gain or loss on the hedged item attributable to the hedged risk. (ii) Cash flow hedges Cash flow hedges comprise derivative financial instruments designated in a hedging relationship to manage currency and interest rate risk to which the cash flows of certain assets and liabilities are exposed. The effective portion of changes in the fair value of the derivative that is designated and qualifies for hedge accounting is recognised in other comprehensive income. The ineffective portion is recognised immediately in the income statement. Amounts accumulated in equity are reclassified to the income statement in the period in which the hedged item affects profit or loss. However, where a forecasted transaction results in a non-financial asset or liability, the accumulated fair value movements previously deferred in equity are included in the initial cost of the asset or liability. (iii) Hedges of net investments in foreign operations Hedges of net investments in foreign operations comprise either foreign currency borrowings or derivatives (typically forward exchange contracts and cross currency swaps) designated in a hedging relationship. Gains or losses on hedging instruments that are regarded as highly effective are recognised in other comprehensive income. These largely offset foreign currency gains or losses arising on the translation of net investments that are recorded in equity, in the foreign currency translation reserve. The ineffective portion of gains or losses on hedging instruments is recognised immediately in the income statement. Amounts accumulated in equity are only reclassified to the income statement upon disposal of the net investment. Where a derivative ceases to meet the criteria of being a hedging instrument or the underlying exposure which it is hedging is sold, matures or is extinguished, hedge accounting is discontinued and amounts previously recorded in equity are reclassified to the income statement. A similar treatment is applied where the hedge is of a future transaction and that transaction is no longer likely to occur. When the hedge is discontinued due to ineffectiveness, hedge accounting is discontinued prospectively. Certain derivative instruments, while providing effective economic hedges under the group’s policies, are not designated as hedges. Changes in the fair value of any derivative instruments that do not qualify or have not been designated as hedges are recognised immediately in the income statement. The group does not hold or issue derivative financial instruments for speculative purposes. y) Deposits by customers Returnable containers in circulation are recorded within property, plant and equipment and a corresponding liability is recorded in respect of the obligation to repay the customers’ deposits. Deposits paid by customers for branded returnable containers are reflected in the balance sheet within current liabilities. Any estimated liability that may arise in respect of deposits for unbranded containers is shown in provisions. z) Earnings per share Basic earnings per share represents the profit on ordinary activities after taxation attributable to the equity shareholders of the parent entity, divided by the weighted average number of ordinary shares in issue during the year, less the weighted average number of ordinary shares held in the group’s employee benefit trusts and in treasury during the year. Diluted earnings per share represents the profit on ordinary activities after taxation attributable to the equity shareholders of the parent entity, divided by the weighted average number of ordinary shares in issue during the year, less the weighted average number of ordinary shares held in the group’s employee benefit trusts and in treasury during the year, plus the weighted average number of dilutive shares resulting from share options and other potential ordinary shares outstanding during the year. 1. Accounting policies continued 116 SABMiller plc Annual Report 2016
  • 121.
    2. Segmental analysis Operatingsegments reflect the management structure of the group and the way performance is evaluated and resources allocated based on group NPR and EBITA by the group’s chief operating decision maker, defined as the executive directors. The group is focused geographically and, while not meeting the definition of a reportable segment, the group reports Corporate (2015: Corporate and South Africa: Hotels and Gaming) as a separate segment as this provides useful additional information. The segmental information presented below includes the reconciliation of GAAP measures presented on the face of the income statement to non-GAAP measures which are used by management to analyse the group’s performance. Income statement Group NPR 2016 US$m EBITA 2016 US$m Group NPR 2015 US$m EBITA 2015 US$m Latin America 5,211 1,959 5,768 2,224 Africa 6,781 1,708 7,462 1,907 Asia Pacific 3,650 753 3,867 768 Europe 3,832 636 4,398 700 North America 4,675 865 4,682 858 Corporate – (111) – (122) Retained operations 24,149 5,810 26,177 6,335 South Africa: Hotels and Gaming – – 111 32 24,149 5,810 26,288 6,367 Amortisation of intangible assets (excluding computer software) – group and share of associates’ and joint ventures’ (350) (423) Exceptional items in operating profit – group and share of associates’ and joint ventures’ (657) (138) Net finance costs – group and share of associates’ and joint ventures’ (579) (740) Share of associates’ and joint ventures’ taxation (114) (157) Share of associates’ and joint ventures’ non-controlling interests (36) (79) Profit before taxation 4,074 4,830 Group revenue and group NPR (including the group’s share of associates and joint ventures) With the exception of South Africa: Hotels and Gaming, all reportable segments derive their revenues from the sale of beverages. Revenues are derived from a large number of customers which are internationally dispersed, with no customers being individually material. Revenue 2016 US$m Share of associates’ and joint ventures’ revenue 2016 US$m Group revenue 2016 US$m Excise duties and other similar taxes 2016 US$m Share of associates’ and joint ventures’ excise duties and other similar taxes 2016 US$m Group NPR 2016 US$m Latin America 7,018 – 7,018 (1,807) – 5,211 Africa 6,126 2,124 8,250 (1,160) (309) 6,781 Asia Pacific 2,793 2,180 4,973 (1,061) (262) 3,650 Europe 3,721 1,371 5,092 (906) (354) 3,832 North America 175 5,142 5,317 (4) (638) 4,675 19,833 10,817 30,650 (4,938) (1,563) 24,149 2015 US$m 2015 US$m 2015 US$m 2015 US$m 2015 US$m 2015 US$m Latin America 7,812 – 7,812 (2,044) – 5,768 Africa 6,853 2,221 9,074 (1,334) (278) 7,462 Asia Pacific 3,136 2,203 5,339 (1,203) (269) 3,867 Europe 4,186 1,675 5,861 (1,011) (452) 4,398 North America 143 5,201 5,344 (4) (658) 4,682 Retained operations 22,130 11,300 33,430 (5,596) (1,657) 26,177 South Africa: Hotels and Gaming – 128 128 – (17) 111 22,130 11,428 33,558 (5,596) (1,674) 26,288 117SABMiller plc Annual Report 2016 FINANCIALSTATEMENTS
  • 122.
    FINANCIAL STATEMENTS 2. Segmentalanalysis continued Operating profit and EBITA (segment result) The following table provides a reconciliation of operating profit to operating profit before exceptional items, and to EBITA. EBITA comprises operating profit before exceptional items, and amortisation of intangible assets (excluding computer software) and includes the group’s share of associates’ and joint ventures’ operating profit on a similar basis. Operating profit 2016 US$m Exceptional items 2016 US$m Operating profit before exceptional items 2016 US$m Share of associates’ and joint ventures’ operating profit before exceptional items 2016 US$m Amortisation of intangible assets (excluding computer software) 2016 US$m Share of associates’ and joint ventures’ amortisation of intangible assets (excluding computer software) 2016 US$m EBITA 2016 US$m Latin America 1,873 – 1,873 – 86 – 1,959 Africa 923 389 1,312 381 15 – 1,708 Asia Pacific 463 (29) 434 165 153 1 753 Europe 511 – 511 78 21 26 636 North America (9) – (9) 826 4 44 865 Corporate (307) 196 (111) – – – (111) 3,454 556 4,010 1,450 279 71 5,810 2015 US$m 2015 US$m 2015 US$m 2015 US$m 2015 US$m 2015 US$m 2015 US$m Latin America 2,110 – 2,110 – 114 – 2,224 Africa 1,516 (45) 1,471 427 9 – 1,907 Asia Pacific (14) 452 438 142 188 – 768 Europe 548 – 548 85 22 45 700 North America 14 – 14 800 2 42 858 Corporate (191) 69 (122) – – – (122) Retained operations 3,983 476 4,459 1,454 335 87 6,335 South Africa: Hotels and Gaming 401 (401) – 31 – 1 32 4,384 75 4,459 1,485 335 88 6,367 The group’s share of associates’ and joint ventures’ operating profit is reconciled to the share of post-tax results of associates and joint ventures in the income statement as follows. 2016 US$m 2015 US$m Share of associates’ and joint ventures’ operating profit (before exceptional items) 1,450 1,485 Share of associates’ and joint ventures’ exceptional items in operating profit (101) (63) Share of associates’ and joint ventures’ net finance costs (73) (103) Share of associates’ and joint ventures’ taxation (114) (157) Share of associates’ and joint ventures’ non-controlling interests (36) (79) Share of post-tax results of associates and joint ventures 1,126 1,083 EBITDA EBITA is reconciled to EBITDA as follows. EBITA 2016 US$m Depreciation 2016 US$m Share of associates’ and joint ventures’ depreciation 2016 US$m EBITDA 2016 US$m EBITA 2015 US$m Depreciation 2015 US$m Share of associates’ and joint ventures’ depreciation 2015 US$m EBITDA 2015 US$m Latin America 1,959 274 – 2,233 2,224 302 – 2,526 Africa 1,708 249 120 2,077 1,907 275 121 2,303 Asia Pacific 753 62 148 963 768 66 148 982 Europe 636 195 64 895 700 214 77 991 North America 865 – 139 1,004 858 – 145 1,003 Corporate (111) 36 – (75) (122) 39 – (83) Retained operations 5,810 816 471 7,097 6,335 896 491 7,722 South Africa: Hotels and Gaming – – – – 32 – 8 40 5,810 816 471 7,097 6,367 896 499 7,762 Notes to the consolidated financial statements continued 118 SABMiller plc Annual Report 2016
  • 123.
    2. Segmental analysiscontinued Adjusted EBITDA Adjusted EBITDA is comprised of the following. 2016 US$m 2015 US$m Subsidiaries’ EBITDA 5,105 5,690 – Operating profit before exceptional items 4,010 4,459 – Depreciation (including amortisation of computer software) 816 896 – Amortisation (excluding computer software) 279 335 Group’s share of MillerCoors’ EBITDA 1,009 987 – Operating profit before exceptional items 826 800 – Depreciation (including amortisation of computer software) 139 145 – Amortisation (excluding computer software) 44 42 Adjusted EBITDA 6,114 6,677 Other segmental information Capital expenditure excluding investment activity¹ 2016 US$m Investment activity² 2016 US$m Total 2016 US$m Capital expenditure excluding investment activity¹ 2015 US$m Investment activity² 2015 US$m Total 2015 US$m Latin America 439 – 439 429 (5) 424 Africa 547 4 551 720 8 728 Asia Pacific 85 – 85 80 – 80 Europe 201 191 392 253 – 253 North America – 301 301 15 216 231 Corporate 41 – 41 75 (972) (897) 1,313 496 1,809 1,572 (753) 819 ¹ Capital expenditure includes additions of intangible assets (excluding goodwill) and property, plant and equipment. ² Investment activity includes acquisitions and disposals of businesses, net investments in associates and joint ventures, purchases of shares in non-controlling interests and purchases and disposals of available for sale investments. Geographical information The UK is the parent company’s country of domicile. Those countries which account for more than 10% of the group’s total revenue and/or non-current assets are considered individually material and are reported separately below. Revenue 2016 US$m 2015 US$m UK 440 424 Australia 2,149 2,493 Colombia 2,844 3,568 Peru 2,025 2,145 South Africa 3,804 4,352 USA 165 131 Rest of world 8,406 9,017 19,833 22,130 Non-current assets 2016 US$m 2015 US$m UK 489 358 Australia 9,697 9,804 Colombia 4,990 5,886 Peru 2,896 3,094 South Africa 1,548 1,735 USA 5,781 5,704 Rest of world 12,909 13,038 38,310 39,619 Non-current assets by location exclude amounts relating to derivative financial instruments and deferred tax assets. 119SABMiller plc Annual Report 2016 FINANCIALSTATEMENTS
  • 124.
    FINANCIAL STATEMENTS 3. Netoperating expenses 2016 US$m 2015 US$m Cost of inventories recognised as an expense 4,177 4,552 – Changes in inventories of finished goods and work in progress 17 57 – Raw materials and consumables used 4,160 4,495 Excise duties and other similar taxes 4,938 5,596 Employee costs (see note 6a) 2,232 2,483 Depreciation of property, plant and equipment 743 821 – Containers 205 219 – Other 538 602 Profit on disposal of available for sale investments – (1) Profit on disposal of businesses – (45) Profit on disposal of investment in associates – (403) Gain on dilution of investment in associates – (2) Profit on disposal of property, plant and equipment (34) (18) Loss on disposal of intangible assets 2 – Amortisation of intangible assets 352 410 – Intangible assets (excluding computer software) 279 335 – Computer software 73 75 Other expenses 4,178 4,696 – Selling, marketing and distribution costs 2,132 2,428 – Repairs and maintenance expenditure on property, plant and equipment 266 309 – Impairment of investment in associate 372 – – Impairment of trade and other receivables 25 34 – Impairment of property, plant and equipment 7 73 – Impairment of goodwill – 286 – Impairment of intangible assets – 6 – Operating lease rentals – land and buildings 68 84 – Operating lease rentals – plant, vehicles and systems 67 88 – Transaction-related costs (excluding employee-related costs) 94 – – Research and development expenditure 4 5 – Other operating expenses 1,143 1,383 Total net operating expenses by nature 16,588 18,089 Other income (209) (343) – Revenue received from royalties (37) (47) – Dividends received from investments – (1) – Other operating income (172) (295) Net operating expenses 16,379 17,746 Foreign exchange differences recognised in the profit for the year, except for those arising on financial instruments measured at fair value under IAS 39, were a loss of US$34 million (2015: US$25 million). The following fees were paid to a number of different accounting firms as auditors of various parts of the group. 2016 US$m 2015 US$m Group auditors Fees payable to the company’s auditor and its associates for the audit of parent company and consolidated financial statements 3 3 Fees payable to the company’s auditor and its associates for other services: The audit of the company’s subsidiaries 7 8 Total audit fees payable to the company’s auditor 10 11 Taxation advisory services 1 1 Other non-audit services1 3 1 Total fees payable to the company’s auditor 14 13 Reimbursement by third party of fees payable to the company’s auditor (1) – Total fees payable by the group to the company’s auditor 13 13 Other audit firms Fees payable to other auditor firms for: The audit of the company’s subsidiaries 1 1 Taxation advisory services 3 3 Services relating to corporate finance transactions 1 1 Internal audit services 1 3 Other non-audit services Services relating to information technology2 2 1 Other2 6 21 Total fees payable to other audit firms 14 30 1 Principally relating to the AB InBev offer. 2 Consulting services principally relating to the cost and efficiency programme. Notes to the consolidated financial statements continued 120 SABMiller plc Annual Report 2016
  • 125.
    4. Exceptional items 2016 US$m 2015 US$m Exceptionalitems included in operating profit: Impairments1,2 (379) (313) Transaction costs (160) – Cost and efficiency programme costs (36) (69) Integration and restructuring costs 29 (139) Net foreign exchange losses2 (10) – Profit on disposal of investment in associate – 401 Profit on disposal of business – 45 Net exceptional losses included within operating profit (556) (75) Exceptional items included in net finance costs: Net foreign exchange losses2 (44) – Loan guarantee provision1 (20) – Early redemption costs – (48) Recycling of foreign currency translation reserves – 33 Net exceptional losses included within net finance costs (64) (15) Share of associates’ and joint ventures’ exceptional items: Profit on transaction in associate 86 – Impairments and related charges1 (119) (63) Restructuring costs (68) – Group’s share of associates’ and joint ventures’ exceptional losses (101) (63) Net taxation credits/(charges) relating to subsidiaries’ and the group’s share of associates’ and joint ventures’ exceptional items 28 (83) 1 Angola During 2016 the group incurred US$491 million of exceptional charges before finance costs relating to Angola including the US$372 million impairment of the group’s associate investment in Angola and the group’s US$119 million share of Castel’s impairment and related charges. Additionally the group has made a provision within finance costs in relation to loan guarantees in Angola of US$20 million. All the charges result from the operations being significantly scaled down following the significant devaluation of the local currency against the US dollar and the lack of availability of hard currency in Angola. 2 South Sudan During 2016 the group incurred US$17 million of exceptional charges before finance costs relating to South Sudan including the US$7 million impairment of property, plant and equipment and US$10 million of operating foreign exchange losses arising on the retranslation of net monetary liabilities. Additionally the group has incurred US$44 million of foreign exchange losses on net monetary liabilities within finance costs. All the charges result from the operation being significantly scaled down following the significant devaluation of the local currency against the US dollar and the lack of availability of hard currency in South Sudan. Impairments During 2015 an impairment charge of US$313 million was incurred in respect of the group’s Indian business in Asia Pacific. The impairment charge comprised US$286 million against goodwill, US$23 million against property, plant and equipment, and US$4 million against intangible assets. Transaction costs During 2016 the group incurred costs of US$160 million relating to the potential transaction with Anheuser-Busch InBev SA/NV, including advisers’ fees and staff-related costs. Cost and efficiency programme costs In 2016 costs of US$36 million (2015: US$69 million) were incurred in relation to the cost and efficiency programme. Integration and restructuring costs In 2016 a credit of US$29 million was realised relating to integration and restructuring in Australia, following the successful resolution of certain claims leading to the release of provisions. During 2015 US$139 million of integration and restructuring costs were incurred in Asia Pacific following the Foster’s and Pacific Beverages acquisitions, including impairments relating to brewery closures. Profit on disposal of investment in associate During 2015 a pre-tax profit of US$401 million, after associated costs, was realised on the disposal of the group’s interests in the Tsogo Sun hotels and gaming business in South Africa. Profit on disposal of business During 2015 an additional profit of US$45 million was realised in Africa in relation to the disposal in 2012 of the group’s Angolan operations in exchange for a 27.5% interest in BIH Angola, following the resolution of certain matters leading to the release of provisions. 121SABMiller plc Annual Report 2016 FINANCIALSTATEMENTS
  • 126.
    FINANCIAL STATEMENTS 4. Exceptionalitems continued Exceptional items included in net finance costs Early redemption costs During 2015 a US$48 million exceptional charge was incurred in relation to costs for the early redemption of the US$850 million 6.5% Notes that were due July 2016. Recycling of foreign currency translation reserve During 2015 a credit of US$33 million was recognised in relation to the recycling of foreign currency translation reserves following the repayment of an intercompany loan. Share of associates’ and joint ventures’ exceptional items Profit on transaction in associate In 2016 the group’s associate Castel recognised a gain arising on the change in control following the acquisition of further interests in its Tunisian operation. The group’s share of the gain amounted to US$86 million. Impairments During 2015 the group’s share of the impairment charges taken by Anadolu Efes in relation to its beer businesses in Russia and Ukraine amounted to US$63 million. Restructuring costs During 2016 MillerCoors announced the closure of the Eden brewery with full effect from September 2016. Restructuring costs, including accelerated depreciation and severance costs, have been incurred of which the group’s share amounted to US$68 million. Net taxation credits/(charges) relating to subsidiaries’ and the group’s share of associates’ and joint ventures’ exceptional items Net taxation credits of US$28 million (2015: charges of US$83 million) arose in relation to exceptional items during the year, and include US$25 million (2015: US$nil) in relation to MillerCoors although the tax credit is recognised in Miller Brewing Company (see note 7). 5. Net finance costs 2016 US$m 2015 US$m a. Finance costs Interest payable on bank loans and overdrafts 88 100 Interest payable on derivatives 132 177 Interest payable on corporate bonds 397 545 Interest element of finance lease payments 4 3 Net fair value losses on financial instruments 27 – Net exchange losses 15 120 Exceptional foreign exchange losses1 (see note 4) 44 – Exceptional loan guarantee provision1 (see note 4) 20 – Early redemption costs1 (see note 4) – 48 Other finance charges 36 54 Total finance costs 763 1,047 b. Finance income Interest receivable 16 19 Interest receivable on derivatives 234 282 Net fair value gains on financial instruments – 66 Recycling of foreign currency translation reserves1 (see note 4) – 33 Other finance income 7 10 Total finance income 257 410 Net finance costs 506 637 1 Net exceptional losses of US$64 million (2015: US$15 million) are excluded from the determination of adjusted net finance costs and adjusted earnings per share. Adjusted net finance costs were US$442 million (2015: US$622 million). Refer to note 21 – Financial risk factors for interest rate risk information. Notes to the consolidated financial statements continued 122 SABMiller plc Annual Report 2016
  • 127.
    6. Employee andkey management compensation costs a. Employee costs 2016 US$m 2015 US$m Wages and salaries 1,858 2,085 Share-based payments 90 117 Social security costs 175 164 Pension costs 107 117 Post-retirement benefits other than pensions 5 8 2,235 2,491 Of the US$2,235 million employee costs shown above, US$3 million (2015: US$8 million) has been capitalised within intangible assets and property, plant and equipment. b. Employee numbers The average monthly number of employees are shown on a full-time equivalent basis, excluding employees of associated and joint venture undertakings and including executive directors. 2016 Number 2015 Number Latin America 28,632 28,162 Africa 25,669 24,802 Asia Pacific 4,692 5,048 Europe 9,971 9,810 North America 186 124 Corporate 939 862 70,089 68,808 c. Key management compensation The directors of the group and members of the executive committee (excom) are defined as key management. At 31 March 2016 there were 23 (2015: 23) key management. 2016 US$m 2015 US$m Salaries and short-term employee benefits 28 29 Post-employment benefits 2 3 Share-based payments 53 47 83 79 d. Directors 2016 US$m 2015 US$m Aggregate emoluments £5,986,052 (2015: £5,235,208) 9 8 Aggregate gains made on the exercise of share options or release of share awards 11 12 Notional contributions to unfunded retirement benefits scheme £370,666 (2015: £502,836) 1 1 21 21 At 31 March 2016 two directors (2015: one) had retirement benefits accruing under money purchase pension schemes. Company contributions to money purchase pension schemes during the year amounted to £120,000 (2015: £40,000). Full details of individual directors’ remuneration are given in the directors’ remuneration report on pages 74 to 92. 123SABMiller plc Annual Report 2016 FINANCIALSTATEMENTS
  • 128.
    FINANCIAL STATEMENTS 7. Taxation 2016 US$m 2015 US$m Currenttaxation 1,039 1,415 – Charge for the year 1,050 1,390 – Adjustments in respect of prior years (11) 25 Withholding taxes and other remittance taxes 148 176 Total current taxation 1,187 1,591 Deferred taxation (35) (318) – Credit for the year (24) (330) – Adjustments in respect of prior years (12) 7 – Rate change 1 5 Taxation expense 1,152 1,273 Tax charge/(credit) relating to components of other comprehensive loss is as follows: Deferred tax charge/(credit) on net remeasurements of defined benefit plans 29 (70) Deferred tax (credit)/charge on financial instruments (18) 3 11 (67) Total current tax 1,187 1,591 Total deferred tax (24) (385) Total taxation 1,163 1,206 Effective tax rate (%) 26.3 26.0 UK taxation included in the above Current taxation – – Withholding taxes and other remittance taxes 91 82 Total current taxation 91 82 Deferred taxation (53) – UK taxation expense 38 82 See the financial definitions section for the definition of the effective tax rate. The calculation is on a basis consistent with that used in prior years and is also consistent with other group operating metrics. Tax on amortisation of intangible assets (excluding computer software) was US$96 million (2015: US$117 million). MillerCoors is not a taxable entity. The tax balances and obligations therefore remain with Miller Brewing Company as a 100% subsidiary of the group. This subsidiary’s tax charge includes tax (including deferred tax) on the group’s share of the taxable profits of MillerCoors and includes tax in other comprehensive income on the group’s share of MillerCoors’ taxable items included within other comprehensive income. Notes to the consolidated financial statements continued 124 SABMiller plc Annual Report 2016
  • 129.
    7. Taxation continued Taxrate reconciliation 2016 US$m 2015 US$m Profit before taxation 4,074 4,830 Less: Share of post-tax results of associates and joint ventures (1,126) (1,083) 2,948 3,747 Tax charge at standard UK rate of 20% (2015: 21%) 590 787 Exempt income (155) (194) Other incentive allowances (33) (34) Expenses not deductible for tax purposes 140 179 Deferred tax asset not recognised/(recognised) 49 (54) Initial recognition of deferred taxation (53) (104) Tax impact of MillerCoors joint venture 158 174 Withholding taxes and other remittance taxes 148 176 Other taxes 37 33 Adjustments in respect of foreign tax rates 288 306 Adjustments in respect of prior periods (23) 32 Deferred taxation rate change 1 5 Deferred taxation on unremitted earnings 5 (33) Total taxation expense 1,152 1,273 8. Earnings per share 2016 US cents 2015 US cents Basic earnings per share 167.8 205.7 Diluted earnings per share 166.0 203.5 Headline earnings per share 188.4 213.4 Adjusted basic earnings per share 224.1 239.1 Adjusted diluted earnings per share 221.6 236.6 The weighted average number of shares was: 2016 Millions of shares 2015 Millions of shares Ordinary shares 1,677 1,674 Treasury shares (59) (63) EBT ordinary shares (10) (7) Basic shares 1,608 1,604 Dilutive ordinary shares 18 17 Diluted shares 1,626 1,621 The calculation of diluted earnings per share excludes 4,582,485 (2015: 8,613,524) share options that were non-dilutive for the year because the exercise price together with the future IFRS 2 charge of the option exceeded the average fair value of the shares during the year and 25,574,875 (2015: 16,316,980) share awards that were non-dilutive for the year because the performance conditions attached to the share awards had not been met. These share incentives could potentially dilute earnings per share in the future. 125SABMiller plc Annual Report 2016 FINANCIALSTATEMENTS
  • 130.
    FINANCIAL STATEMENTS 8. Earningsper share continued Adjusted and headline earnings The group presents an adjusted earnings per share figure which excludes the impact of amortisation of intangible assets (excluding computer software), certain non-recurring items and post-tax exceptional items in order to present an additional measure of performance for the years shown in the consolidated financial statements. Adjusted earnings per share are based on adjusted earnings for each financial year and on the same number of weighted average shares in issue as the basic earnings per share calculation. Headline earnings per share has been calculated in accordance with the South African Circular 2/2015 entitled ‘Headline Earnings’ which forms part of the listing requirements for the JSE Ltd (JSE). The adjustments made to arrive at headline earnings and adjusted earnings are as follows. 2016 US$m 2015 US$m Profit for the year attributable to owners of the parent 2,699 3,299 Headline adjustments Impairment of associate 372 – Impairment of property, plant and equipment 7 73 Impairment of intangible assets – 6 Impairment of goodwill – 286 Profit on disposal of investment in associate – (401) Profit on disposal of business – (45) Tax effects of these items – 146 Non-controlling interests’ share of the above items (1) (1) Share of associates’ and joint ventures’ headline adjustments, net of tax and non-controlling interests (48) 60 Headline earnings 3,029 3,423 Amortisation of intangible assets (excluding computer software) 279 335 Transaction costs 160 – Integration and restructuring costs (excluding impairment) (29) 87 Cost and efficiency programme costs 36 69 Loan guarantee provision 20 – Net foreign exchange losses 54 – Early redemption costs – 48 Recycling of foreign currency translation reserves – (33) Tax effects of the above items (117) (167) Non-controlling interests’ share of the above items (23) (6) Share of associates’ and joint ventures’ other adjustments, net of tax and non-controlling interests 195 79 Adjusted earnings 3,604 3,835 9. Dividends 2016 US$m 2015 US$m Equity 2015 Final dividend paid: 87.0 US cents (2014: 80.0 US cents) per ordinary share 1,404 1,289 2016 Interim dividend paid: 28.25 US cents (2015: 26.0 US cents) per ordinary share 456 416 1,860 1,705 In addition, the directors are proposing a final dividend of 93.75 US cents per share in respect of the financial year ended 31 March 2016, which will absorb an estimated US$1,509 million of shareholders’ funds. If approved by shareholders, and if the proposed offer for the company by AB InBev has not become effective prior to 12 August 2016, the dividend will be paid on 12 August 2016 to shareholders registered on the London and Johannesburg registers as at 5 August 2016. The total dividend per share for the year is 122.0 US cents (2015: 113.0 US cents). Treasury shares do not attract dividends and the employees’ benefit trusts have both waived their right to receive dividends (further information can be found in note 26). Notes to the consolidated financial statements continued 126 SABMiller plc Annual Report 2016
  • 131.
    10. Goodwill US$m Cost At 1April 2014 18,843 Exchange adjustments (3,257) Reclassification (see note 19) (293) Acquisitions – through business combinations 1 At 31 March 2015 15,294 Exchange adjustments (555) Acquisitions – through business combinations 79 At 31 March 2016 14,818 Accumulated impairment At 1 April 2014 346 Exchange adjustments (84) Impairment 286 At 31 March 2015 548 Exchange adjustments 2 At 31 March 2016 550 Net book amount At 1 April 2014 18,497 At 31 March 2015 14,746 At 31 March 2016 14,268 2016 Provisional goodwill of US$79 million arose on the acquisition of Meantime Brewing Company Ltd, a modern craft brewer in the United Kingdom. The fair value exercise in respect of this business combination is now complete. 2015 Provisional goodwill of US$1 million arose on the acquisition of a business in Africa. The fair value exercise in respect of this business combination is now complete. Goodwill is monitored principally on an individual country basis and the net book value is allocated by cash generating unit (CGU) as follows. 2016 US$m 2015 US$m CGUs: Latin America: – Central America 766 777 – Colombia 2,881 3,367 – Peru 1,408 1,505 – Other Latin America 198 207 Africa: – South Africa 321 391 – Other Africa 200 219 Asia Pacific: – Australia 5,858 5,820 Europe: – Czech Republic 761 707 – Netherlands 90 85 – Italy 368 347 – Poland 1,021 1,002 – United Kingdom 74 – – Other Europe 66 63 North America 256 256 14,268 14,746 127SABMiller plc Annual Report 2016 FINANCIALSTATEMENTS
  • 132.
    FINANCIAL STATEMENTS 10. Goodwillcontinued Assumptions The group uses both value in use and fair value less costs of disposal (FVLCD) calculations to determine the recoverable amounts for its CGUs. See note 1 for the detailed accounting policy on how the group determines recoverable value. The key assumptions for the discounted cash flow calculations are as follows. Expected volume five-year compound annual growth rate (CAGR) – Cash flows are based on financial forecasts approved by management for each CGU covering five-year periods and are dependent on management’s expected volume CAGRs which have been determined based on past experience and planned initiatives, and with reference to external sources in respect of macro-economic assumptions. Expected growth rates over the five-year forecast period are generally higher than the long-term average growth rates for the economies in which the CGUs operate as a steady state is not necessarily expected to be reached in this period. The cash flow forecasts included in FVLCD calculations are based on management’s best estimates of expected volume CAGRs and incorporate cash flows associated with enhancing the assets’ performance, such as capital expenditure, where appropriate in order to determine the FVLCD from a market participant’s perspective. Discount rate – The discount rate (weighted average cost of capital) is calculated using a methodology which reflects the returns from United States Treasury notes with a maturity of 20 years, an equity risk premium adjusted for specific industry and country risks, and inflation differentials. The group applies local post-tax discount rates to local post-tax cash flows. For a value in use calculation, where a potential impairment is identified on a post-tax basis, the impairment review is reperformed on a pre-tax basis. Long-term growth rate – Cash flows after the first five-year period are extrapolated using a long-term growth rate, in order to calculate the terminal recoverable amount. The long-term growth rate is estimated using historical trends and expected future trends in inflation rates, based on external data. The following table presents the key assumptions used in the discounted cash flow calculations in each of the group’s operating segments and relate only to subsidiaries of the group. Expected volume CAGRs 2016-2021 % Post-tax discount rates % Long-term growth rates % Latin America 2.9–3.9 8.4–12.7 1.9–3.7 Africa 3.7–11.3 12.2–19.3 5.4–8.6 Asia Pacific (0.1) 7.4 2.6 Europe (0.9)–3.2 6.9–9.0 1.4–2.3 North America1 22.2 6.7 1.9 1 Primarily the international business across the Americas. Impairment reviews results As a result of the annual impairment reviews, no impairment losses have been recognised in the year. In 2015 an impairment charge of US$313 million was recognised in respect of the India CGU in Asia Pacific. This primarily reflected the group’s assessment of the increasing regulatory and excise challenges in the operating environment in India and the proposed partial introduction of a national goods and services tax (GST) which will not apply to beer so that GST on input costs is not expected to be recoverable. The impairment loss was allocated to goodwill (US$286 million), property, plant and equipment (US$23 million), and intangible assets (US$4 million). The recoverable amount of the CGU was based on its value in use, which was determined using a discounted cash flow calculation. In arriving at value in use, a pre-tax discount rate of 14.1% was applied to pre-tax cash flows. Sensitivities to assumptions The group’s impairment reviews are sensitive to changes in the key assumptions described above. The most material goodwill balance is in Australia. In addition to the volume CAGR, pricing and mix, and cost efficiencies are significant factors influencing the recoverable value of the CGU, and therefore NPR and EBITA CAGRs were also considered key assumptions in the discounted cash flow calculation. The estimated recoverable value was calculated on a FVLCD basis. Due to improved performance of the group’s business in Australia, the recoverable amount has increased and is now approximately US$750 million (2015: US$650 million) higher than the carrying value of the CGU. For the recoverable amount to reduce to a level such that it is equal to the carrying value of the CGU, the following would need to occur in isolation: the future compound annual NPR growth over the five-year forecast period to reduce to a level such that the EBITA CAGR over the same period of 3.7% would fall below the long-term growth rate of 2.6%; or the long-term growth rate of 2.6% in nominal terms to fall below 2.1%; or the discount rate to rise from 7.4% to 7.8% or higher. These changes in assumptions are considered reasonably possible in the current operating environment. Based on the group’s sensitivity analysis, a reasonably possible change in a single assumption will not cause an impairment loss in any of the group’s other CGUs. Notes to the consolidated financial statements continued 128 SABMiller plc Annual Report 2016
  • 133.
    11. Intangible assets Brands US$m Computer software US$m Other US$m Total US$m Cost At1 April 2014 9,188 811 557 10,556 Exchange adjustments (1,596) (101) (101) (1,798) Additions – separately acquired 14 172 – 186 Disposals – (8) – (8) At 31 March 2015 7,606 874 456 8,936 Exchange adjustments (289) (22) 4 (307) Additions – separately acquired – 91 – 91 Acquisitions – through business combinations 126 – – 126 Disposals – (33) (20) (53) At 31 March 2016 7,443 910 440 8,793 Accumulated amortisation and impairment At 1 April 2014 1,544 370 110 2,024 Exchange adjustments (301) (48) (25) (374) Amortisation 301 75 34 410 Disposals – (8) – (8) Impairment 4 2 – 6 At 31 March 2015 1,548 391 119 2,058 Exchange adjustments (83) (11) 2 (92) Amortisation 254 73 25 352 Disposals – (31) (20) (51) At 31 March 2016 1,719 422 126 2,267 Net book amount At 1 April 2014 7,644 441 447 8,532 At 31 March 2015 6,058 483 337 6,878 At 31 March 2016 5,724 488 314 6,526 During 2016 no impairment charges in respect of intangible assets were recognised (2015: US$6 million). At 31 March significant individual brands included within the carrying value of intangible assets are as follows. 2016 US$m 2015 US$m Amortisation period remaining (years) Brand carrying value Carlton (Australia) 1,452 1,481 36 Aguila (Colombia) 813 987 29 Victoria Bitter (Australia) 732 748 36 Cristal (Peru) 459 508 29 Grolsch (Netherlands) 342 332 32 129SABMiller plc Annual Report 2016 FINANCIALSTATEMENTS
  • 134.
    FINANCIAL STATEMENTS 12. Property,plant and equipment Assets in course of construction US$m Land and buildings US$m Plant, vehicles and systems US$m Returnable containers US$m Total US$m Cost At 1 April 2014 606 3,665 8,394 2,051 14,716 Exchange adjustments (124) (712) (1,722) (362) (2,920) Additions 828 30 216 345 1,419 Acquisitions – through business combinations – 3 1 – 4 Breakages and shrinkage – – – (140) (140) Transfers (613) 123 476 14 – Transfers to other assets – – (2) – (2) Disposals (1) (63) (298) (39) (401) At 31 March 2015 696 3,046 7,065 1,869 12,676 Exchange adjustments (65) (192) (640) (158) (1,055) Additions 641 91 213 303 1,248 Acquisitions – through business combinations – 6 10 3 19 Breakages and shrinkage – – – (111) (111) Transfers (709) 130 546 33 – Disposals (3) (30) (203) (17) (253) At 31 March 2016 560 3,051 6,991 1,922 12,524 Accumulated depreciation and impairment At 1 April 2014 – 723 3,916 1,012 5,651 Exchange adjustments – (187) (1,015) (203) (1,405) Provided during the year – 74 528 219 821 Breakages and shrinkage – – – (77) (77) Impairment – 43 30 – 73 Disposals – (38) (275) (35) (348) At 31 March 2015 – 615 3,184 916 4,715 Exchange adjustments – (35) (314) (75) (424) Provided during the year – 68 470 205 743 Breakages and shrinkage – – – (54) (54) Impairment – – 7 – 7 Disposals – (14) (190) (9) (213) At 31 March 2016 – 634 3,157 983 4,774 Net book amount At 1 April 2014 606 2,942 4,478 1,039 9,065 At 31 March 2015 696 2,431 3,881 953 7,961 At 31 March 2016 560 2,417 3,834 939 7,750 No impairment losses have been recognised in the year as a result of the annual goodwill impairment reviews (2015: US$23 million) (see note 10). Included in land and buildings is freehold land with a cost of US$498 million (2015: US$560 million) which is not depreciated. Included in plant, vehicles and systems are the following amounts relating to assets held under finance leases. 2016 US$m 2015 US$m Net book amount 74 65 Notes to the consolidated financial statements continued 130 SABMiller plc Annual Report 2016
  • 135.
    12. Property, plantand equipment continued Included in the amounts above are the following amounts in respect of borrowing costs capitalised. 2016 US$m 2015 US$m At 1 April 20 37 Exchange adjustments (3) (6) Amortised during the year (8) (11) At 31 March 9 20 No borrowing costs were capitalised during the year (2015: none). Borrowings are secured by various of the group’s property, plant and equipment with an aggregate net book value of US$86 million (2015: US$91 million). 13. Investments in joint ventures A list of the group’s principal investments in joint ventures, including the name, country of incorporation and effective ownership interest is given in note 33. US$m At 1 April 2014 5,581 Investments in joint ventures 216 Share of results retained 786 Share of other comprehensive loss (179) Dividends received (976) As at 31 March 2015 5,428 Investments in joint ventures 301 Share of results retained 746 Share of other comprehensive income 35 Dividends received (998) At 31 March 2016 5,512 Summarised financial information for the group’s interest in joint ventures, on a 100% basis after adjustments to comply with the group’s accounting policies, is shown below. Summarised balance sheet MillerCoors 2016 US$m 2015 US$m Cash and cash equivalents 16 18 Other current assets 935 911 Total current assets 951 929 Non-current assets 5,030 5,022 Total assets 5,981 5,951 Financial liabilities (excluding trade payables) (72) (47) Other current liabilities (945) (911) Total current liabilities (1,017) (958) Financial liabilities (58) (30) Other non-current liabilities (1,311) (1,509) Total liabilities (2,386) (2,497) Non-controlling interests (38) (41) Net assets attributable to owners 3,557 3,413 131SABMiller plc Annual Report 2016 FINANCIALSTATEMENTS
  • 136.
    FINANCIAL STATEMENTS 13. Investmentsin joint ventures continued Summarised statement of comprehensive income MillerCoors 2016 US$m 2015 US$m Revenue 8,866 8,966 Depreciation and amortisation (411) (322) Interest expense (2) (1) Profit before taxation 1,288 1,361 Taxation expense (3) (5) Profit for the year 1,285 1,356 Other comprehensive income/(loss) 61 (309) Total comprehensive income 1,346 1,047 Reconciliation of summarised financial information A reconciliation of the summarised financial information to the carrying amount of the group’s interests in its joint ventures is as follows. MillerCoors 2016 US$m 2015 US$m Opening net assets 3,413 3,676 Total comprehensive income 1,346 1,047 Dividends paid (1,721) (1,683) Funding to joint venture 519 373 Closing net assets 3,557 3,413 Interest in joint venture (%) 58 58 Interest in joint venture 2,063 1,979 Goodwill 3,449 3,449 Carrying value of investments in joint venture 5,512 5,428 14. Investments in associates A list of the group’s principal investments in associates, including the name, country of incorporation and effective ownership interest is given in note 33. Details of all the group’s investments in associates are provided in the related undertakings section of the annual report. US$m At 1 April 2014 5,787 Exchange adjustments (755) Investments in associates 46 Disposals of investments in associates (368) Share of results retained 297 Share of other comprehensive loss (119) Share of movements in other reserves (6) Dividends receivable (423) At 31 March 2015 4,459 Exchange adjustments (50) Impairment (see note 4) (372) Share of results retained 380 Share of other comprehensive loss (52) Share of movements in other reserves 2 Dividends receivable (253) At 31 March 2016 4,114 2016 There have been no acquisitions or disposals of associates in the year. An impairment charge of US$372 million was recognised in respect of the group’s investment in BIH Brasseries Internationales Holding (Angola) Ltd, its associate with interests in Angola, as a result of the operations in Angola being significantly scaled down following the significant devaluation of the local currency against the US dollar and the lack of availability of hard currency in Angola. The recoverable amount was based on the value in use, determined using a discounted cash flow calculation with a pre-tax discount rate of 24.0%. Notes to the consolidated financial statements continued 132 SABMiller plc Annual Report 2016
  • 137.
    14. Investments inassociates continued 2015 The group disposed of its investment in Tsogo Sun Holdings Ltd (Tsogo Sun), its hotels and gaming associate listed on the Johannesburg Stock Exchange, in August 2014 through an institutional placing and share buyback. The group received net proceeds of US$971 million, and realised a post-tax profit of US$239 million. In January 2015 the group received net proceeds of US$7 million and realised a net profit of US$2 million, after associated costs, on the disposal of its packaging associate in Panama, Latin America. The analysis of associates between listed and unlisted investments is shown below. 2016 US$m 2015 US$m Listed 1,446 1,470 Unlisted 2,668 2,989 4,114 4,459 Further details of the market value of listed investments in associates are given in note 21. Summarised financial information Summarised financial information for associates, which in the opinion of the directors are material to the group, on a 100% basis after adjustments to comply with the group’s accounting policies, is as follows. Castel1 Anadolu Efes CR Snow 2016 US$m 2015 US$m 2016 US$m 2015 US$m 2016 US$m 2015 US$m Summarised balance sheet Total current assets 3,963 3,388 1,411 1,478 1,641 1,523 Total non-current assets 3,699 2,972 6,282 6,390 4,888 5,032 Total assets 7,662 6,360 7,693 7,868 6,529 6,555 Total current liabilities (1,505) (1,257) (777) (920) (2,813) (2,869) Total non-current liabilities (592) (409) (2,491) (2,402) (744) (659) Total liabilities (2,097) (1,666) (3,268) (3,322) (3,557) (3,528) Total non-controlling interests (825) (672) (1,782) (1,659) (20) (20) Net assets attributable to owners 4,740 4,022 2,643 2,887 2,952 3,007 Summarised statement of comprehensive income/(loss) Revenue 6,019 6,000 5,099 6,408 4,449 4,496 Profit/(loss) for the year attributable to owners 825 815 (65) (466) 262 199 Other comprehensive (loss)/income attributable to owners (92) (59) 158 (537) (172) 23 Total comprehensive income/(loss) attributable to owners 733 756 93 (1,003) 90 222 Reconciliation of summarised financial information A reconciliation of the summarised financial information to the carrying amount of the group’s interests in its associates is as follows. Castel1 Anadolu Efes CR Snow 2016 US$m 2015 US$m 2016 US$m 2015 US$m 2016 US$m 2015 US$m Opening net assets attributable to owners 4,022 5,212 2,887 4,571 3,007 3,267 Total comprehensive income/(loss) attributable to owners 733 756 93 (1,003) 90 222 Dividends paid (394) (359) (97) – (146) (465) Exchange adjustments 379 (1,587) (240) (681) – 3 Other movements in reserves – – – – 1 (20) Closing net assets attributable to owners 4,740 4,022 2,643 2,887 2,952 3,007 Interest in associates (%) 20–40 20–40 24 24 49 49 Interest in associates 1,053 925 634 693 1,446 1,473 Impairment (105) – – – – – Goodwill 50 310 357 387 – – Carrying value of investments in associates 998 1,235 991 1,080 1,446 1,473 1 BIH Brasseries Internationales Holding Ltd, Société des Brasseries et Glacières Internationales SA, Algerienne de Bavaroise Spa, BIH Brasseries Internationales Holding (Angola) Ltd, Marocaine d’Investissements et de Services SA, Skikda Bottling Company SARL, Société de Boissons de I’Ouest Algerien SARL, and Société des Nouvelles Brasseries together make up Castel’s African beverage operations. Details of individual ownership percentages are included in the related undertakings section of the annual report. 133SABMiller plc Annual Report 2016 FINANCIALSTATEMENTS
  • 138.
    FINANCIAL STATEMENTS 14. Investmentsin associates continued Individually immaterial associates Summarised financial information for individually immaterial associates, in aggregate, is as follows. 2016 US$m 2015 US$m Summarised statement of comprehensive income Aggregate carrying amount of individually immaterial associates 679 671 Aggregate amounts of the group’s share of: Profit for the year attributable to owners 126 124 Other comprehensive income attributable to owners 20 12 Total comprehensive income 146 136 15. Inventories 2016 US$m 2015 US$m Raw materials and consumables 568 588 Work in progress 91 89 Finished goods and goods for resale 334 353 993 1,030 The following amount of inventories is expected to be utilised after 12 months. 2016 US$m 2015 US$m Raw materials and consumables 33 38 There were no borrowings secured on the inventories of the group (2015: US$nil). An impairment charge of US$19 million was recognised in respect of inventories during the year (2015: US$34 million). 16. Trade and other receivables 2016 US$m 2015 US$m Trade receivables 1,448 1,412 Less: provision for impairment (129) (132) Trade receivables – net 1,319 1,280 Other receivables 363 355 Less: provision for impairment (5) (12) Other receivables – net 358 343 Amounts owed by associates 15 28 Amounts owed by joint ventures 8 4 Prepayments and accrued income 163 182 Total trade and other receivables 1,863 1,837 Analysed as: Current Trade receivables – net 1,308 1,265 Other receivables – net 269 259 Amounts owed by associates 4 17 Amounts owed by joint ventures 8 4 Prepayments and accrued income 153 166 1,742 1,711 Non-current Trade receivables – net 11 15 Other receivables – net 89 84 Amounts owed by associates 11 11 Prepayments and accrued income 10 16 121 126 Notes to the consolidated financial statements continued 134 SABMiller plc Annual Report 2016
  • 139.
    16. Trade andother receivables continued The net carrying values of trade and other receivables are considered a close approximation of their fair values. At 31 March 2016 trade and other receivables of US$462 million (2015: US$415 million) were past due but not impaired. These relate to customers of whom there is no recent history of default. The ageing of these trade and other receivables is shown below. Past due Fully performing US$m Within 30 days US$m 30-60 days US$m 60-90 days US$m 90-180 days US$m Over 180 days US$m At 31 March 2016 Trade receivables 938 175 65 25 35 36 Other receivables 221 42 11 4 24 44 Amounts owed by associates 14 1 – – – – Amounts owed by joint ventures 8 – – – – – At 31 March 2015 Trade receivables 937 165 47 19 24 41 Other receivables 232 45 8 4 15 22 Amounts owed by associates 3 13 3 – 9 – Amounts owed by joint ventures 4 – – – – – The group holds collateral as security for past due trade receivables to the value of US$7 million (2015: US$9 million). Collateral held primarily includes bank guarantees and charges over assets. At 31 March 2016 trade receivables of US$174 million (2015: US$179 million) were determined to be specifically impaired and provided for. The amount of the provision at 31 March 2016 was US$129 million (2015: US$132 million) and reflects trade receivables from customers which are considered to be experiencing difficult economic situations. It was assessed that a portion of these receivables is expected to be recovered. The group holds collateral as security against specifically impaired trade receivables with a fair value of US$2 million (2015: US$1 million). At 31 March 2016 other receivables of US$17 million (2015: US$29 million) were determined to be specifically impaired and provided for. The amount of the provision at 31 March 2016 was US$5 million (2015: US$12 million) and reflects loans to customers which are considered to be experiencing difficult economic situations. It was assessed that a portion of these receivables is expected to be recovered. No collateral was held as security against specifically impaired other receivables in either of the years ended 31 March 2016 and 2015. The carrying amounts of trade and other receivables are denominated in the following currencies. 2016 US$m 2015 US$m Australian dollars 190 161 British pound 100 112 Colombian peso 95 117 Czech koruna 80 76 Euro 206 169 Indian rupee 182 130 Polish zloty 136 143 SA rand 269 297 US dollars 171 183 Other currencies 434 449 1,863 1,837 Movements on the provisions for impairment of trade receivables and other receivables are as follows. Trade receivables Other receivables 2016 US$m 2015 US$m 2016 US$m 2015 US$m At 1 April (132) (144) (12) (12) Provision for receivables impairment (26) (34) 1 – Receivables written off during the year as uncollectible 26 21 5 (2) Exchange adjustments 3 25 1 2 At 31 March (129) (132) (5) (12) The creation of provisions for impaired receivables is included in net operating expenses in the income statement (see note 3). 135SABMiller plc Annual Report 2016 FINANCIALSTATEMENTS
  • 140.
    FINANCIAL STATEMENTS 17. Cashand cash equivalents 2016 US$m 2015 US$m Short-term deposits 996 528 Cash at bank and in hand 434 437 1,430 965 Cash and short-term deposits of US$109 million (2015: US$117 million) are held in certain African countries (including South Africa) and are subject to local exchange control regulations. These local exchange control regulations provide for restrictions on exporting capital from those countries, other than through normal dividends. As normal dividends are generally able to be paid, these restrictions are not expected to have a material impact on the group’s ability to meet its ongoing obligations. 18. Trade and other payables 2016 US$m 2015 US$m Trade payables 1,478 1,404 Accruals 704 651 Deferred income 8 8 Containers in the hands of customers 437 443 Amounts owed to associates 36 38 Amounts owed to joint ventures 14 18 Deferred consideration for acquisitions – 4 Excise duty payable 331 344 VAT and other taxes payable 212 221 Other payables 678 615 Total trade and other payables 3,898 3,746 Analysed as: Current Trade payables 1,478 1,404 Accruals 704 651 Deferred income 2 4 Containers in the hands of customers 437 443 Amounts owed to associates 36 38 Amounts owed to joint ventures 14 18 Deferred consideration for acquisitions – 4 Excise duty payable 331 344 VAT and other taxes payable 212 221 Other payables 656 601 3,870 3,728 Non-current Deferred income 6 4 Other payables 22 14 28 18 Notes to the consolidated financial statements continued 136 SABMiller plc Annual Report 2016
  • 141.
    19. Deferred taxation Themovement on the net deferred tax liability is shown below. 2016 US$m 2015 US$m At 1 April 2,112 3,131 Exchange adjustments (131) (345) Acquisitions – through business combinations 26 1 Rate change 1 5 Transfers from current tax 58 3 Reclassification1 – (293) Credited to the income statement (36) (323) Deferred tax on items (credited)/charged to other comprehensive loss: – Financial instruments (18) 3 – Remeasurements of defined benefit plans 29 (70) At 31 March 2,041 2,112 The movements in deferred tax assets and liabilities (after offsetting of balances as permitted by IAS 12) during the year are shown below. Fixed asset allowances US$m Tax losses and credits US$m Intangibles US$m Financial instruments US$m Investment in MillerCoors joint venture US$m Other timing differences US$m Total US$m Deferred tax liabilities At 1 April 2014 724 (413) 2,380 (48) 644 (41) 3,246 Exchange adjustments (113) 123 (419) (2) – 33 (378) Acquisitions – through business combinations 1 – – – – – 1 Rate change (3) – 11 – – (3) 5 Transfers (from)/to deferred tax assets (38) 2 – 2 3 18 (13) Reclassification1 – (293) – – – – (293) Charged/(credited) to the income statement 29 (81) (100) 7 (5) (74) (224) Deferred tax on items charged/(credited) to other comprehensive loss: – Financial instruments – – – 1 – – 1 – Remeasurements of defined benefit plans – – – – (68) (2) (70) At 31 March 2015 600 (662) 1,872 (40) 574 (69) 2,275 Exchange adjustments (75) (3) (69) (1) – 20 (128) Acquisitions – through business combinations 1 – 25 – – – 26 Rate change (3) – (1) – – – (4) Transfers from current tax – 56 – – – 2 58 Transfers from deferred tax assets – – – – – (2) (2) Charged/(credited) to the income statement 49 (8) (73) (9) 23 32 14 Deferred tax on items (credited)/charged to other comprehensive loss: – Financial instruments – – – (5) (13) – (18) – Remeasurements of defined benefit plans – – – – 28 1 29 At 31 March 2016 572 (617) 1,754 (55) 612 (16) 2,250 1 Following clarification from the IFRS Interpretations Committee during 2014 regarding the recognition of deferred taxes, US$293 million was reclassified from goodwill to net deferred tax liabilities, with no impact on results or net assets. Fixed asset allowances US$m Provisions and accruals US$m Other timing differences US$m Total US$m Deferred tax assets At 1 April 2014 (16) 35 96 115 Exchange adjustments (3) (5) (25) (33) Transfers from current tax – – (3) (3) Transfers (to)/from deferred tax liabilities (38) 19 6 (13) Credited to the income statement 89 8 2 99 Deferred tax on items charged to other comprehensive income: – Financial instruments – – (2) (2) At 31 March 2015 32 57 74 163 Exchange adjustments – – 3 3 Rate change (4) (1) – (5) Transfers (to)/from deferred tax liabilities – (5) 3 (2) (Charged)/credited to the income statement (25) 7 68 50 At 31 March 2016 3 58 148 209 137SABMiller plc Annual Report 2016 FINANCIALSTATEMENTS
  • 142.
    FINANCIAL STATEMENTS 19. Deferredtaxation continued Deferred tax assets and liabilities are only offset where there is a legally enforceable right of offset and the deferred tax assets and liabilities relate to income taxes levied by the same taxation authority on either the same taxable entity or different taxable entities where there is an intention to settle the balances on a net basis. The deferred tax asset arises due to timing differences in Corporate, Europe, Africa and Latin America. Given both recent and forecast trading, the directors are of the opinion that the level of profits in the foreseeable future is more likely than not to be sufficient to recover these assets. Deferred tax liabilities of US$1,784 million (2015: US$2,013 million) are expected to fall due after more than one year and deferred tax assets of US$104 million (2015: US$115 million) are expected to be recovered after more than one year. 2016 US$m 2015 US$m Unrecognised deferred tax assets Deferred tax assets have not been recognised in respect of the following items: Tax losses 158 281 Tax credits 1,477 1,355 Depreciation in excess of capital allowances 10 7 Share-based payments 51 47 1,696 1,690 Deferred tax assets in respect of tax losses are not recognised unless there is convincing evidence that existing taxable temporary differences will reverse in the future or there will be sufficient taxable profits in future years to recover the assets. A material element of the tax losses arose in the UK. A portion (US$53 million) has now been recognised due to the group’s growing UK business and increasing activities within the corporate head office, which are reflected in the group’s future forecasts. US$102 million (2015: US$229 million) of the total unrecognised tax losses do not expire. Deferred tax assets in respect of tax credits arising which are carried forward for offset against future profits are not recognised unless it is probable that future profits will arise. US$1,468 million (2015: US$1,345 million) of these tax credits expire within 10 years. Deferred tax is recognised on the unremitted earnings of overseas subsidiaries where there is an intention to distribute those reserves. A deferred tax liability of US$10 million (2015: US$11 million) has been recognised. A deferred tax liability of US$48 million (2015: US$56 million) has been recognised in respect of unremitted profits of associates where a dividend policy is not in place. Unremitted earnings of subsidiaries, associates and joint ventures operating in lower tax jurisdictions do not result in a deferred tax liability where the reporting entity is able to control the timing of the reversal of temporary differences and it is probable that the temporary differences will not reverse in the foreseeable future. Similarly no tax is provided where there are plans to remit overseas earnings of subsidiaries but it is not expected that such distributions will give rise to a tax liability. As a result of UK legislation which largely exempts overseas dividends from tax, the temporary differences arising on unremitted profits are unlikely to lead to additional corporate taxes. However, remittance to the UK of those earnings may still result in a tax liability, principally as a result of withholding taxes levied by the overseas tax jurisdictions in which those subsidiaries operate. 20. Borrowings 2016 US$m 2015 US$m Current Secured Overdrafts 12 29 Obligations under finance leases 13 10 Other secured loans 4 – 29 39 Unsecured Overdrafts 147 186 Unsecured bonds 2,324 712 Other unsecured loans 426 1,024 2,897 1,922 Total current borrowings 2,926 1,961 Notes to the consolidated financial statements continued 138 SABMiller plc Annual Report 2016
  • 143.
    20. Borrowings continued 2016 US$m 2015 US$m Non-current Secured Obligationsunder finance leases 48 43 Other secured loans 5 1 53 44 Unsecured Unsecured bonds 8,521 10,203 Unsecured loans 240 336 8,761 10,539 Total non-current borrowings 8,814 10,583 Total current and non-current borrowings 11,740 12,544 Analysed as: Overdrafts 159 215 Bank loans 675 1,361 Bonds 10,845 10,915 Obligations under finance leases 61 53 11,740 12,544 Maturity of non-current financial liabilities The maturity profile of the carrying amount of the group’s non-current financial liabilities at 31 March was as follows. Bank loans US$m Bonds US$m Finance leases US$m Net derivative financial assets¹ US$m 2016 Total US$m Bank loans US$m Bonds US$m Finance leases US$m Net derivative financial assets¹ US$m 2015 Total US$m Amounts falling due: Between one and two years 190 67 13 (16) 254 96 2,327 10 (264) 2,169 Between two and three years 55 1,859 10 (104) 1,820 239 90 7 (23) 313 Between three and four years – 1,158 8 (22) 1,144 1 1,867 6 (122) 1,752 Between four and five years – 540 7 (7) 540 – 1,068 7 (19) 1,056 In five years or more – 4,897 10 (398) 4,509 1 4,851 13 (333) 4,532 245 8,521 48 (547) 8,267 337 10,203 43 (761) 9,822 ¹ Net financing-related derivative financial instruments only (note 22). 2016 On 7 August 2015 FBG Treasury (Aust) Pty Ltd issued AUD700 million, 3.75% Notes due August 2020, guaranteed by SABMiller plc. 2015 There were no bonds issued during the year ended 31 March 2015. In December 2014 US$850 million, 6.5% Notes due 2016 were redeemed early. 139SABMiller plc Annual Report 2016 FINANCIALSTATEMENTS
  • 144.
    FINANCIAL STATEMENTS 20. Borrowingscontinued Maturity of obligations under finance leases Obligations under finance leases are as follows. 2016 US$m 2015 US$m The minimum lease payments under finance leases fall due as follows. Within one year 16 11 Between one and five years 45 36 In five years or more 12 15 73 62 Future finance charges (12) (9) Present value of finance lease liabilities 61 53 21. Financial risk factors Financial risk management Overview In the normal course of business, the group is exposed to the following financial risks: − Market risk − Credit risk – Liquidity risk This note explains the group’s exposure to each of the above risks, aided by quantitative disclosures included throughout these consolidated financial statements, and it summarises the policies and processes that are in place to measure and manage the risks arising, including those related to the management of capital. The directors are ultimately responsible for the establishment and oversight of the group’s risk management framework. An essential part of this framework is the role undertaken by the audit committee of the board, supported by the internal audit function, and by the Chief Financial Officer, who in this regard is supported by the treasury committee and the group treasury function. Among other responsibilities, the audit committee reviews the internal control environment and risk management systems within the group and it reports its activities to the board. The board also receives a quarterly report on treasury activities, including confirmation of compliance with treasury risk management policies. The group treasury function is responsible for the management of cash, borrowings and the financial risks arising in relation to interest rates, foreign exchange rates and the price risk of some commodities. The responsibility for the management of the remaining commodities exposures primarily lies with the group’s centralised procurement function, SABMiller Procurement GmbH (SABMiller Procurement). Some of the risk management strategies include the use of derivatives in order to manage the currency, interest rate and commodities exposures arising from the group’s operations. It is the policy of the group that no trading in financial instruments be undertaken. The group’s treasury policies are established to identify and analyse the financial risks faced by the group, to set appropriate risk limits and controls and to monitor exposures and adherence to limits. a. Market risk (i) Foreign exchange risk The group is subject to exposure on the translation of the foreign currency denominated net assets of subsidiaries, associates and joint ventures into the group’s US dollar reporting currency. The group seeks to mitigate this exposure, where cost effective, by borrowing in the same currencies as the functional currencies of its main operating units or by achieving the same effect through the use of derivatives. An approximate nominal value equivalent to US$2,519 million (2015: US$3,691 million) of borrowings has been swapped into currencies that match the currency of the underlying operations of the group, including Australian dollar, Colombian peso, Czech koruna, Peruvian nuevo sol, Polish zloty and South African rand. The group does not hedge currency exposures from the translation of profits earned in foreign currency subsidiaries, associates and joint ventures. The group is also exposed to transactional currency risk on sales and purchases that are denominated in a currency other than the respective functional currencies of group entities. These exposures are managed primarily by the group treasury function which, subject to regulatory constraints or currency market limitations, hedges a proportion of the foreign currency exposures estimated to arise over a period of up to 18 months. Committed transactional exposures that are certain are hedged fully without limitation in time. The group principally uses forward exchange derivatives to hedge currency risk. The tables below set out the group’s currency exposures from financial assets and liabilities held by group companies in currencies other than their functional currencies and resulting in exchange movements in the income statement and balance sheet. The sensitivity analysis has been prepared on a basis consistent with the prior year, based on reasonably possible changes in exchange rates, and assumes all other variables are held constant. Notes to the consolidated financial statements continued 140 SABMiller plc Annual Report 2016
  • 145.
    21. Financial riskfactors continued Australian dollars US$m Euro US$m Latin American currencies US$m Other European currencies US$m SA rand US$m US dollars US$m Other US$m Total US$m Financial assets Trade and other receivables 74 140 17 278 141 122 27 799 Derivative financial instruments¹ 55 3,047 24 831 55 1,209 54 5,275 Cash and cash equivalents – 22 – 32 6 48 – 108 Intra-group assets 37 1,088 18 448 29 127 1 1,748 166 4,297 59 1,589 231 1,506 82 7,930 Financial liabilities Trade and other payables (72) (142) – (294) (63) (389) (4) (964) Derivative financial instruments¹ (75) (2,640) (937) (1,650) (554) (163) (18) (6,037) Borrowings (2) (1,164) – (5) – (775) (1) (1,947) Intra-group liabilities (99) (37) (1) (180) (21) (329) – (667) (248) (3,983) (938) (2,129) (638) (1,656) (23) (9,615) At 31 March 2016 (82) 314 (879) (540) (407) (150) 59 (1,685) Potential impact on profit for the year – gain/(loss) 20% increase in functional currency 10 (1) (6) (1) 3 14 (10) 9 20% decrease in functional currency (12) 2 7 1 (3) (17) 12 (10) Potential impact on other comprehensive income – gain/(loss) 20% increase in functional currency 4 (51) 152 91 65 10 – 271 20% decrease in functional currency (4) 61 (183) (109) (78) (13) – (326) ¹ These represent the notional amounts of derivative financial instruments. Australian dollars US$m Euro US$m Latin American currencies US$m Other European currencies US$m SA rand US$m US dollars US$m Other US$m Total US$m Financial assets Trade and other receivables 1 82 – 121 150 36 42 432 Derivative financial instruments¹ 79 3,230 – 1,260 73 2,060 – 6,702 Cash and cash equivalents – 20 1 181 3 26 9 240 Intra-group assets 31 1,131 – 422 12 277 2 1,875 111 4,463 1 1,984 238 2,399 53 9,249 Financial liabilities Trade and other payables (25) (195) – (190) (46) (348) (3) (807) Derivative financial instruments¹ (563) (3,009) (884) (2,041) (787) (286) – (7,570) Borrowings – (1,071) – (5) (1) (1,497) (19) (2,593) Intra-group liabilities (44) (31) (1) (142) (25) (177) (2) (422) (632) (4,306) (885) (2,378) (859) (2,308) (24) (11,392) At 31 March 2015 (521) 157 (884) (394) (621) 91 29 (2,143) Potential impact on profit for the year – gain/(loss) 20% increase in functional currency 1 3 32 (11) (4) 43 (5) 59 20% decrease in functional currency (1) (4) (38) 13 5 (52) 6 (71) Potential impact on other comprehensive income – gain/(loss) 20% increase in functional currency 86 (29) 116 77 107 (58) – 299 20% decrease in functional currency (103) 35 (139) (92) (129) 70 – (358) ¹ These represent the notional amounts of derivative financial instruments. 141SABMiller plc Annual Report 2016 FINANCIALSTATEMENTS
  • 146.
    FINANCIAL STATEMENTS 21. Financialrisk factors continued The group holds foreign currency cash flow hedges totalling US$2,388 million at 31 March 2016 (2015: US$1,892 million). The foreign exchange gains or losses on these contracts are recorded in the cash flow hedging reserve until the hedged transactions occur, at which time the respective gains and losses are transferred to inventory, property, plant and equipment, goodwill or to the income statement as appropriate. The group holds net investment hedges totalling US$2,220 million at 31 March 2016 (2015: US$3,111 million). The foreign exchange gains or losses on these instruments are recorded in the net investment hedging reserve and partially offset the foreign currency translation risk on the group’s foreign currency net assets. (ii) Interest rate risk Interest rate risk is monitored based on net debt exposures. As at 31 March 2016 40% (2015: 57%) of net debt was in fixed rates taking into account interest rate derivatives. The group’s practice is to borrow (direct or synthetically) in floating rates, reflecting the fact that floating rates are generally lower than fixed rates over the medium term. The extent to which group borrowings may be in floating rates is restricted by policy such that the impact of a 1% increase in interest rates on finance costs can be no more than an agreed proportion of adjusted EBITDA. The policy excludes borrowings arising from acquisitions in the previous six months. Exposure to movements in interest rates on group borrowings is managed through interest rate derivatives. The cash flow interest rate risk sensitivities on variable debt and interest rate swaps are shown in the table below. This analysis assumes all other variables, in particular foreign currency rates, remain constant. The analysis was performed on the same basis in the prior year, based on reasonably possible changes in interest rates. 2016 US$m 2015 US$m Net debt 9,638 10,465 Less: fixed rate debt (7,814) (9,550) Variable rate debt 1,824 915 Adjust for: Financial derivatives 3,916 3,545 Net variable rate debt exposure 5,740 4,460 +/- 100 bps change Potential impact on profit for the year 57 45 +/- 100 bps change Potential impact on other comprehensive income – – Fair value sensitivity analysis for fixed income instruments Changes in the market interest rates of non-derivative financial instruments with fixed interest rates only affect income if these are measured at their fair value. As such, all financial instruments with fixed rates of interest that are accounted for at amortised cost are not subject to interest rate risk as defined in IFRS 7. The group holds derivative contracts with a nominal value of US$5,416 million as at 31 March 2016 (2015: US$4,204 million) which are designated as fair value hedges. In the case of these instruments and the underlying fixed rate bonds, changes in the fair values of the hedged item and the hedging instrument attributable to interest rate movements materially net off in the income statement in the same period. (iii) Price risk Commodity price risk The group is exposed to variability in the price of commodities used in the production or in the packaging of finished products, such as the price of malt, barley, sugar, diesel and aluminium. Commodity price risk is managed within minimum and maximum guard rails principally through multi-year fixed price contracts with suppliers and, where appropriate, derivative contracts. At 31 March 2016 the notional value of commodity derivatives amounted to US$184 million (2015: US$142 million). No sensitivity analysis has been provided on these outstanding contracts as the impact is considered to be immaterial. Equity securities price risk The group is exposed to equity securities price risk because of investments held by the group and classified on the balance sheet as available for sale investments. No sensitivity analysis has been provided on these outstanding contracts as the impact is considered to be immaterial. b. Credit risk Credit risk is the risk of financial loss to the group if a customer or counterparty to a financial instrument fails to meet its contractual obligations. Financial instruments The group limits its exposure to financial institutions by setting credit limits on a sliding scale based on their credit ratings and generally dealing only with counterparties with a minimum credit rating of BBB- from S&P and Fitch, and Baa3 from Moody’s. For banks with a lower credit rating, or with no international credit rating, a maximum limit of US$5 million is applied, unless specific approval is obtained from either the Chief Financial Officer or the audit committee of the board. The utilisation of credit limits is regularly monitored. To reduce credit exposures, the group has ISDA Master Agreements with most of its counterparties for financial derivatives, which permit net settlement of assets and liabilities in certain circumstances. Notes to the consolidated financial statements continued 142 SABMiller plc Annual Report 2016
  • 147.
    21. Financial riskfactors continued Trade and other receivables There is no significant concentration of credit risk with respect to trade receivables as the group has a large number of customers which are internationally dispersed. The type of customers range from wholesalers and distributors to smaller retailers. The group has implemented policies that require appropriate credit checks on potential customers before sales commence. Credit risk is managed by limiting the aggregate amount of exposure to any one counterparty. The group considers its maximum credit risk to be US$3,884 million (2015: US$3,760 million) which is the total of the group’s financial assets. c. Liquidity risk Liquidity risk is the risk that the group will not be able to meet its financial obligations as they fall due. The group finances its operations through cash generated by the business and a mixture of short-term and medium-term bank credit facilities, bank loans, corporate bonds and commercial paper with a range of maturity dates. In this way, the group ensures that it is not overly reliant on any particular liquidity source or that maturities of borrowings sourced in this way are not overly concentrated. Subsidiaries have access to local bank credit facilities, but are principally funded by the group. Liquidity risk faced by the group is mitigated by having diverse sources of finance available to it and by maintaining substantial unutilised banking facilities and reserve borrowing capacity, as indicated by the level of undrawn facilities. Undrawn borrowing facilities The group had the following undrawn committed borrowing facilities available at 31 March in respect of which all conditions precedent had been met at that date. 2016 US$m 2015 US$m Amounts expiring: Within one year 108 65 Between one and two years 5 76 Between two and five years 3,500 3,503 3,613 3,644 At 31 March 2016 the group had the following core lines of credit that were available for general corporate purposes. SABMiller plc: – US$2,500 million committed syndicated revolving credit facility, which is due to expire in May 2020. SABMiller Holdings Inc: – US$1,000 million committed syndicated revolving credit facility, which is due to expire in May 2020. In April 2016 the group extended its existing US$2,500 million and US$1,000 million committed syndicated facilities, both shown as undrawn in the table above, by one year to May 2021, with the exception of US$117 million for which the maturity remains May 2020. The table below analyses the group’s financial liabilities into relevant maturity groupings based on the remaining period at the balance sheet date to the contractual settlement date. The amounts disclosed in the table are the contractual undiscounted cash flows. The amounts disclosed for financial guarantee contracts represent the maximum possible cash outflows for guarantees provided in respect of associates’ and third party bank facilities, which would only be payable upon the occurrence of certain default events. Should such events occur, certain remedies are available that could mitigate the impact. Less than 1 year US$m Between 1 and 2 years US$m Between 2 and 5 years US$m Over 5 years US$m At 31 March 2016 Borrowings (3,305) (598) (4,305) (6,771) Net settled derivative financial instruments (92) (9) (2) – Gross settled derivative financial instruments – inflows 2,596 114 5 – Gross settled derivative financial instruments – outflows (2,715) (120) (6) – Trade and other payables (3,325) (17) (1) (4) Financial guarantee contracts (120) – – – At 31 March 2015 Borrowings (2,355) (2,853) (3,940) (6,978) Net settled derivative financial instruments (32) (6) (2) – Gross settled derivative financial instruments – inflows 1,570 79 – – Gross settled derivative financial instruments – outflows (1,653) (80) – – Trade and other payables (3,158) (14) – – Financial guarantee contracts (122) – – – 143SABMiller plc Annual Report 2016 FINANCIALSTATEMENTS
  • 148.
    FINANCIAL STATEMENTS 21. Financialrisk factors continued Capital management The capital structure of the group consists of net debt (see note 27c) and shareholders’ equity. The group’s policy is to maintain a strong capital base so as to maintain investor, creditor and market confidence and to sustain future development of the business. Besides the minimum capitalisation rules that may apply to subsidiaries in different countries, the group’s only externally imposed capital requirement relates to the group’s core lines of credit which include a net debt to EBITDA financial covenant which was complied with throughout the year. The group monitors its financial capacity and credit ratings by reference to a number of key financial ratios and cash flow metrics including net debt to adjusted EBITDA and interest cover. These provide a framework within which the group’s capital base is managed including dividend policy. If the group fails to meet the financial targets required by the ratings agencies, a credit rating downgrade could impact the average interest rate of borrowings and the future availability of credit to the group. The group is currently rated A3 under review for downgrade by Moody’s Investors Service and A-/stable outlook by S&P Global Ratings. Fair value estimation The following tables present the group’s financial assets and liabilities that are measured at fair value on a recurring basis, and the fair values of other assets and liabilities that are not measured at fair value, but where the fair value is required to be disclosed in the financial statements. Recurring fair value measurements Level 1 US$m Level 2 US$m Level 3 US$m Total US$m At 31 March 2016 Assets Derivative financial instruments – 846 – 846 Available for sale investments – 6 13 19 Total assets – 852 13 865 Liabilities Derivative financial instruments – (239) – (239) Total liabilities – (239) – (239) At 31 March 2015 Assets Derivative financial instruments – 1,233 – 1,233 Available for sale investments – 9 12 21 Total assets – 1,242 12 1,254 Liabilities Derivative financial instruments – (111) – (111) Total liabilities – (111) – (111) Notes to the consolidated financial statements continued 144 SABMiller plc Annual Report 2016
  • 149.
    21. Financial riskfactors continued Assets and liabilities for which fair values are disclosed Carrying amount US$m Level 1 US$m Level 2 US$m Level 3 US$m Total US$m At 31 March 2016 Assets Investments in listed associates – Anadolu Efes 991 1,081 – – 1,081 – Distell Group 209 624 – – 624 – Delta Corporation 246 281 – – 281 Total assets 1,446 1,986 – – 1,986 Liabilities Current borrowings (2,926) (2,340) (610) – (2,950) Non-current borrowings (8,814) (8,818) (299) – (9,117) Total liabilities (11,740) (11,158) (909) – (12,067) At 31 March 2015 Assets Investments in listed associates – Anadolu Efes 1,080 1,187 – – 1,187 – Distell Group 211 741 – – 741 – Delta Corporation 179 324 – – 324 Total assets 1,470 2,252 – – 2,252 Liabilities Current borrowings (1,961) (717) (1,253) – (1,970) Non-current borrowings (10,583) (10,688) (390) – (11,078) Total liabilities (12,544) (11,405) (1,643) – (13,048) There have been no material transfers between levels during the year ended 31 March 2016 (2015: none). The levels of the fair value hierarchy and its application to the group’s assets and liabilities are described below. Level 1: Quoted prices (unadjusted) in active markets for identical assets or liabilities. The fair value of assets and liabilities traded in active markets is based on quoted market prices at the balance sheet date. A market is regarded as active if quoted prices are readily and regularly available from an exchange, dealer, broker, industry group, pricing service, or regulatory agency, and those prices represent actual and regularly occurring market transactions on an arm’s length basis. The quoted market price used for financial assets held by the group is the current bid price. Level 2: Inputs other than quoted prices that are observable for the asset or liability, either directly (i.e. as prices) or indirectly (i.e. derived from prices). The fair values of financial instruments that are not traded in an active market (for example, over the counter derivatives or infrequently traded listed investments) are determined by using valuation techniques. These valuation techniques maximise the use of observable market data where it is available and rely as little as possible on entity specific estimates. If all significant inputs required to fair value an instrument are observable, the instrument is included in level 2. The fair values of derivatives included in level 2 incorporate various inputs including the credit quality of counterparties, spot and forward foreign exchange rates, and interest rate curves. The fair values of borrowings included in level 2 are based on the net present value of the anticipated future cash flows associated with these instruments, using rates currently available for debt on similar terms, credit risk and remaining maturities. Valuation techniques for other level 2 instruments could include standard valuation models based on market parameters for interest rates, yield curves or foreign exchange rates quotes for similar instruments from financial counterparties or the use of comparable arm’s length transactions, and discounted cash flows. Level 3: Inputs for the asset or liability that are not based on observable market data. Specific valuation techniques, such as discounted cash flow analysis, are used to determine fair value of the remaining financial instruments. Valuation process The group’s treasury function is responsible for performing fair value measurements for financial instruments. The fair value measurement calculations are subject to review procedures and are performed in accordance with policies defined by the treasury committee. Other fair value measurements are performed by the group’s finance department. Significant level 3 valuations are reviewed and approved by the finance, control and assurance committee in the relevant region on a by exception basis. Valuations falling into this category are usually immaterial. 145SABMiller plc Annual Report 2016 FINANCIALSTATEMENTS
  • 150.
    FINANCIAL STATEMENTS 22. Derivativefinancial instruments Current derivative financial instruments 2016 2015 Notional value US$m Assets US$m Liabilities US$m Notional value US$m Assets US$m Liabilities US$m Fair value hedges Interest rate swaps 1,500 16 (5) 700 11 – Cash flow hedges Forward foreign currency contracts 2,207 13 (43) 1,757 51 (30) Cross currency swaps 212 89 – 492 208 – Commodity contracts 103 1 (10) 97 3 (7) Net investment hedges Forward foreign currency contracts 1,534 4 (104) 2,080 109 (11) Cross currency swaps 171 114 (2) 241 30 (2) Held for trading Interest rate swaps 1,000 15 (2) – – – Forward foreign currency contracts 1,509 27 (43) 1,439 51 (51) Cross currency swaps 34 1 – – – – Commodity contracts 13 1 (4) – – – 8,283 281 (213) 6,806 463 (101) Financing-related current derivative financial instruments amount to a net asset of US$125 million (2015: US$353 million). Non-current derivative financial instruments 2016 2015 Notional value US$m Assets US$m Liabilities US$m Notional value US$m Assets US$m Liabilities US$m Fair value hedges Interest rate swaps 3,916 347 (11) 3,504 289 (1) Cash flow hedges Forward foreign currency contracts 181 – (2) 135 1 (1) Cross currency swaps 210 99 – 420 206 – Commodity contracts 64 – (5) 45 2 (3) Net investment hedges Cross currency swaps 84 17 – 264 123 – Held for trading Interest rate swaps 600 24 (5) 1,600 64 (5) Cross currency swaps 274 78 (2) 170 85 – Commodity contracts 4 – (1) – – – 5,333 565 (26) 6,138 770 (10) Financing-related non-current derivative financial instruments amount to a net asset of US$547 million (2015: US$761 million). Derivatives designated as hedging instruments (i) Fair value hedges The group has entered into interest rate swaps to pay floating and receive fixed interest which have been designated as fair value hedges to hedge exposure to changes in the fair value of its US dollar, euro and Australian dollar fixed rate borrowings. Borrowings are designated as the hedged item as part of the fair value hedge. The borrowings and the interest rate swaps have the same critical terms. As at 31 March 2016 the carrying value of the hedged borrowings was US$5,782 million (2015: US$4,363 million). (ii) Cash flow hedges The group has entered into forward exchange contracts designated as cash flow hedges to manage short-term foreign currency exposures to expected net operating costs including future trade imports and exports. The group has entered into cross currency swaps designated as cash flow hedges to manage foreign currency exposures on interest payments. The group has entered into commodity contracts designated as cash flow hedges to manage the future price of commodities. As at 31 March 2016 the notional amount of forward contracts for the purchase price of aluminium was US$128 million (2015: US$115 million), of corn was US$26 million (2015: US$21 million), of sugar was US$9 million (2015: US$4 million) and of diesel was US$4 million (2015: US$2 million). Notes to the consolidated financial statements continued 146 SABMiller plc Annual Report 2016
  • 151.
    22. Derivative financialinstruments continued The following table indicates the period in which the cash flows associated with derivatives that are cash flow hedges are expected to occur and impact the income statement. Carrying amount US$m Expected cash flows US$m Less than 1 year US$m Between 1 and 2 years US$m Between 2 and 5 years US$m Over 5 years US$m At 31 March 2016 Forward foreign currency contracts (32) (62) (56) (6) – – Commodity contracts (14) (18) (13) (5) – – Cross currency swaps 188 193 88 (2) (1) 108 142 113 19 (13) (1) 108 At 31 March 2015 Forward foreign currency contracts 21 7 8 (1) – – Commodity contracts (5) (9) (6) (2) (1) – Cross currency swaps 414 407 202 89 4 112 430 405 204 86 3 112 (iii) Hedges of net investments in foreign operations The group has entered into several forward foreign currency contracts and cross currency swaps which it has designated as hedges of net investments in its foreign subsidiaries in South Africa, the Czech Republic, Poland, Colombia and Peru to hedge the group’s exposure to foreign exchange risk on these investments, and in Australia in 2015. Analysis of notional amounts of derivative financial instruments designated as net investment hedges is as follows. Notional amounts have been translated to US dollars at the closing rate at 31 March. 2016 US$m 2015 US$m Forward foreign currency contracts: Australian dollar – 515 Colombian peso 455 439 Czech koruna 208 192 Peruvian nuevo sol 304 257 Polish zloty 189 164 South African rand 378 513 Cross currency swaps: Czech koruna 160 297 Polish zloty – 92 South African rand 95 116 1,789 2,585 Held for trading derivative financial instruments (i) Interest rate swaps The group has entered into interest rate swaps to manage exposures to fluctuations in interest rates. The derivatives are fair valued based on discounted future cash flows with gains and losses taken to the income statement. (ii) Forward foreign currency contracts The group has entered into forward foreign currency contracts to manage short-term foreign currency exposures to expected future trade imports and exports and to manage foreign currency exposures on intercompany loan balances. The derivatives are fair valued based on discounted future cash flows with gains and losses taken to the income statement. (iii) Cross currency swaps The group has entered into cross currency swaps to manage foreign currency exposures on intercompany loan balances. These derivatives are fair valued based on discounted future cash flows with gains and losses taken to the income statement. (iv) Commodity contracts The group has entered into commodity contracts to manage the future price of commodities. These derivatives are fair valued based on discounted future cash flows with gains and losses taken to the income statement. 147SABMiller plc Annual Report 2016 FINANCIALSTATEMENTS
  • 152.
    FINANCIAL STATEMENTS 22. Derivativefinancial instruments continued Fair value (loss)/gain on financial instruments recognised in the income statement 2016 US$m 2015 US$m Derivative financial instruments: Interest rate swaps (37) (39) Interest rate swaps designated as fair value hedges 28 428 Forward foreign currency contracts (117) 48 Fair value (loss)/gain on forward foreign currency contracts transferred from other comprehensive loss (17) 8 Cross currency swaps 136 52 Cross currency swaps designated as fair value hedges – (5) Ineffectiveness arising from cross currency swaps designated as net investment hedges (5) (7) Other fair value losses (1) – (13) 485 Other financial instruments: Early redemption costs (see note 4) – (48) Other fair value gains 16 17 Non-current borrowings designated as the hedged item in a fair value hedge (28) (428) Total fair value (loss)/gain on financial instruments recognised in the income statement (25) 26 Fair value gains and losses on borrowings and financing-related derivative financial instruments were recognised as part of net finance costs. Fair value gains and losses on all other derivative financial instruments were recognised in operating profit. 23. Other financial instruments disclosures Reconciliation of total financial instruments The table below reconciles the group’s accounting categorisation of financial assets and liabilities (based on initial recognition) to the classes of assets and liabilities as shown on the face of the balance sheet. Fair value through income statement US$m Loans and receivables US$m Available for sale US$m Financial liabilities held at amortised cost US$m Not categorised as a financial instrument US$m Total US$m Non- current US$m Current US$m At 31 March 2016 Assets Available for sale investments – – 19 – – 19 19 – Derivative financial instruments 846 – – – – 846 565 281 Trade and other receivables – 1,589 – – 274 1,863 121 1,742 Cash and cash equivalents – 1,430 – – – 1,430 – 1,430 Liabilities Derivative financial instruments (239) – – – – (239) (26) (213) Borrowings – – – (11,740) – (11,740) (8,814) (2,926) Trade and other payables – – – (3,347) (551) (3,898) (28) (3,870) At 31 March 2015 Assets Available for sale investments – – 21 – – 21 21 – Derivative financial instruments 1,233 – – – – 1,233 770 463 Trade and other receivables – 1,541 – – 296 1,837 126 1,711 Cash and cash equivalents – 965 – – – 965 – 965 Liabilities Derivative financial instruments (111) – – – – (111) (10) (101) Borrowings – – – (12,544) – (12,544) (10,583) (1,961) Trade and other payables – – – (3,173) (573) (3,746) (18) (3,728) Notes to the consolidated financial statements continued 148 SABMiller plc Annual Report 2016
  • 153.
    23. Other financialinstruments disclosures continued Offsetting financial assets and financial liabilities The following table provides details of financial assets and liabilities that are subject to offsetting, enforceable master netting arrangements, or similar agreements. Gross amounts of financial assets US$m Gross amounts of financial liabilities US$m Net amounts recognised in the balance sheet US$m Related amounts of financial instruments not set off in the balance sheet US$m Net amount US$m At 31 March 2016 Assets Derivative financial instruments 846 – 846 (166) 680 Cash and cash equivalents 1,446 (16) 1,430 – 1,430 Liabilities Borrowings 16 (11,756) (11,740) – (11,740) Derivative financial instruments – (239) (239) 166 (73) At 31 March 2015 Assets Derivative financial instruments 1,233 – 1,233 (111) 1,122 Cash and cash equivalents 982 (17) 965 – 965 Liabilities Borrowings 17 (12,561) (12,544) – (12,544) Derivative financial instruments – (111) (111) 111 – For the financial assets and liabilities subject to enforceable master netting arrangements or similar arrangements above, each party to the agreement will have the option to settle the amounts on a net basis in the event of default of the other party. A default event includes failure by a party to make a payment when due; failure by a party to perform any other obligation required by the agreement if such failure is not remedied within the periods defined in each contract; or bankruptcy. The group holds other receivables and borrowings balances with the same financial counterparties. Where these arrangements meet the set-off rules under IFRS, the balances have been reported net on the balance sheet. 24. Provisions Demerged entities and litigation US$m Post- retirement benefits US$m Taxation- related US$m Restructuring US$m Payroll- related US$m Onerous contracts US$m Other US$m Total US$m At 1 April 2014 113 246 216 82 55 109 62 883 Exchange adjustments (17) (51) (14) (14) (9) (15) (5) (125) Charged/(credited) to the income statement – Additional provision in year 6 27 14 29 8 7 10 101 – Amounts reversed (5) – (29) (7) – (8) (16) (65) Utilised in the year (6) (24) (4) (17) (9) (33) (12) (105) Remeasurements of defined benefit plans recorded in other comprehensive loss – 7 – – – – – 7 At 31 March 2015 91 205 183 73 45 60 39 696 Exchange adjustments (1) (26) (1) (1) (3) (1) – (33) Charged/(credited) to the income statement – Additional provision in year 4 23 9 3 19 – 34 92 – Amounts reversed (16) – (18) (29) – – (12) (75) Utilised in the year (5) (18) (39) (13) (8) (22) (11) (116) Remeasurements of defined benefit plans recorded in other comprehensive loss – (5) – – – – – (5) Transfers to trade and other payables – – – – – (15) – (15) At 31 March 2016 73 179 134 33 53 22 50 544 149SABMiller plc Annual Report 2016 FINANCIALSTATEMENTS
  • 154.
    FINANCIAL STATEMENTS 24. Provisionscontinued 2016 US$m 2015 US$m Analysed as: Current 270 358 Non-current 274 338 544 696 Demerged entities and litigation During the year ended 31 March 1998 the group recognised a provision of US$73 million for the disposal of certain demerged entities in relation to equity injections which were not regarded as recoverable, as well as potential liabilities arising on warranties and the sale agreements. During the year ended 31 March 2016 US$1 million (2015: US$1 million) of this provision was utilised in regard to costs associated with SAB Ltd’s previously disposed of remaining retail interests. The residual balance of US$4 million relates mainly to the disposal of OK Bazaars (1929) Ltd to Shoprite Holdings Ltd (Shoprite). As disclosed in previous annual reports, a number of claims were made by Shoprite in relation to the valuation of the net assets of OK Bazaars at the time of the sale and for alleged breaches by SAB Ltd of warranties contained in the sale agreements. These claims are being contested by SAB Ltd. There are US$69 million (2015: US$85 million) of provisions in respect of outstanding litigation within various operations, based on management’s expectation that the outcomes of these disputes are expected to be resolved within the forthcoming four years. While a provision for claims has been recorded, the actual outcome of the disputes and the timing of the resolution cannot be estimated by the directors at this time. The further information ordinarily required by IAS 37, ‘Provisions, contingent liabilities and contingent assets’ has not been disclosed on the grounds that it can be expected to seriously prejudice the outcome of the disputes. Post-retirement benefits The provision for post-retirement benefits represents the provision for medical benefits for retired employees and their dependants in South Africa, for post-retirement medical and life insurance benefits for eligible employees and their dependants in Europe, medical and other benefits in Latin America, and pension provisions for employees primarily in Latin America, Asia Pacific and Europe. The principal assumptions on which these provisions are based are disclosed in note 30. Taxation-related The group has recognised various provisions in relation to taxation exposures it believes may arise. The provisions principally relate to non-corporate taxation and interest and penalties on corporate taxation in respect of a number of group companies. Any settlement in respect of these amounts will occur as and when the assessments are finalised with the respective tax authorities. Restructuring This includes the remaining provision for restructuring costs in Australia and Europe which are expected to be utilised over the course of the next three years. Payroll-related This principally relates to employee entitlement provisions of US$24 million (2015: US$23 million) in Asia Pacific and employee long service awards of US$13 million (2015: US$15 million) in South Africa. Onerous contracts This includes provisions for unfavourable supply contracts for malt, glass, aluminium cans and concentrated fruit juice for non-alcoholic beverages, as well as provisions for surplus property leases in Australia which management expects to be utilised within four years. Other provisions Included within other provisions are environmental provisions and other provisions. These are primarily expected to be utilised within four years. Notes to the consolidated financial statements continued 150 SABMiller plc Annual Report 2016
  • 155.
    25. Share capital 2016 US$m 2015 US$m Groupand company Called up, allotted and fully paid share capital 1,679,641,620 ordinary shares of 10 US cents each (2015: 1,675,670,012) 168 168 50,000 deferred shares of £1.00 each (2015: 50,000) – – 168 168 Ordinary shares of 10 US cents each Deferred shares of £1 each Nominal value US$m At 1 April 2014 1,672,647,930 50,000 167 Issue of shares – share incentive plans 3,022,082 – 1 At 31 March 2015 1,675,670,012 50,000 168 Issue of shares – share incentive plans 3,971,608 – – At 31 March 2016 1,679,641,620 50,000 168 Changes to authorised share capital With effect from 1 October 2009 the company adopted new articles of association which removed any previous limit on the authorised share capital. Directors are still limited as to the number of shares they can at any time allot because allotment authority continues to be required under the Companies Act 2006, save in respect of employee share plans. Changes to issued share capital During the year the company issued 3,971,608 (2015: 3,022,082) new ordinary shares of 10 US cents to satisfy the exercise of options granted under the group’s share purchase, option and award schemes, for consideration of US$97 million (2015: US$62 million). Rights and restrictions relating to share capital Convertible participating shares Convertible participating shares were originally issued to Altria as part of the Miller Brewing Company transaction in 2002 but were subsequently converted into ordinary shares. There are no convertible participating shares currently in issue. Altria is however entitled to require the company to convert its ordinary shares back into convertible participating shares so as to ensure that Altria’s voting shareholding does not exceed 24.99% of the total voting shareholding. If Altria’s ordinary shares were converted into convertible participating shares, the convertible participating shares would rank pari passu with the ordinary shares of the company in relation to a distribution of the profits of the company and a return of capital. On a poll vote at general meetings of the company, Altria would be entitled to vote in respect of its convertible participating shares on the basis of one-tenth of a vote for every convertible participating share on all resolutions other than a resolution: (i) proposed by any person other than Altria, to wind up the company; (ii) proposed by any person other than Altria, to appoint an administrator or to approve any arrangement with the company’s creditors; (iii) proposed by the board, to sell all or substantially all of the undertaking of the company; or (iv) proposed by any person other than Altria, to alter any of the class rights attaching to the convertible participating shares or to approve the creation of any new class of shares, in which case Altria would be entitled on a poll to vote on the resolution on the basis of one vote for each convertible participating share. 151SABMiller plc Annual Report 2016 FINANCIALSTATEMENTS
  • 156.
    FINANCIAL STATEMENTS 25. Sharecapital continued Conversion into ordinary shares If Altria’s ordinary shares are converted into convertible participating shares, the provisions governing possible conversion back into ordinary shares would apply. These state that upon a transfer of convertible participating shares by Altria to any person other than to an affiliate of Altria, such convertible participating shares shall convert into ordinary shares. In addition, Altria is entitled to require the company to convert its convertible participating shares into ordinary shares in the event of a takeover offer for the company, or a third party acquiring more than a 24.99% voting shareholding, provided certain conditions are met. The company must use its best endeavours to procure that the ordinary shares arising on conversion of the convertible participating shares are admitted to the Official List and to trading on the London Stock Exchange’s market for listed securities, admitted to listing and trading on the JSE Ltd, and admitted to listing and trading on any other stock exchange upon which the ordinary shares are from time to time listed and traded, but no admission to listing or trading need be sought for the convertible participating shares while they remain convertible participating shares. Deferred shares The deferred shares do not carry any voting rights and do not entitle their holders to receive any dividends or other distributions. In the event of a winding up deferred shareholders would receive no more than the nominal value. Deferred shares represent the only non-equity share capital of the group. Share-based incentives The group operates various share incentive plans. The share incentives outstanding are summarised as follows. Scheme 2016 Number 2015 Number GBP share options 8,052,528 10,620,013 ZAR share options 4,511,775 7,301,172 GBP stock appreciation rights (SARs) 9,185,858 7,083,490 ZAR stock appreciation rights (SARs) 2,479,045 1,846,842 GBP performance share awards 6,502,184 6,289,875 GBP value share awards 13,611,179 11,269,028 Total share incentives outstanding1 44,342,569 44,410,420 1 Total share incentives outstanding exclude shares relating to the BBBEE scheme. Based on the TSR performance to 31 March 2016, only 858,391 of the theoretical maximum 13,611,179 GBP value share awards would vest. Incentives involving 7,778,764 shares were granted, and 5,201,439 share incentives were exercised, released or lapsed after 31 March 2016 and before the date of signing of these financial statements. Further details relating to all of the share incentive schemes can be found in the directors’ remuneration report on pages 74 to 92. The exercise prices of incentives outstanding at 31 March 2016 ranged from £0 to £35.64 and ZAR96.95 to ZAR651.00 (2015: £0 to £35.64 and ZAR96.95 to ZAR611.99). The movement in share awards outstanding is summarised in the following tables. GBP share options GBP share options include share options granted under the Executive Share Option Plan 2008, the Approved Executive Share Option Plan 2008, the Executive Share Option (No.2) Scheme, the Approved Executive Share Option Scheme and the International Employee Share Scheme. No further grants can be made under the now closed Executive Share Option (No.2) Scheme, the Approved Executive Share Option Scheme, or the International Employee Share Scheme, although outstanding grants may still be exercised until they reach their expiry date. Number of options Weighted average exercise price GBP Weighted average fair value at grant date GBP Outstanding at 1 April 2014 16,035,174 19.36 – Granted 240,700 33.13 5.62 Lapsed (416,624) 23.47 – Exercised (5,239,237) 17.03 – Outstanding at 31 March 2015 10,620,013 20.66 – Granted 248,108 34.94 5.60 Lapsed (490,200) 24.24 – Exercised (2,325,393) 18.02 – Outstanding at 31 March 2016 8,052,528 21.64 – Notes to the consolidated financial statements continued 152 SABMiller plc Annual Report 2016
  • 157.
    25. Share capitalcontinued ZAR share options Share options designated in ZAR include share options granted under the South African Executive Share Option Plan 2008 and the Mirror Executive Share Purchase Scheme (South Africa). No further grants can be made under the Mirror Executive Share Purchase Scheme (South Africa), although outstanding grants may still be exercised until they reach their expiry date. Number of options Weighted average exercise price ZAR Weighted average fair value at grant date ZAR Outstanding at 1 April 2014 10,108,718 277.52 – Lapsed (242,037) 381.69 – Exercised (2,565,509) 224.27 – Outstanding at 31 March 2015 7,301,172 292.77 – Lapsed (133,368) 389.06 – Exercised (2,656,029) 261.89 – Outstanding at 31 March 2016 4,511,775 308.10 – GBP SARs GBP SARs include stock appreciation rights granted under the Stock Appreciation Rights Plan 2008 and the International Employee Stock Appreciation Rights Scheme. No further grants can be made under the now closed International Employee Stock Appreciation Rights Scheme, although outstanding grants may still be exercised until they reach their expiry date. Number of SARs Weighted average exercise price GBP Weighted average fair value at grant date GBP Outstanding at 1 April 2014 5,170,646 27.25 – Granted 2,971,414 33.13 5.65 Lapsed (537,598) 31.96 – Exercised (520,972) 13.91 – Outstanding at 31 March 2015 7,083,490 30.34 – Granted 3,033,727 34.94 5.55 Lapsed (377,901) 33.44 – Exercised (553,458) 16.90 – Outstanding at 31 March 2016 9,185,858 32.54 – ZAR SARs ZAR SARs include stock appreciation rights granted under the South African Stock Appreciation Rights Sub-Plan 2008. Number of SARs Weighted average exercise price ZAR Weighted average fair value at grant date ZAR Outstanding at 1 April 2014 1,178,200 527.49 – Granted 824,378 590.38 160.13 Lapsed (133,946) 554.28 – Exercised (21,790) 578.78 – Outstanding at 31 March 2015 1,846,842 553.02 – Granted 841,690 651.00 170.09 Lapsed (192,787) 569.99 – Exercised (16,700) 550.64 – Outstanding at 31 March 2016 2,479,045 584.98 – 153SABMiller plc Annual Report 2016 FINANCIALSTATEMENTS
  • 158.
    FINANCIAL STATEMENTS 25. Sharecapital continued GBP performance share awards GBP performance share awards include awards made under the Executive Share Award Plan 2008, the Performance Share Award Scheme and the International Performance Share Award Sub-Scheme. No further awards can be made under the Performance Share Award Scheme and the International Performance Share Award Sub-Scheme, although outstanding awards remain and will vest, subject to the achievement of their respective performance conditions on their vesting date. Number of awards Weighted average exercise price GBP Weighted average fair value at grant date GBP Outstanding at 1 April 2014 6,802,427 – – Granted 2,148,339 – 30.81 Lapsed (1,455,340) – – Released to participants (1,205,551) – – Outstanding at 31 March 2015 6,289,875 – – Granted 3,057,295 – 34.18 Lapsed (2,840,638) – – Released to participants (4,348) – – Outstanding at 31 March 2016 6,502,184 – – GBP value share awards The 3,167,663 (2015: 3,295,212) value share awards granted during the year ended 31 March 2016 represent the theoretical maximum number of awards that could possibly vest in the future, although in practice it is extremely unlikely that this number of awards would be released. Number of value shares (per £10 million of additional value) Theoretical maximum shares at cap Weighted average exercise price GBP Weighted average fair value at grant date GBP Outstanding at 1 April 2014 2,848 11,297,444 – – Granted 680 3,295,212 – 8.18 Lapsed (368) (3,011,712) – – Released to participants (485) (311,916) – – Outstanding at 31 March 2015 2,675 11,269,028 – – Granted 563 3,167,663 – 6.84 Lapsed – (705,472) – – Released to participants (148) (120,040) – – Outstanding at 31 March 2016 3,090 13,611,179 – – Of the value share awards released, 37,503 (2015: 328,554) shares were deferred and remain subject to a risk of forfeiture. Notes to the consolidated financial statements continued 154 SABMiller plc Annual Report 2016
  • 159.
    25. Share capitalcontinued Outstanding share incentives The following table summarises information about share incentives outstanding at 31 March. Range of exercise prices Number 2016 Weighted average remaining contractual life in years 2016 Number 2015 Weighted average remaining contractual life in years 2015 GBP share options £8 – £9 – – 7,650 0.1 £9 – £10 – – 12,500 3.6 £10 – £11 58,150 2.1 439,100 1.8 £11 – £12 359,543 1.1 535,643 2.1 £12 – £13 1,226,071 2.8 1,637,418 3.8 £19 – £20 1,249,098 4.2 1,544,924 5.2 £20 – £21 23,200 4.7 23,200 5.7 £22 – £23 1,803,948 5.2 2,112,785 6.2 £23 – £24 2,385,125 6.2 3,545,118 7.2 £28 – £29 35,400 6.7 67,739 7.7 £31 – £32 3,804 7.7 3,804 8.7 £33 – £34 662,112 7.5 688,280 8.5 £34 – £35 244,225 9.2 – – £35 – £36 1,852 8.7 1,852 9.7 8,052,528 5.1 10,620,013 5.8 ZAR share options R90 – R100 – – 13,000 0.1 R120 – R130 – – 201,243 1.0 R140 – R150 278,900 2.2 426,900 3.2 R150 – R160 82,300 3.1 307,450 3.9 R160 – R170 93,000 1.1 126,950 2.1 R180 – R190 307,150 1.9 450,600 2.9 R210 – R220 425,500 3.8 723,400 4.8 R220 – R230 486,900 4.7 719,200 5.7 R250 – R260 141,100 5.2 256,350 6.2 R290 – R300 771,501 5.7 1,216,459 6.7 R310 – R320 255,650 6.2 485,300 7.2 R400 – R410 1,169,474 6.7 1,845,320 7.7 R510 – R520 500,300 7.2 529,000 8.2 4,511,775 5.2 7,301,172 6.0 GBP SARs £8 – £9 – – 2,000 0.1 £10 – £11 11,167 0.3 248,625 1.1 £11 – £12 249,918 1.1 354,751 2.1 £12 – £13 194,501 2.3 256,968 3.3 £13 – £14 8,700 1.6 8,700 2.6 £19 – £20 37,300 4.2 40,000 5.2 £22 – £23 43,600 5.2 46,600 6.2 £23 – £24 48,000 6.2 53,100 7.2 £31 – £32 20,196 7.7 31,496 8.7 £33 – £34 5,601,273 7.6 6,011,659 8.6 £34 – £35 2,949,105 9.2 7,493 9.9 £35 – £36 22,098 8.7 22,098 9.7 9,185,858 7.8 7,083,490 7.8 155SABMiller plc Annual Report 2016 FINANCIALSTATEMENTS
  • 160.
    FINANCIAL STATEMENTS 25. Sharecapital continued Range of exercise prices Number 2016 Weighted average remaining contractual life in years 2016 Number 2015 Weighted average remaining contractual life in years 2015 ZAR SARs R520 – R530 985,000 7.7 1,097,800 8.7 R580 – R590 677,488 8.2 732,556 9.2 R610 – R620 16,486 8.7 16,486 9.7 R650 – R660 800,071 9.2 – – 2,479,045 8.3 1,846,842 8.9 GBP performance share awards £0 6,502,184 1.5 6,289,875 1.2 GBP value share awards £0 13,611,179 1.7 11,269,028 2.2 Total share incentives outstanding 44,342,569 4.3 44,410,420 4.7 Exercisable share incentives The following table summarises information about exercisable share incentives outstanding at 31 March. Number 2016 Weighted average exercise price 2016 Number 2015 Weighted average exercise price 2015 GBP share options 6,772,525 19.93 6,106,401 17.28 ZAR share options 4,029,175 283.79 4,503,152 221.77 GBP SARs 689,386 16.89 1,053,044 14.36 ZAR SARs 34,100 567.08 11,500 545.96 Share incentives exercised or released The weighted average market prices of the group’s shares at the date of exercise or release for share incentives exercised or released during the year were as follows. Number 2016 Weighted average market price 2016 Number 2015 Weighted average market price 2015 Share incentives designated in GBP 3,003,239 37.69 7,277,676 34.46 Share incentives designated in ZAR 2,672,729 807.93 2,587,299 618.50 Total share incentives exercised or released during the year 5,675,968 9,864,975 Broad-Based Black Economic Empowerment (BBBEE) scheme On 9 June 2010 the initial allocation of participation rights was made in relation to the BBBEE scheme in South Africa. A total of 46.2 million new shares in The South African Breweries (Pty) Ltd (SAB), representing 8.45% of SAB’s enlarged issued share capital, were issued. The shares in SAB will be exchanged at the end of the estimated 10-year scheme term for shares in SABMiller plc based on a repurchase formula linked, inter alia, to the operating performance of SAB. No performance conditions and exercise prices are attached to these shares, although the employee component has a four-year vesting period. The weighted average fair value of each SAB share at the grant date was ZAR40. Weighted average fair value assumptions The fair value of services received in return for share awards granted is measured by reference to the fair value of share awards granted. The estimate of the fair value of the services received is measured based on a binomial model approach except for the awards under Performance Share Award schemes, the Executive Share Award Plan 2008 (including value share awards) and the BBBEE scheme which have been valued using Monte Carlo simulations. The Monte Carlo simulation methodology is necessary for valuing share-based payments with TSR performance hurdles. This is achieved by projecting SABMiller plc’s share price forwards, together with those of companies in the same comparator group, over the vesting period and/or life of the awards after considering their respective volatilities. Notes to the consolidated financial statements continued 156 SABMiller plc Annual Report 2016
  • 161.
    25. Share capitalcontinued The following weighted average assumptions were used in these option pricing models during the year. 2016 2015 Share price¹ – South African share option scheme (ZAR) 645.35 583.97 – All other schemes (GBP) 35.27 32.77 Exercise price¹ – South African share option scheme (ZAR) 651.00 590.36 – All other schemes (GBP) 12.07 12.18 Expected volatility (all schemes)² (%) 21.3 21.3 Dividend yield (all schemes) (%) 2.1 2.1 Annual forfeiture rate – South African share option scheme (%) 5.0 5.0 – All other schemes (%) 3.0 3.0 Risk-free interest rate – South African share option scheme (%) 7.2 7.5 – All other schemes (%) 1.3 1.7 ¹ The calculation is based on the weighted fair value of issues made during the year. ² Expected volatility is calculated by assessing the historical share price data in the United Kingdom and South Africa from seven years prior to the grant date. 26. Retained earnings and other reserves a. Retained earnings Treasury and EBT shares US$m Retained earnings US$m Total US$m At 1 April 2014 (659) 16,544 15,885 Profit for the year – 3,299 3,299 Other comprehensive loss – (153) (153) Remeasurements of defined benefit plans taken to other comprehensive loss – (7) (7) Share of associates’ and joint ventures’ other comprehensive loss – (216) (216) Deferred tax credit on items taken to other comprehensive loss – 70 70 Dividends paid – (1,705) (1,705) Utilisation of merger relief reserve – 358 358 Share of associates’ and joint ventures’ other reserves moves – (6) (6) Payment for purchase of own shares for share trusts (146) – (146) Utilisation of treasury and EBT shares 125 (28) 97 Credit entry relating to share-based payments – 117 117 At 31 March 2015 (680) 18,426 17,746 Profit for the year – 2,699 2,699 Other comprehensive income – 48 48 Remeasurements of defined benefit plans taken to other comprehensive income – 5 5 Share of associates’ and joint ventures’ other comprehensive income – 72 72 Deferred tax charge on items taken to other comprehensive income – (29) (29) Dividends paid – (1,860) (1,860) Utilisation of merger relief reserve – 335 335 Share of associates’ and joint ventures’ other reserves moves – 2 2 Payment for purchase of own shares for share trusts (149) – (149) Utilisation of treasury and EBT shares 28 (12) 16 Transfer between reserves – 78 78 Credit entry relating to share-based payments – 90 90 At 31 March 2016 (801) 19,806 19,005 157SABMiller plc Annual Report 2016 FINANCIALSTATEMENTS
  • 162.
    FINANCIAL STATEMENTS 26. Retainedearnings and other reserves continued Treasury and EBT shares reserve On 26 February 2009 77,368,338 SABMiller plc non-voting convertible shares were converted into ordinary shares and then acquired by the company to be held as treasury shares. While the purchase price for each share was £10.54, the whole amount of the consideration was paid between group companies. During 2016, 1,041,915 treasury shares (2015: 3,320,906 shares) were used to directly satisfy share awards and 1,426 treasury shares were transferred to the ESPP Trust (ESPPT). As at 31 March 2016 a total of 58,258,926 shares (2015: 59,302,267 shares) were held in treasury. There are three employee benefit trusts currently in operation, being the SABMiller Employees’ Benefit Trust (the EBT), the ESPPT and the SABMiller Associated Companies’ Employees’ Benefit Trust (the AC-EBT). The EBT holds shares in SABMiller plc for the purposes of the various share incentive plans, further details of which are disclosed in the directors’ remuneration report. At 31 March 2016 the EBT held 11,476,675 shares (2015: 8,997,945 shares) which cost US$357 million (2015: US$228 million) and had a market value of US$701 million (2015: US$471 million). These shares have been treated as a deduction in arriving at shareholders’ funds. The EBT used funds provided by SABMiller plc to purchase such of the shares as were purchased in the market. The costs of funding and administering the scheme are charged to the income statement in the period to which they relate. The AC-EBT holds shares in SABMiller plc for the purposes of providing share incentives for employees of companies in which SABMiller has a significant economic and strategic interest but over which it does not have management control. At 31 March 2016 and 31 March 2015 the AC-EBT did not hold any shares. The costs of funding and administering the scheme are charged to the income statement in the period to which they relate. Shares currently held in each EBT rank pari passu with all other ordinary shares, but in both cases the trustees have elected to waive dividends and decline from voting shares, except in circumstances where they may be holding shares beneficially owned by a participant. There were no beneficially owned shares in either EBT as at 31 March 2016 (2015: nil). The ESPPT holds shares in SABMiller plc for the benefit of participants in the UK Employee Share Purchase Plan which is a UK broad-based share incentive plan that was established and operated for the first time during the year. At 31 March 2016 the ESPPT held 1,426 matching shares which were transferred from treasury shares during the year. These shares have been treated as a deduction in arriving at shareholders’ funds. Shares currently held in the ESPPT rank pari passu with all other ordinary shares. The costs of funding and administering the scheme are charged to the income statement in the period to which they relate. b. Other reserves The analysis of other reserves is as follows. Foreign currency translation reserve US$m Cash flow hedging reserve US$m Net investment hedging reserve US$m Available for sale reserve US$m Total US$m At 1 April 2014 (539) 11 (176) 2 (702) Currency translation differences (5,308) – – – (5,308) Net investment hedges – – 608 – 608 Cash flow hedges – 30 – – 30 Deferred tax on items taken to other comprehensive loss – (3) – – (3) Share of associates’ and joint ventures’ other comprehensive loss (79) (3) – – (82) At 31 March 2015 (5,926) 35 432 2 (5,457) Currency translation differences (1,176) – – – (1,176) Net investment hedges – – 88 – 88 Cash flow hedges – (64) – – (64) Transfer between reserves (78) – – – (78) Deferred tax on items taken to other comprehensive income – 18 – – 18 Share of associates’ and joint ventures’ other comprehensive loss (54) (35) – – (89) At 31 March 2016 (7,234) (46) 520 2 (6,758) Foreign currency translation reserve The foreign currency translation reserve comprises all translation exchange differences arising on the retranslation of opening net assets together with differences between income statements translated at average and closing rates. Notes to the consolidated financial statements continued 158 SABMiller plc Annual Report 2016
  • 163.
    27a. Reconciliation ofprofit for the year to net cash generated from operations 2016 US$m 2015 US$m Profit for the year 2,922 3,557 Taxation 1,152 1,273 Share of post-tax results of associates and joint ventures (1,126) (1,083) Net finance costs 506 637 Operating profit 3,454 4,384 Depreciation: – Property, plant and equipment 538 602 – Containers 205 219 Container breakages, shrinkages and write-offs 41 57 Profit on disposal of businesses – (45) Profit on disposal of available for sale investments – (1) Profit on disposal of investments in associates – (403) Gain on dilution of investment in associates – (2) Profit on disposal of property, plant and equipment (34) (18) Loss on disposal of intangibles 2 – Amortisation of intangible assets 352 410 Impairment of goodwill – 286 Impairment of intangible assets – 6 Impairment of property, plant and equipment 7 73 Impairment of investment in associate 372 – Impairment of working capital balances 44 68 Amortisation of advances to customers 34 35 Unrealised net fair value losses/(gains) on derivatives included in operating profit 20 (15) Dividends received from other investments – (1) Charge with respect to share options 83 112 Charge with respect to Broad-Based Black Economic Empowerment scheme 7 5 Other non-cash movements (70) (92) Net cash generated from operations before working capital movements 5,055 5,680 Increase in inventories (112) (30) Increase in trade and other receivables (204) (218) Increase in trade and other payables 422 396 Decrease in provisions (41) (13) Decrease in post-retirement benefit provisions (4) (3) Net cash generated from operations 5,116 5,812 27b. Reconciliation of net cash generated from operating activities to free cash flow 2016 US$m 2015 US$m Net cash generated from operating activities 3,415 3,722 Purchase of property, plant and equipment (1,210) (1,394) Proceeds from sale of property, plant and equipment 74 68 Purchase of intangible assets (103) (178) Investments in joint ventures (301) (216) Investments in associates (4) (3) Dividends received from joint ventures 998 976 Dividends received from associates 253 430 Dividends received from other investments – 1 Dividends paid to non-controlling interests (153) (173) Free cash flow 2,969 3,233 159SABMiller plc Annual Report 2016 FINANCIALSTATEMENTS
  • 164.
    FINANCIAL STATEMENTS 27c. Analysisof net debt Cash and cash equivalents on the balance sheet are reconciled to cash and cash equivalents on the cash flow statement as follows. 2016 US$m 2015 US$m Cash and cash equivalents (balance sheet) 1,430 965 Overdrafts (159) (215) Cash and cash equivalents (cash flow statement) 1,271 750 Net debt is analysed as follows. Cash and cash equivalents (excluding overdrafts) US$m Overdrafts US$m Borrowings US$m Derivative financial instruments US$m Finance leases US$m Gross debt US$m Net debt US$m At 1 April 2014 2,081 (213) (16,783) 663 (51) (16,384) (14,303) Exchange adjustments (157) 40 713 (51) 6 708 551 Principal-related cash flows (959) (42) 3,819 (243) 10 3,544 2,585 Other movements – – (25) 745 (18) 702 702 At 31 March 2015 965 (215) (12,276) 1,114 (53) (11,430) (10,465) Exchange adjustments (134) 19 27 4 4 54 (80) Principal-related cash flows 598 37 783 (547) 10 283 881 Acquisitions – through business combinations 1 – (7) – (3) (10) (9) Other movements – – (47) 101 (19) 35 35 At 31 March 2016 1,430 (159) (11,520) 672 (61) (11,068) (9,638) 27d. Major non-cash transactions Major non-cash transactions included the following. In 2016 impairments relating to the group’s investment in Castel’s operations in Angola and property, plant and equipment in South Sudan. In 2016 the loan guarantee provision in Angola. In 2016 the release of provisions following the successful resolution of certain claims in Australia. In 2016 accelerated depreciation incurred in relation to the closure of MillerCoors’ Eden brewery. In 2016 the group’s share of the gain realised on the change of control arising from Castel’s acquisition of further interests in its Tunisian operation. In 2015 impairment charges relating to the group’s business in India in Asia Pacific and the group’s share of the impairment charges taken by Anadolu Efes in relation to its beer businesses in Russia and Ukraine. Additionally, impairment charges in Australia including those in 2015 relating to the pending closure of the Campbelltown cidery and Port Melbourne brewery. Additional profit realised in 2015 on the disposal of the group’s Angolan operations to Castel in Africa in 2012. In 2015 the recycling of foreign currency translation reserves following the repayment of an intercompany loan. 28. Acquisitions and disposals Acquisitions In June 2015, the group acquired 100% of Meantime Brewing Company Ltd, a modern UK craft brewer, with a brewery in Greenwich, London and a number of retail sites for consideration of US$191 million net of cash acquired. The business combination has been accounted for using the acquisition method. Notes to the consolidated financial statements continued 160 SABMiller plc Annual Report 2016
  • 165.
    29. Commitments, contingenciesand guarantees a. Operating lease commitments The minimum lease rentals to be paid under non-cancellable leases at 31 March are as follows. 2016 US$m 2015 US$m Land and buildings Within one year 66 67 Later than one year and less than five years 78 134 After five years 18 24 162 225 Plant, vehicles and systems Within one year 42 43 Later than one year and less than five years 59 79 After five years 3 11 104 133 b. Other commitments 2016 US$m 2015 US$m Capital commitments not provided in the financial information Contracts placed for future expenditure for property, plant and equipment 190 151 Contracts placed for future expenditure for intangible assets 1 1 Share of capital commitments of joint ventures 65 66 Other commitments not provided in the financial information Contracts placed for future expenditure 1,294 1,799 Share of joint ventures’ other commitments 512 390 Contracts placed for future expenditure in 2016 primarily relate to minimum purchase commitments for raw materials and packaging materials, which are principally due between 2016 and 2021. The group’s share of joint ventures’ other commitments primarily relate to MillerCoors’ various long-term non-cancellable advertising and promotion commitments. c. Contingent liabilities and guarantees 2016 US$m 2015 US$m Guarantees to third parties¹ 11 9 Other contingent liabilities 6 6 17 15 ¹ Guarantees to third parties Theseprimarily relate to guarantees given by Grolsch and Nile Breweries Ltd to banks in relation to loans taken out by third party trade customers and suppliers respectively, and by SABMiller plc in relation to loans taken out by non-controlling interests in Ethiopia. Other SABMiller and Altria entered into a tax matters agreement (the Agreement) on 30 May 2002 to regulate the conduct of tax matters between them with regard to the acquisition of Miller and to allocate responsibility for contingent tax costs. SABMiller has agreed to indemnify Altria against any taxes, losses, liabilities and costs that Altria incurs arising out of or in connection with a breach by SABMiller of any representation, agreement or covenant in the Agreement, subject to certain exceptions. The group has a number of activities in a wide variety of geographic areas and is subject to certain legal claims incidental to its operations. In the opinion of the directors, after taking appropriate legal advice, these claims are not expected to have, either individually or in aggregate, a material adverse effect upon the group’s financial position, except insofar as already provided in the consolidated financial statements. The group has exposures to various environmental risks. Although it is difficult to predict the group’s liability with respect to these risks, future payments, if any, would be expected to be made over a period of time in amounts that would not be material to the group’s financial position, except insofar as already provided in the consolidated financial statements. As a result of the AB InBev offer, the group has various commitments which are contingent on the completion of the transaction, including advisers’ fees and staff-related costs, principally reflecting the impact of accelerated vesting of share-based compensation. These contingent liabilities, which have not been recognised in the group’s results for the year ended 31 March 2016, are estimated to range from US$250 million to US$300 million. 161SABMiller plc Annual Report 2016 FINANCIALSTATEMENTS
  • 166.
    FINANCIAL STATEMENTS 30. Pensionsand post-retirement benefits The group operates a number of pension schemes throughout the world. These schemes have been designed and are administered in accordance with local conditions and practices in the countries concerned and include both defined contribution and defined benefit schemes. The majority of the schemes are funded and the schemes’ assets are held independently of the group’s finances. The assets of the schemes do not include any of the group’s own financial instruments, nor any property occupied by or other assets used by the group. Pension and post-retirement benefit costs are assessed in accordance with the advice of independent professionally qualified actuaries. Generally, the projected unit method is applied to measure the defined benefit scheme liabilities. The group also provides medical benefits, which are mainly unfunded, for retired employees and their dependants in South Africa, the Netherlands and Latin America. The total pension and post-retirement medical benefit costs recognised in the income statement are as follows. 2016 US$m 2015 US$m Defined contribution scheme costs 89 98 Defined benefit pension plan costs 18 19 Post-retirement medical and other benefit costs 5 8 The amounts recognised in the balance sheet are determined as follows. 2016 US$m 2015 US$m Portion of defined benefit obligation that is partly or wholly funded (405) (405) Fair value of plan assets 473 457 Surplus of funded plans 68 52 Impact of asset ceiling (73) (57) Deficit of funded plans (5) (5) Portion of defined benefit obligation that is unfunded (109) (124) Medical and other post-retirement benefits (65) (76) Provisions for defined benefit plans (179) (205) Accruals for defined contribution plans (4) (4) The group operates various defined contribution and defined benefit schemes. Details of the main defined benefit schemes are provided below. Latin America pension plans The group operates a number of pension plans throughout Latin America. Details of the major plan are provided below. The Colombian Labour Code Pension Plan is an unfunded plan of the defined benefit type and covers all salaried and hourly employees in Colombia who are not covered by social security or who have at least 10 years of service prior to 1 January 1967. The plan is financed entirely through company reserves and there are no external assets. The most recent actuarial valuation of the Colombian Labour Code Pension Plan was carried out by independent professionally qualified actuaries at 28 February 2016 using the projected unit credit method. All salaried employees are now covered by social security or private pension fund provisions. The principal economic assumptions used in the preparation of the pension valuations are shown below and take into consideration changes in the Colombian economy. Grolsch pension scheme The Grolsch pension scheme, named Stichting Pensioenfonds van de Grolsche Bierbrouwerij, is a funded plan of the defined benefit type, based on average salary with assets held in separately administered funds. The pension scheme is managed through a separate entity with its own board. The latest valuation of the Grolsch pension scheme was carried out at 31 March 2016 by an independent actuary using the projected unit credit method. Carlton & United Breweries pension scheme The Carlton & United Breweries pension scheme is a superannuation fund that provides accumulation style and defined benefits to employees. The company funds the defined benefits, administration and insurance costs of the scheme as a benefit to employees who elect to be members of this scheme. The board of trustees is responsible for the governance of the scheme on behalf of the members. The latest actuarial valuation of the Carlton & United Breweries pension scheme was carried out at 30 June 2014 by an independent actuary using the projected unit credit method. The valuation update for the scheme was carried out at 31 March 2016 by an independent actuary. The defined benefits section is now closed to new members. Notes to the consolidated financial statements continued 162 SABMiller plc Annual Report 2016
  • 167.
    30. Pensions andpost-retirement benefits continued South Africa pension schemes The group operates a number of pension schemes throughout South Africa. Details of the major schemes are provided below. The ABI Pension Fund, Suncrush Pension Fund and Suncrush Retirement Fund are funded schemes of the defined benefit type based on average salary with assets held in separately administered funds. The governance of the schemes is the responsibility of the boards of trustees on behalf of the members, subject to the provisions of local legislation and the rules for each scheme. The ABI Pension Fund no longer has any active or pensioner members. There are surplus assets remaining in the scheme that will be distributed to former members. The Suncrush Pension Fund has pensioners where the pension liabilities have been outsourced to an insurance provider. The trustees have made a provision in the fund rules for the active members such that benefits will be paid to members on exit for their benefits valued as at 1 July 2005. No further benefits are being accrued for active members. The Suncrush Retirement Fund has no liabilities and is in the process of being closed down. Risks The most significant risks the group is exposed to through its defined benefit pension plans and post-employment medical plans are as follows. Volatility of investment returns Those schemes that hold assets are exposed to volatility in investment returns on those assets, which may be higher or lower than the assumed expected return on those assets. Asset mix is varied for each individual scheme to ensure investment volatility risk is appropriately managed. Salary, pension and healthcare cost inflation risk Scheme liabilities for the defined benefit pension and post-retirement medical plans are calculated based on assumed rates of salary, pension and/or healthcare cost inflation. Increases in these inflation rates will lead to higher liabilities. Change in discount rate A decrease in corporate bond yields will result in a decrease in the discount rate and therefore an increase in scheme liabilities. This will be partially offset by an increase in the value of plan assets where the scheme holds bonds. Mortality rates The majority of the group’s obligations to provide benefits under both the defined benefit pension plans and medical and other post-retirement benefits are for the life of the member. Increases in life expectancy will result in increases in the scheme liabilities associated with the schemes. The group ensures mortality rate assumptions incorporated in the actuarial calculations of the present value of scheme liabilities are from reliable sources. Principal actuarial assumptions at 31 March (expressed as weighted averages) Defined benefit pension plans Medical and other post-retirement benefits Latin America Grolsch Other South Africa Other At 31 March 2016 Discount rate (%) 8.5 2.1 2.8 10.2 7.1 Salary inflation (%) 4.3 1.0 2.5 – – Pension inflation (%) 4.3 0.7 2.7 – – Healthcare cost inflation (%) – – – 9.1 4.0 Mortality rate assumptions – Retirement age: Males 56 67 65 63 59 Females 52 67 65 63 55 – Life expectations on retirement age: Retiring today: Males 30 22 15 16 27 Females 38 24 19 20 34 Retiring in 20 years: Males 30 24 15 16 27 Females 38 26 19 20 34 At 31 March 2015 Discount rate (%) 6.9 1.9 2.4 8.0 6.0 Salary inflation (%) 3.0 1.0 2.6 – – Pension inflation (%) 3.0 0.7 3.2 – – Healthcare cost inflation (%) – – – 7.1 2.9 Mortality rate assumptions – Retirement age: Males 56 67 65 63 58 Females 51 67 65 63 55 – Life expectations on retirement age: Retiring today: Males 23 21 15 16 22 Females 32 24 20 20 29 Retiring in 20 years: Males 23 24 16 16 22 Females 32 26 20 20 29 163SABMiller plc Annual Report 2016 FINANCIALSTATEMENTS
  • 168.
    FINANCIAL STATEMENTS 30. Pensionsand post-retirement benefits continued The movements in the defined benefit pension plan liabilities are as follows. Defined benefit pension plans Latin America Grolsch Other Total Present value of scheme liabilities US$m Present value of scheme liabilities US$m Fair value of plan assets US$m Total US$m Present value of scheme liabilities US$m Fair value of plan assets US$m Total US$m Present value of scheme liabilities US$m Fair value of plan assets US$m Total US$m At 1 April 2014 (141) (338) 408 70 (81) 71 (10) (560) 479 (81) Benefits paid 13 11 (11) – 16 (14) 2 40 (25) 15 Contributions paid by plan participants – (2) – (2) (1) – (1) (3) – (3) Employer contributions – – 7 7 – 1 1 – 8 8 Current service cost (1) (4) – (4) (3) – (3) (8) – (8) Past service cost (1) – – – – – – (1) – (1) Interest (costs)/income (9) (10) 12 2 (3) 3 – (22) 15 (7) Remeasurements: (6) (105) 95 (10) (2) 2 – (113) 97 (16) – Return on plan assets, excluding amounts included in interest income – – 95 95 – – – – 95 95 – Gain/(loss) from change in demographic assumptions 6 (2) – (2) – – – 4 – 4 – Loss from change in financial assumptions – (107) – (107) (2) – (2) (109) – (109) – Experience (losses)/gains (12) 4 – 4 – 2 2 (8) 2 (6) Exchange adjustments 32 92 (106) (14) 14 (11) 3 138 (117) 21 At 31 March 2015 (113) (356) 405 49 (60) 52 (8) (529) 457 (72) Benefits paid 9 10 (10) – 5 (4) 1 24 (14) 10 Contributions paid by plan participants – (2) – (2) – – – (2) – (2) Employer contributions – – 6 6 – – – – 6 6 Current service cost (1) (5) – (5) (3) – (3) (9) – (9) Past service cost (1) – – – – – – (1) – (1) Interest (costs)/income (7) (7) 7 – (1) 1 – (15) 8 (7) Remeasurements: – 22 (6) 16 – – – 22 (6) 16 – Return on plan assets, excluding amounts included in interest income – – (6) (6) – – – – (6) (6) – Gain from change in financial assumptions 3 22 – 22 – – – 25 – 25 – Experience losses (3) – – – – – – (3) – (3) Exchange adjustments 15 (21) 24 3 2 (2) – (4) 22 18 At 31 March 2016 (98) (359) 426 67 (57) 47 (10) (514) 473 (41) Notes to the consolidated financial statements continued 164 SABMiller plc Annual Report 2016
  • 169.
    30. Pensions andpost-retirement benefits continued The fair values of assets in pension schemes are as follows. Defined benefit pension plans Latin America US$m Grolsch US$m Other US$m Total US$m At 31 March 2016 Equities – quoted – 139 11 150 Bonds – quoted – 269 12 281 Cash and cash equivalents – – 18 18 Property and other – 18 6 24 Total fair value of assets – 426 47 473 Present value of scheme liabilities (98) (359) (57) (514) (Deficit)/surplus in the scheme (98) 67 (10) (41) Unrecognised pension asset due to limit – (67) (6) (73) Pension liability recognised (98) – (16) (114) At 31 March 2015 Equities – quoted – 138 12 150 Bonds – quoted – 248 16 264 Cash and cash equivalents – 2 22 24 Property and other – 17 2 19 Total fair value of assets – 405 52 457 Present value of scheme liabilities (113) (356) (60) (529) (Deficit)/surplus in the scheme (113) 49 (8) (72) Unrecognised pension asset due to limit – (49) (8) (57) Pension liability recognised (113) – (16) (129) In respect of defined benefit pension plans in South Africa, which are included in ‘Other’, the pension asset recognised is limited to the extent that the employer is able to recover a surplus either through reduced contributions in the future or through refunds from the scheme. Pension fund assets have not been recognised as the surplus apportionment exercise required in terms of the South African legislation has not yet been completed. The pension asset recognised in respect of Grolsch is limited to the extent that the employer is able to recover a surplus either through reduced contributions in the future or through refunds from the scheme. The limit has been set equal to nil due to the terms of the pension agreement with the pension fund. 165SABMiller plc Annual Report 2016 FINANCIALSTATEMENTS
  • 170.
    FINANCIAL STATEMENTS 30. Pensionsand post-retirement benefits continued The movements in the asset ceiling are as follows. Defined benefit pension plans Grolsch US$m Other US$m Total US$m Asset ceiling at 1 April 2014 (70) (8) (78) Interest costs (2) (1) (3) Change in the asset ceiling, excluding amounts included in interest costs 9 (1) 8 Exchange adjustments 14 2 16 Asset ceiling at 31 March 2015 (49) (8) (57) Interest costs (1) – (1) Change in the asset ceiling, excluding amounts included in interest costs (12) – (12) Exchange adjustments (5) 2 (3) Asset ceiling at 31 March 2016 (67) (6) (73) The movements in the post-employment medical benefit liabilities are as follows. The obligations are wholly unfunded. Medical and other post-retirement benefits South Africa US$m Other US$m Total US$m Present value of scheme liabilities at 1 April 2014 (46) (41) (87) Benefits paid – 2 2 Employer contributions 2 – 2 Current service cost (1) (2) (3) Interest costs (4) (1) (5) Remeasurements: 1 – 1 – Loss from change in demographic assumptions – (1) (1) – Loss from change in financial assumptions (1) – (1) – Experience gains 2 1 3 Exchange adjustments 6 8 14 Present value of scheme liabilities at 31 March 2015 (42) (34) (76) Benefits paid – 2 2 Employer contributions 2 – 2 Current service cost (1) – (1) Interest costs (3) (1) (4) Remeasurements: 4 (3) 1 – Gain from change in financial assumptions 1 1 2 – Experience gains/(losses) 3 (4) (1) Exchange adjustments 7 4 11 Present value of scheme liabilities at 31 March 2016 (33) (32) (65) Notes to the consolidated financial statements continued 166 SABMiller plc Annual Report 2016
  • 171.
    30. Pensions andpost-retirement benefits continued The sensitivity of the pension plan and medical and other post-retirement benefit liabilities at 31 March 2016 to changes in the principal actuarial assumptions is as follows. Defined benefit pension plans Medical and other post-retirement benefits Change in assumption Increase US$m Decrease US$m Increase US$m Decrease US$m Discount rate 1% 69 90 5 6 Salary growth rate 1% 7 6 – – Pension growth rate 1% 83 47 – – Life expectancy 1 year 11 11 2 2 Healthcare cost inflation 1% – – 6 5 The above sensitivity analyses assume a change in a single assumption while all other assumptions are held constant. When calculating the sensitivities, the present value of the defined benefit obligation has been calculated using the projected unit credit method at the end of the reporting period, consistent with the method used to calculate the defined benefit obligation recognised in the balance sheet. The methods and assumptions used to prepare the sensitivity analyses are consistent with those used in the prior year. For funded defined benefit plans, the group is required to provide funding where the fair value of the assets of the scheme are not sufficient to meet the defined benefit obligations. The South Africa pension schemes no longer have any active members, therefore, funding will only be required in the event that the scheme becomes less than 100% funded. The remaining funded defined benefit plans are funded using recommendations provided by the scheme’s actuaries. Contributions expected to be paid into the group’s major defined benefit schemes during the year ending 31 March 2017 are US$18 million. The weighted average duration of the defined benefit obligation is 16 years. 31. Related party transactions a. Parties with significant influence over the group: Altria Group, Inc (Altria) and the Santo Domingo Group (SDG) Altria is considered to be a related party of the group by virtue of its 26.7% equity shareholding. There were no transactions with Altria during the year. SDG is considered to be a related party of the group by virtue of its 14.0% equity shareholding in SABMiller plc. During the year the group made purchases of logistics services and natural gas from SDG companies totalling US$5 million (2015: US$nil). At 31 March 2016 US$1 million (2015: US$nil) was owing to SDG companies. b. Associates and joint ventures Details relating to transactions with associates and joint ventures are analysed below. 2016 US$m 2015 US$m Purchases from associates1 (165) (173) Purchases from joint ventures2 (103) (88) Sales to associates3 38 9 Sales to joint ventures4 19 21 Dividends received from associates5 253 423 Dividends received from joint ventures6 998 976 Royalties received from associates7 16 18 Royalties received from joint ventures8 14 1 Management fees, guarantee fees and other recoveries received from associates9 14 14 Marketing fees paid to associates10 (1) (1) Management fees paid to joint ventures11 (2) (2) Management fees received from joint ventures12 1 – 1 The group purchased canned Coca-Cola products for resale from Coca-Cola Canners of Southern Africa (Pty) Ltd (Coca-Cola Canners); inventory from Distell Group Ltd (Distell), Associated Fruit Processors (Pty) Ltd (AFP) and Delta Corporation Ltd (Delta); and in 2015 accommodation from Tsogo Sun Holdings Ltd (Tsogo Sun). 2 The group purchased lager from MillerCoors LLC (MillerCoors). 3 The group made sales of lager to Delta, Anadolu Efes Biracılık ve Malt Sanayii AS¸ (Anadolu Efes), International Trade and Supply Ltd (ITSL) and Distell, and in 2015 to Tsogo Sun. 4 The group made sales to MillerCoors. 5 The group had dividends receivable from China Resources Snow Breweries Ltd (CR Snow) of US$71 million (2015: US$228 million), Castel of US$89 million (2015: US$108 million), Coca-Cola Canners of US$10 million (2015: US$5 million), Distell of US$15 million (2015: US$18 million), Tsogo Sun of US$nil (2015: US$24 million), Delta of US$19 million (2015: US$18 million), ITSL of US$24 million (2015: US$21 million), Grolsch (UK) Ltd of US$1 million (2015: US$1 million) and Anadolu Efes of US$24 million (2015: US$nil). 6 The group received dividends from MillerCoors. 7 The group received royalties from Delta and Anadolu Efes. 8 The group received royalties from MillerCoors. 9 The group received management fees from Delta, Anadolu Efes and Castel and other recoveries from AFP. 10 The group paid marketing fees to ITSL. 11 The group paid management fees to MillerCoors. 12 The group received management fees from MillerCoors. 167SABMiller plc Annual Report 2016 FINANCIALSTATEMENTS
  • 172.
    FINANCIAL STATEMENTS 31. Relatedparty transactions continued At 31 March 2016 US$m 2015 US$m Amounts owed by associates1 15 28 Amounts owed by joint ventures2 8 4 Amounts owed to associates3 (36) (38) Amounts owed to joint ventures4 (14) (18) 1 Amounts owed by AFP, Delta, Coca-Cola Canners, Castel and Anadolu Efes. 2 Amounts owed by MillerCoors. 3 Amounts owed to AFP and Castel. 4 Amounts owed to MillerCoors. Guarantees provided in respect of associates’ bank facilities are detailed in note 21. c. Transactions with key management The group has a related party relationship with the directors of the group and members of the excom as key management. Key management compensation is provided in note 6c. 32. Post balance sheet events In May 2016 the South African Competition Tribunal approved, with agreed conditions, the formation of Coca-Cola Beverages Africa, Africa’s largest soft drinks operation. The transaction is expected to complete in early July 2016. Notes to the consolidated financial statements continued 168 SABMiller plc Annual Report 2016
  • 173.
    33. Principal subsidiaries,associates and joint ventures The principal subsidiary undertakings of the group as at 31 March were as follows. Effective interest Name Country of incorporation Principal activity 2016 2015 Corporate SABMiller Holdings Ltd United Kingdom Holding company 100% 100% SABMiller International Brands Ltd United Kingdom Trademark owner 100% 100% SABMiller Procurement GmbH Switzerland Procurement 100% 100% SABSA Holdings Ltd South Africa Holding company 100% 100% Latin American operations Bavaria SA Colombia Brewing/Soft drinks 99% 99% Cervecería Hondureña, SA de CV Honduras Brewing/Soft drinks 99% 99% Cervecería Nacional (CN) SA1 Ecuador Brewing 96% 96% Cervecería Nacional SA1 Panama Brewing 97% 97% Industrias La Constancia, SA de CV El Salvador Brewing/Soft drinks 100% 100% Unión de Cervecerías Peruanas Backus y Johnston SAA1 Peru Brewing 94% 94% African operations SABMiller Africa BV Netherlands Holding company 62% 62% SABMiller Botswana BV Netherlands Holding company 62% 62% Accra Brewery Ltd Ghana Brewing 60% 60% Cervejas de Moçambique SA1 Mozambique Brewing 49% 49% Intafact Beverages Ltd Nigeria Brewing 38% 38% International Breweries plc1 Nigeria Brewing 36% 36% Kgalagadi Breweries (Pty) Ltd Botswana Brewing/Soft drinks 31% 31% Nile Breweries Ltd Uganda Brewing 62% 62% Tanzania Breweries Ltd1 Tanzania Brewing 36% 36% The South African Breweries (Pty) Ltd South Africa Brewing/Holding company 100% 100% Zambian Breweries plc1 Zambia Brewing/Soft drinks 54% 54% Asia Pacific operations Foster’s Group Pty Ltd Australia Holding company 100% 100% CUB Pty Ltd Australia Brewing 100% 100% FBG Finance Pty Ltd Australia Financing 100% 100% FBG Treasury (Aust) Pty Ltd Australia Financing 100% 100% SABMiller Breweries Private Ltd India Brewing 100% 100% European operations Birra Peroni Srl Italy Brewing 100% 100% Grolsche Bierbrouwerij Nederland BV Netherlands Brewing 100% 100% Kompania Piwowarska SA Poland Brewing 100% 100% Miller Brands (UK) Ltd United Kingdom Sales and distribution 100% 100% Pivovary Topvar as Slovakia Brewing 100% 100% Plze ˇnský Prazdroj as Czech Republic Brewing 100% 100% Ursus Breweries SA Romania Brewing 99% 99% North American operations SABMiller Holdings Inc USA Holding company/Financing 100% 100% 1 Listed in country of incorporation. The group comprises a large number of companies. The list above includes those subsidiary undertakings which materially affect the profit or net assets of the group, or a business segment. The principal country in which each of the above subsidiary undertakings operates is the same as the country in which each is incorporated. A complete list of all subsidiary undertakings is set out in the related undertakings section in this annual report. Where the group’s nominal interest in the equity share capital of an undertaking is less than 50%, the basis on which the undertaking is a subsidiary undertaking of the group is as follows. African operations The group’s effective interest in the majority of its African operations was diluted as a result of the disposal of a 38% interest in SABMiller Africa BV and SABMiller Botswana BV on 1 April 2001, in exchange for a 20% interest in the Castel group’s African beverage interests. The operations continue to be consolidated due to the group’s majority shareholdings, and ability to control the operations. Kgalagadi Breweries (Pty) Ltd (KBL) SABMiller Botswana holds a 40% interest in Kgalagadi Breweries (Pty) Ltd with the remaining 60% interest held by Sechaba Brewery Holdings Ltd. SABMiller Botswana’s shares entitle the holder to twice the voting rights of those shares held by Sechaba Brewery Holdings Ltd. SABMiller Africa BV’s 10.1% indirect interest is held via a 16.8% interest in Sechaba Brewery Holdings Ltd. 169SABMiller plc Annual Report 2016 FINANCIALSTATEMENTS
  • 174.
    FINANCIAL STATEMENTS 33. Principalsubsidiaries, associates and joint ventures continued Associates and joint ventures The principal associates and joint ventures of the group as at 31 March are as set out below. Where the group’s interest in an associate or a joint venture is held by a subsidiary undertaking which is not wholly owned by the group, the subsidiary undertaking is indicated in a note below. Effective interest Name Country of incorporation Nature of relationship Principal activity 2016 2015 African operations BIH Brasseries Internationales Holding Ltd1 Gibraltar Associate Holding company for subsidiaries principally located in Africa 20% 20% Société des Brasseries et Glacières Internationales SA1 France Associate Holding company for subsidiaries principally located in Africa 20% 20% BIH Brasseries Internationales Holding (Angola) Ltd1 Gibraltar Associate Holding company for subsidiaries principally located in Africa 27% 27% Delta Corporation Ltd2,3 Zimbabwe Associate Brewing/Soft drinks 25% 25% Distell Group Ltd2,4 South Africa Associate Wines and spirits 27% 27% Asia Pacific operations China Resources Snow Breweries Ltd1 British Virgin Islands Associate Holding company for brewing subsidiaries located in China 49% 49% European operations Anadolu Efes Biracılık ve Malt Sanayii AS¸ 1,2 Turkey Associate Brewing/Soft drinks 24% 24% North American operations MillerCoors LLC1,5 USA Joint venture Brewing 58% 58% 1 These entities report their financial results for each 12-month period ending 31 December. 2 Listed in country of incorporation. 3 Interests in this company are held by SABMiller Africa BV which is held 62% by SABMiller Holdings Ltd. 4 This entity reports its financial results for each 12-month period ending 30 June. 5 SABMiller shares joint control of MillerCoors with Molson Coors Brewing Company under a shareholders’ agreement. Voting interests are shared equally between SABMiller and Molson Coors, and each of SABMiller and Molson Coors has equal board representation. Under the agreement SABMiller has a 58% economic interest in MillerCoors and Molson Coors has a 42% economic interest. The principal country in which each of the above associated undertakings operates is the same as the country in which each is incorporated. However, Société des Brasseries et Glacières Internationales SA, BIH Brasseries Internationales Holding Ltd’s (Castel) and BIH Brasseries Internationales Holding (Angola) Ltd’s principal subsidiaries are in Africa, China Resources Snow Breweries Ltd operates in Hong Kong and its principal subsidiaries are in the People’s Republic of China. A complete list of all associate and joint venture undertakings is set out in the related undertakings section in this annual report. Notes to the consolidated financial statements continued 170 SABMiller plc Annual Report 2016
  • 175.
    Balance sheet ofSABMiller plc at 31 March Notes 2016 US$m 2015 US$m Assets Fixed assets Intangible assets 3 133 133 Property, plant and equipment 4 48 44 Investments in subsidiaries 5 14,128 14,069 14,309 14,246 Current assets Loans and other financial assets due after more than one year 6 2,091 5,762 Trade and other receivables due after more than one year 7 15 20 Derivative financial instruments due after more than one year 8 248 388 Loans and other financial assets due within one year 6 4,639 1,142 Trade and other receivables due within one year 7 39 59 Derivative financial instruments due within one year 8 125 20 Cash and cash equivalents 9 878 449 8,035 7,840 Total assets 22,344 22,086 Liabilities Creditors due within one year Derivative financial instruments 8 (19) (32) Borrowings 10 (1,126) (460) Trade and other payables 11 (188) (125) Other financial liabilities 13 (65) (50) (1,398) (667) Net current assets 6,637 7,173 Total assets less current liabilities 20,946 21,419 Creditors due after more than one year Derivative financial instruments 8 (6) (5) Borrowings 10 (1,215) (1,223) Trade and other payables 11 (10) (10) Other financial liabilities 13 (188) (231) (1,419) (1,469) Net assets 19,527 19,950 Equity Share capital 168 168 Share premium 6,848 6,752 Merger relief reserve 14 3,628 3,963 Other reserves (1,281) (1,186) Retained earnings 10,164 10,253 Total equity 19,527 19,950 The notes on pages 173 to 185 are an integral part of these financial statements. The financial statements on pages 171 to 185 were approved by the board of directors on 10 June 2016 and were signed on its behalf by Alan Clark Domenic De Lorenzo Chief Executive Chief Financial Officer Advantage has been taken of the provisions of section 408(3) of the Companies Act 2006 which permit the omission of a separate income statement for SABMiller plc. The profit for the company for the year was US$1,367 million (2015: US$2,141 million). 171SABMiller plc Annual Report 2016 FINANCIALSTATEMENTS
  • 176.
    FINANCIAL STATEMENTS Statement ofchanges in the company’s equity for the year ended 31 March Share capital US$m Share premium US$m Merger relief reserve US$m Cashflow hedging reserve US$m EBT reserve US$m Treasury shares US$m Retained earnings US$m Total equity US$m At 1 April 2014 167 6,648 4,321 12 (168) (1,008) 9,400 19,372 Total comprehensive (loss)/income – – – (38) – – 2,141 2,103 Profit for the year – – – – – – 2,141 2,141 Other comprehensive loss – cash flow hedges fair value losses – – – (38) – – – (38) Dividends paid – – – – – – (1,696) (1,696) Issue of ordinary shares 1 61 – – – – – 62 Transfer into EBT – – – – (53) 53 – – Purchase of EBT shares – – – – (146) – – (146) Utilisation of EBT shares – – – – 112 – (112) – Utilisation of treasury shares – 43 – – – 50 – 93 Utilisation of merger relief reserve – – (358) – – – 358 – Credit entry relating to share-based payments – – – – – – 113 113 Capital contribution relating to share-based payments – – – – – – 49 49 At 31 March 2015 168 6,752 3,963 (26) (255) (905) 10,253 19,950 Total comprehensive income – – – 16 – – 1,367 1,383 Profit for the year – – – – – – 1,367 1,367 Other comprehensive income – cash flow hedges fair value gain – – – 16 – – – 16 Dividends paid – – – – – – (1,852) (1,852) Issue of ordinary shares – 84 – – – – – 84 Purchase of EBT shares – – – – (149) – – (149) Utilisation of EBT shares – – – – 22 – (22) – Utilisation of treasury shares – 12 – – – 16 – 28 Utilisation of merger relief reserve – – (335) – – – 335 – Credit entry relating to share-based payments – – – – – – 24 24 Capital contribution relating to share-based payments – – – – – – 59 59 At 31 March 2016 168 6,848 3,628 (10) (382) (889) 10,164 19,527 172 SABMiller plc Annual Report 2016
  • 177.
    Notes to thecompany financial statements a) Basis of preparation SABMiller plc (the company) is a public limited company incorporated in Great Britain and registered in England and Wales. The address of its registered office is SABMiller House, Church Street West, Woking, Surrey, England, GU21 6HS. These financial statements have been prepared in accordance with Financial Reporting Standard 101 Reduced Disclosure Framework (FRS 101). In preparing these financial statements, the company applies the recognition, measurement and disclosure requirements of International Financial Reporting Standards as adopted by the EU (Adopted IFRSs), but makes amendments where necessary in order to comply with the Companies Act 2006 and has set out below where advantage of the FRS 101 disclosure exemptions has been taken. In these financial statements, the company has adopted FRS 101 for the first time. In the transition to FRS 101, the company has applied IFRS 1 ‘First-time adoption of International Financial Reporting Standards’ while ensuring that its assets and liabilities are measured in compliance with FRS 101. An explanation of how the transition to FRS 101 has affected the reported financial position, financial performance and cash flows of the company is provided in note 18. IFRS 1 grants certain exemptions from the full requirements of Adopted IFRSs in the transition period. These are not considered to have a material impact on the company’s financial statements. In these financial statements, the company has applied the exemptions available under FRS 101 in respect of the following disclosures: − Paragraph 38 of IAS 1, ‘Presentation of financial statements’ comparative information requirements in respect of: − Paragraph 79(a)(iv) of IAS 1; − Paragraph 73(e) of IAS 16, ‘Property, plant and equipment’; and − Paragraph 118(e) of IAS 38, ‘Intangible assets’. − The following paragraphs of IAS 1, ‘Presentation of financial statements’: − 10(d) (statement of cash flows); − 10(f) (a balance sheet as at the beginning of the preceding period when an entity applies an accounting policy retrospectively or makes a retrospective restatement of items in its financial statements, or when it reclassifies items in its financial statements); − 16 (statement of compliance with all IFRS); − 38A (requirement for minimum of two primary statements, including cash flow statements); − 38B-D (additional comparative information); − 40A-D (requirements for a third balance sheet); − 111 (cash flow statement information); and − 134-136 (capital management disclosures). − IAS 7, ‘Statement of cash flows’. − Paragraphs 30 and 31 of IAS 8 ‘Accounting policies, changes in accounting estimates and errors’ (requirement for the disclosure of information when an entity has not applied a new IFRS that has been issued but is not yet effective). − The requirements in IAS 24, ‘Related party disclosures’ to disclose related party transactions entered into with wholly-owned members of the group. As the consolidated financial statements include the equivalent disclosures, the company has also taken the exemptions under FRS 101 available in respect of the following disclosures: − Paragraphs 45(b) and 46 to 52 of IFRS 2, ‘Share-based payment’; − Certain disclosures required by IFRS 13 ‘Fair value measurement’ and the disclosures required by IFRS 7 ‘Financial instrument disclosures’; and − Paragraph 17 of IAS 24, ‘Related party disclosures’ (key management compensation). The accounting policies set out below have, unless otherwise stated, been applied consistently to all years presented in these financial statements and in preparing an opening FRS 101 balance sheet at 1 April 2014 for the purposes of the transition to FRS 101. Judgements made by the directors in the application of those accounting policies that have a significant effect on the financial statements and estimates with a significant risk of material adjustment in the next year are detailed in note 2. The financial statements are prepared on the going concern basis, under the historical cost convention, as modified by certain financial assets and financial liabilities (including derivative instruments) at fair value through profit and loss. The principal accounting policies, which have been applied consistently throughout the year, are set out below. b) Foreign exchange The financial statements are presented in US dollars which is the company’s functional and presentational currency. The South African rand (ZAR) and British pound (GBP) exchange rates to the US dollar used in preparing the company’s financial statements were as follows. Weighted average rate Closing rate ZAR GBP ZAR GBP Year ended 31 March 2016 13.78 0.66 14.77 0.70 Year ended 31 March 2015 11.08 0.62 12.13 0.67 The financial statements have been prepared on the basis that transactions in foreign currencies are recorded in their functional currency at the rate of exchange ruling at the date of the transaction. Monetary items denominated in foreign currencies are retranslated at the rate of exchange ruling at the balance sheet date with the resultant translation differences being included in operating profit in the income statement, other than those arising on financial assets and liabilities which are recorded within net finance costs and those which are deferred in equity as qualifying cash flow hedges. Translation differences on non-monetary assets and liabilities that are measured in terms of historical cost in a foreign currency are translated using the exchange rate at the date of the transaction. Translation differences on non-monetary assets and liabilities denominated in foreign currencies that are stated at fair value are retranslated to the functional currency at foreign exchange rates ruling at the dates the fair value was determined. c) Investments in subsidiaries Investments in subsidiaries are stated at cost, together with subsequent capital contributions, less provisions for impairment. The issue by the company to employees of its subsidiaries of a grant over the company’s shares represents an additional capital contribution by the company to its subsidiaries, except to the extent the company is reimbursed. An additional investment in subsidiaries results in a corresponding increase in shareholders’ equity. The additional capital contribution is based on the fair value of the grant issued allocated over the underlying grant’s vesting period. d) Financial instruments Financial assets and financial liabilities are initially recorded at fair value (plus any directly attributable transaction costs except in the case of those classified at fair value through profit or loss). For those financial instruments that are not subsequently held at fair value, the company assesses whether there is any objective evidence of impairment at each balance sheet date. 1. Accounting policies 173SABMiller plc Annual Report 2016 FINANCIALSTATEMENTS
  • 178.
    FINANCIAL STATEMENTS Financial assetsare recognised when the company has rights or other access to economic benefits. Such assets consist of cash, equity instruments, a contractual right to receive cash or another financial asset, or a contractual right to exchange financial instruments with another entity on potentially favourable terms. Financial assets are derecognised when the rights to receive cash flows from the asset have expired or have been transferred and the company has transferred substantially all risks and rewards of ownership. Financial liabilities are recognised when there is an obligation to transfer benefits and that obligation is a contractual liability to deliver cash or another financial asset or to exchange financial instruments with another entity on potentially unfavourable terms. Financial liabilities are derecognised when they are extinguished, that is discharged, cancelled or expired. If a legally enforceable right exists to set off recognised amounts of financial assets and liabilities, which are in determinable monetary amounts, and there is the intention to settle net, the relevant financial assets and liabilities are offset. Interest costs are charged to the income statement in the year in which they accrue. Premiums or discounts arising from the difference between the net proceeds of financial instruments purchased or issued and the amounts receivable or repayable at maturity are included in the effective interest calculation and taken to net finance costs over the life of the instrument. The company holds four categories of financial assets and liabilities. These are described as follows. (i) Financial assets and financial liabilities at fair value through profit or loss Financial assets and financial liabilities at fair value through profit or loss include derivative assets and derivative liabilities not designated as effective hedging instruments. All gains or losses arising from changes in the fair value of financial assets or financial liabilities within this category are recognised in the income statement. Derivative financial assets and financial liabilities Derivative financial assets and financial liabilities are financial instruments the value of which changes in response to an underlying variable, require little or no initial investment and are settled in the future. Derivative financial assets and liabilities are analysed between current and non-current assets and liabilities on the face of the balance sheet, depending on when they are expected to mature. For derivatives that have not been designated to a hedging relationship, all fair value movements are recognised immediately in the income statement. (See note (e) for the company’s accounting policy on hedge accounting). (ii) Loans and receivables Loans and receivables are non-derivative financial assets with fixed or determinable payments that are not quoted on an active market. They arise when the company provides money, goods or services directly to a debtor with no intention of trading the receivable. They are included in current assets. Loans and receivables are initially recognised at fair value including originating fees and transaction costs, and subsequently measured at amortised cost using the effective interest method less provision for impairment. Loans and receivables include trade receivables, loans owed by subsidiary undertakings, amounts owed by subsidiary undertakings, amounts owed by associates, other receivables and cash and cash equivalents. a. Loans and receivables other than cash and cash equivalents Loans and receivables other than cash and cash equivalents are initially recognised at fair value and subsequently measured at amortised cost less provision for impairment. A provision for impairment is established when there is objective evidence that the company will not be able to collect all amounts due according to the terms of the receivables. The amount of the provision is the difference between the asset’s carrying value and the present value of the estimated future cash flows discounted at the original effective interest rate. This provision is recognised in the income statement. b. Cash and cash equivalents In the balance sheet, cash and cash equivalents include cash in hand, bank deposits repayable on demand and other short-term highly liquid investments with original maturities of three months or less. (iii) Financial liabilities held at amortised cost Financial liabilities held at amortised cost include trade payables, accruals, other payables and borrowings (such as loans and amounts owed to subsidiary undertakings and unsecured bonds). a. Trade payables Trade payables are initially recognised at fair value and subsequently measured at amortised cost using the effective interest method. Trade payables are analysed between current and non-current liabilities on the face of the balance sheet, depending on when the obligation to settle will be realised. b. Borrowings Borrowings are recognised initially at fair value, net of transaction costs and are subsequently stated at amortised cost and include accrued interest and prepaid interest. Borrowings are classified as current liabilities unless the company has an unconditional right to defer settlement of the liability for at least 12 months from the balance sheet date. Borrowings classified as hedged items are subject to hedge accounting requirements (see note e). (iv) Financial guarantee contracts Financial guarantee contracts are defined in IAS 39 as contracts that require the issuer to make specified payments to reimburse the holder for a loss it incurs because a specified debtor fails to make payment when due in accordance with the original or modified terms of a debt instrument. Issued financial guarantee contracts are initially recognised at their fair value and subsequently measured at the higher of the amount initially recognised less cumulative amortisation recognised and the amount determined in accordance with IAS 37 ‘Provisions, contingent liabilities and contingent assets’. Financial guarantees are amortised over the life of the guarantee, or accelerated if the third party obligation is settled early. The amortisation is taken to the income statement. e) Derivative financial instruments – hedge accounting Financial assets and financial liabilities at fair value through profit or loss include all derivative financial instruments. The derivative instruments used by the company, which are used solely for hedging purposes (i.e. to offset foreign exchange, commodity price and interest rate risks), comprise interest rate swaps, cross currency swaps, forward foreign exchange contracts and other specific instruments as necessary under the approval of the board. Such derivative instruments are used to alter the risk profile of an existing underlying exposure of the company in line with the group’s risk management policies. Derivatives are initially recorded at fair value on the date a derivative contract is entered into and are subsequently remeasured at their fair value. The method of recognising the resulting gain or loss depends on whether the derivative is designated as a hedging instrument, and, if so, the nature of the hedging relationship. In order to qualify for hedge accounting, the company is required to document at inception the relationship between the hedged item and the hedging instrument as well as its risk management objectives and strategy for undertaking hedging transactions. The company is also required to document and demonstrate that the relationship between 1. Accounting policies continued Notes to the company financial statements continued 174 SABMiller plc Annual Report 2016
  • 179.
    the hedged item andthe hedging instrument will be highly effective. This effectiveness test is reperformed at each period end to ensure that the hedge has remained and will continue to remain highly effective. The company designates certain derivatives as either: hedges of the fair value of recognised assets or liabilities or a firm commitment (fair value hedge); or hedges of highly probable forecast transactions or commitments (cash flow hedge). (i) Fair value hedges Fair value hedges comprise derivative financial instruments designated in a hedging relationship to manage the company’s interest rate risk to which the fair value of certain assets and liabilities are exposed. Changes in the fair value of the derivative offset the relevant changes in the fair value of the underlying hedged item attributable to the hedged risk in the income statement in the period incurred. Gains or losses on fair value hedges that are regarded as highly effective are recorded in the income statement together with the gain or loss on the hedged item attributable to the hedged risk. (ii) Cash flow hedges Cash flow hedges comprise derivative financial instruments designated in a hedging relationship to manage currency and interest rate risk to which the cash flows of certain assets and liabilities are exposed. The effective portion of changes in the fair value of the derivative that is designated and qualifies for hedge accounting is recognised in other comprehensive income. The ineffective portion is recognised immediately in the income statement. Amounts accumulated in equity are reclassified to the income statement in the period in which the hedged item affects profit or loss. However, where a forecasted transaction results in a non-financial asset or liability, the accumulated fair value movements previously deferred in equity are included in the initial cost of the asset or liability. f) Interest income Interest income is recognised on an accruals basis using the effective interest method. When a receivable is impaired the company reduces the carrying amount to its recoverable amount by discounting the estimated future cash flows at the original effective interest rate, and continuing to unwind the discount as interest income. g) Dividend income Dividend income is recognised when the right to receive payment is established. h) Tax The tax expense for the year comprises current and deferred tax. Tax is recognised in the income statement, except to the extent that it relates to items recognised in other comprehensive income or directly in equity, in which case it is recognised in other comprehensive income or directly in equity, respectively. Current tax expense is based on the results for the year as adjusted for items that are not taxable or not deductible. The company’s liability for current taxation is calculated using tax rates and laws that have been enacted or substantively enacted by the balance sheet date. Deferred tax is provided in full using the liability method, in respect of all temporary differences arising between the tax bases of assets and liabilities and their carrying values, except where the temporary difference arises from goodwill (in the case of deferred tax liabilities) or from the initial recognition (other than a business combination) of other assets and liabilities in a transaction that affects neither accounting nor taxable profit. Deferred tax liabilities are recognised where the carrying value of an asset is greater than its tax base, or where the carrying value of a liability is less than its tax base. Deferred tax is recognised in full on temporary differences arising from investment in subsidiaries, associates and joint ventures, except where the timing of the reversal of the temporary difference is controlled by the company and it is probable that the temporary difference will not reverse in the foreseeable future. This includes taxation in respect of the retained earnings of overseas subsidiaries only to the extent that, at the balance sheet date, dividends have been accrued as receivable or a binding agreement to distribute past earnings in future periods has been entered into by the subsidiary. Deferred income tax is also recognised in respect of the unremitted retained earnings of overseas associates and joint ventures as the company is not able to determine when such earnings will be remitted and when such additional tax such as withholding taxes might be payable. A net deferred tax asset is regarded as recoverable and therefore recognised only when, on the basis of all available evidence, it is expected that sufficient existing taxable temporary differences will reverse in the future or there will be sufficient taxable profit available against which the temporary differences (including carried forward tax losses) can be utilised. Deferred tax is measured at the tax rates expected to apply in the periods in which the timing differences are expected to reverse based on tax rates and laws that have been enacted or substantively enacted at balance sheet date. Deferred tax is measured on a non- discounted basis. i) Dividend distributions Dividend distributions are recognised as a liability in the company’s financial statements in the period in which the dividends are approved by the company’s shareholders. Interim dividends are recognised when paid. Dividends declared after the balance sheet date are not recognised, as there is no present obligation at the balance sheet date. j) Property, plant and equipment and depreciation Property, plant and equipment are stated at cost net of accumulated depreciation and any impairment losses. Cost includes expenditure that is directly attributable to the acquisition of the assets. Subsequent costs are included in the asset’s carrying value or recognised as a separate asset as appropriate, only when it is probable that future economic benefits associated with the specific asset will flow to the company and the cost can be measured reliably. Repairs and maintenance costs are charged to the income statement during the financial period in which they are incurred. (i) Assets in the course of construction Assets in the course of construction are carried at cost less any impairment loss. Cost includes professional fees and for qualifying assets certain borrowing costs as determined below. When these assets are ready for their intended use, they are transferred into the appropriate category. At this point, depreciation commences on the same basis as on other property, plant and equipment. (ii) Depreciation No depreciation is provided for assets in the course of construction. In respect of all other property, plant and equipment, depreciation is provided on a straight-line basis at rates calculated to write off the cost, less the estimated residual value, of each asset over its expected useful life as follows. Office equipment 2 – 10 years Short leasehold buildings Shorter of the lease term or 50 years The company regularly reviews all of its depreciation rates and residual values to take account of any changes in circumstances. When setting useful economic lives, the principal factors the company takes into account are the expected rate of technological developments, expected market requirements for the equipment and the intensity at which the assets are expected to be used. The profit or loss on the disposal of an asset is the difference between the disposal proceeds and the net book amount. 1. Accounting policies continued 175SABMiller plc Annual Report 2016 FINANCIALSTATEMENTS
  • 180.
    FINANCIAL STATEMENTS (iii) Capitalisationof borrowing costs Financing costs incurred, before tax, on major capital projects during the period of development or construction that necessarily take a substantial period of time to be developed for their intended use, are capitalised up to the time of completion of the project. k) Intangible assets and amortisation Intangible assets are stated at cost less accumulated amortisation on a straight-line basis (if applicable) and impairment losses. Cost is usually determined as the amount paid by the company, unless the asset has been acquired as part of a business combination. Intangible assets acquired as part of a business combination are recognised at their fair value at the date of acquisition. Amortisation is included within net operating expenses in the income statement. Internally generated intangibles are not recognised except for computer software and applied development costs referred to under computer software and research and development below. Intangible assets with finite lives are amortised over their estimated useful economic lives, and only tested for impairment where there is a triggering event. The company regularly reviews all of its amortisation rates and residual values to take account of any changes in circumstances. The directors’ assessment of the useful life of intangible assets is based on the nature of the asset acquired, the durability of the products to which the asset attaches and the expected future impact of competition on the business. (i) Computer software Where computer software is not an integral part of a related item of property, plant and equipment, the software is capitalised as an intangible asset. Acquired computer software licences are capitalised on the basis of the costs incurred to acquire and bring them to use. Direct costs associated with the production of identifiable and unique internally generated software controlled by the company that will probably generate economic benefits exceeding costs beyond one year are capitalised. Direct costs include software development employment costs (including those of contractors used), capitalised interest and an appropriate portion of overheads. Capitalised computer software, licence and development costs are amortised over their useful economic lives of between three and eight years. Internally generated costs associated with maintaining computer software programmes are expensed as incurred. (ii) Research and development Research and general development expenditure is written off in the period in which it is incurred. Certain applied development costs are only capitalised as internally generated intangible assets where there is a clearly defined project, separately identifiable expenditure, an outcome assessed with reasonable certainty (in terms of feasibility and commerciality), expected revenues exceed expected costs and the company has the resources to complete the task. Such assets are amortised on a straight-line basis over their useful lives once the project is complete. l) Employee benefits (i) Wages and salaries Wages and salaries for current employees are recognised in the income statement as the employees’ services are rendered. (ii) Vacation and long-term service awards costs The company recognises a liability and an expense for accrued vacation pay when such benefits are earned and not when these benefits are paid. The company recognises a liability and an expense for long-term service awards where cash is paid to the employee at certain milestone dates in a career with the company. Such accruals are appropriately discounted to reflect the future payment dates at discount rates determined by reference to local high-quality corporate bonds. (iii) Profit-sharing and bonus plans The company recognises a liability and an expense for bonuses and profit-sharing, based on a formula that takes into consideration the profit attributable to the company’s shareholders after certain adjustments. The company recognises a provision where contractually obliged or where there is a past practice that has created a constructive obligation. (iv) Share-based compensation The company operates a variety of equity-settled share-based compensation plans. The equity-settled plans comprise share option and stock appreciation rights plans (with and without market performance conditions attached), performance share award plans (with and without market performance conditions attached) and awards related to the employee element of the Broad-Based Black Economic Empowerment (BBBEE) scheme in South Africa. An expense is recognised to spread the fair value of each award over the vesting period on a straight-line basis, after considering an estimate of the share awards that will eventually vest. A corresponding adjustment is made to equity over the remaining vesting period. The estimate of the level of vesting is reviewed at least annually, with any impact on the cumulative charge being recognised immediately. In addition the company has granted an equity-settled share-based payment to retailers in relation to the retailer element of the BBBEE scheme. The charges are based on the fair value of the awards as at the date of grant, as calculated by various binomial model calculations and Monte Carlo simulations. The charges are not reversed if the options and awards are not exercised because the market value of the shares is lower than the option price at the date of grant. The proceeds received net of any directly attributable transaction costs are credited to share capital (nominal value) and share premium when the options are exercised unless the options are satisfied by the transfer of treasury or other Employee Benefit Trust (EBT) shares. The issue by the company to employees of its subsidiaries of a grant over the company’s shares represents additional capital contributions by the company to its subsidiaries, except to the extent the company is reimbursed. An additional investment in subsidiaries results in a corresponding increase in shareholders’ equity. The additional capital contribution is based on the fair value of the grant issued allocated over the underlying grant’s vesting period. The company has an employee benefit trust, the SABMiller Associated Companies’ Employees’ Benefit Trust (AC-EBT). The AC-EBT may hold shares in SABMiller plc for the purposes of providing share incentives for employees of companies in which SABMiller has a significant economic and strategic interest but over which it does not have management control. Shares held by EBTs and in treasury are treated as a deduction from equity until the shares are utilised. (v) Pension obligations The contributions to defined contribution plans are recognised as an expense as the costs become payable. The contributions are recognised as employee benefit expense when they are due. Prepaid contributions are recognised as an asset to the extent that a cash refund or a reduction in the future payments is available. m) Operating leases Rentals paid and incentives received on operating leases are charged or credited to the income statement on a straight-line basis over the lease term. n) Impairment of non-financial assets This policy covers all assets except financial assets (see note d) and deferred tax assets (see note h). 1. Accounting policies continued Notes to the company financial statements continued 176 SABMiller plc Annual Report 2016
  • 181.
    Impairment reviews areperformed by comparing the carrying value of the fixed asset with its recoverable amount, being the higher of the fair value less costs of disposal and value in use. The fair value less costs of disposal is considered to be the amount that could be obtained on disposal of the asset, and therefore is determined from a market participant perspective. The recoverable amount under both calculations is determined by discounting the future post-tax cash flows generated from continuing use of the cash generating unit (CGU) using a post-tax discount rate. For value in use, this closely approximates applying pre-tax discount rates to pre-tax cash flows. Where a potential impairment is identified using post-tax cash flows and post-tax discount rates, the impairment review is reperformed on a pre-tax basis in order to determine the impairment loss to be recorded. Where the asset does not generate cash flows that are independent from the cash flows of other assets, the company estimates the recoverable amount of the CGU to which the asset belongs. For the purpose of conducting impairment reviews, CGUs are considered to be groups of assets that have separately identifiable cash flows. They also include those assets and liabilities directly involved in producing the income and a suitable proportion of those used to produce more than one income stream. When the carrying values of fixed assets are written down by any impairment amount, the loss is recognised in the income statement in the period in which it is incurred. Should circumstances or events change and give rise to a reversal of a previous impairment loss, the reversal is recognised in the income statement in the period in which it occurs and the carrying value of the asset is increased. The increase in the carrying value of the asset is restricted to the amount that it would have been had the original impairment not occurred. Assets subject to amortisation or depreciation are reviewed for impairment if circumstances or events change to indicate that the carrying value may not be fully recoverable. o) Share capital Ordinary shares are classified as equity. Incremental costs directly attributable to the issue of new shares or options are shown in equity as a deduction, net of tax, from the proceeds. p) Investments in own shares (treasury and shares held by employee benefit trusts) Shares held by employee share ownership plans, employee benefit trusts and in treasury are treated as a deduction from equity until the shares are cancelled, reissued, or disposed. Where such shares are subsequently sold or reissued, any consideration received, net of any directly attributable incremental costs and related tax effects, is included in equity attributable to the company’s equity shareholders. 2. Key estimates and judgements In determining and applying accounting policies, judgement is often required where the choice of specific policy, assumption or accounting estimate to be followed could materially affect the reported results or net position of the company, should it later be determined that a different choice be more appropriate. Management considers the following to be areas of significant judgement and estimation for the company due to greater complexity and/or particularly subject to the exercise of judgement. Management has reconsidered the significant judgements and estimates applied, and has not assumed the completion of the AB InBev transaction. (i) Impairment reviews Impairment reviews are performed if events indicate that this is necessary. Impairment reviews are based on future cash flows discounted using the weighted average cost of capital with terminal values calculated applying a long-term growth rate. The future cash flows which are based on business forecasts, the long-term growth rates and the discount rates used are dependent on management estimates and judgements. Future events could cause the assumptions used in these impairment reviews to change with a consequent adverse impact on the results and net position of the company. (ii) Taxation Significant judgement is required in determining the provision for taxes as the tax treatment is often by its nature complex, and cannot be finally determined until a formal resolution has been reached with the relevant tax authority which may take several years to conclude. Amounts provided are accrued based on management’s interpretation of country specific tax laws and the likelihood of settlement. Actual liabilities could differ from the amount provided which could have a consequent adverse impact on the results and net position of the company. (iii) Share-based compensation Accounting for share-based compensation requires certain assumptions to be made in order to determine the amounts to be recognised in the income statement in accordance with IFRS 2. The income statement charge spreads the fair value of each award at the grant date over the vesting period on a straight-line basis, after considering an estimate of the share awards that will eventually vest. The estimate of the level of vesting is reviewed at least annually, with any impact on the cumulative charge recognised immediately. The completion of the proposed AB InBev transaction has not been assumed in determining the extent and timing of the vesting of awards. Details of the assumptions used in determining fair values of grants in the year are set out in note 25 to the consolidated financial statements of the group. 1. Accounting policies continued 177SABMiller plc Annual Report 2016 FINANCIALSTATEMENTS
  • 182.
    FINANCIAL STATEMENTS 3. Intangibleassets Assets in course of construction US$m Software US$m Total US$m Cost At 1 April 2015 51 210 261 Additions 9 18 27 Transfers (41) 38 (3) At 31 March 2016 19 266 285 Accumulated depreciation At 1 April 2015 – 128 128 Charge for the year – 24 24 At 31 March 2016 – 152 152 Net book amount At 1 April 2015 51 82 133 At 31 March 2016 19 114 133 4. Property, plant and equipment Assets in course of construction US$m Short leasehold land and buildings US$m Office equipment US$m Total US$m Cost At 1 April 2015 23 36 22 81 Additions 4 – 5 9 Disposals – (2) (2) (4) Transfers (15) – 18 3 At 31 March 2016 12 34 43 89 Accumulated depreciation At 1 April 2015 – 24 13 37 Disposals – (2) (1) (3) Charge for the year – 3 4 7 At 31 March 2016 – 25 16 41 Net book amount At 1 April 2015 23 12 9 44 At 31 March 2016 12 9 27 48 5. Investments in subsidiaries 2016 US$m 2015 US$m Cost At 1 April 14,305 14,242 Additions – 14 Capital contributions relating to share-based payments 59 49 At 31 March 14,364 14,305 Accumulated impairment At 1 April 236 140 Impairment – 96 At 31 March 236 236 Net book value At 1 April 14,069 14,102 At 31 March 14,128 14,069 Notes to the company financial statements continued 178 SABMiller plc Annual Report 2016
  • 183.
    5. Investments insubsidiaries continued The net book value of investments in subsidiaries at 31 March 2016 of US$14,128 million (2015: US$14,069 million) includes US$633 million (2015: US$574 million) from capital contributions relating to share-based payments as well as US$5 million (2015: US$5 million) relating to a contribution of ZAR 36 million towards the cost of a guarantee fee to SABSA Holdings Ltd, a fellow group undertaking. The directors consider that the carrying values of the investments are supported by their underlying net assets. The direct investments in subsidiary undertakings are as follows (all interests are 100% unless stated otherwise). Name Country of incorporation Principal activity Share class 2016 US$m 2015 US$m SABMiller Holdings Ltd United Kingdom Holding company US$1 ordinary 10,633 10,633 Miller Brands (UK) Ltd United Kingdom Sales and distribution US$1 ordinary 39 39 SABMiller Management BV Netherlands Management services €1 ordinary – – SABMiller Africa & Asia BV¹ Netherlands Holding company €1 ordinary 195 195 Appletiser International BV Netherlands Holding company €1 ordinary – – SABMiller (Safari) United Kingdom Finance company US$1 ordinary 506 506 Pilsner Urquell International BV Netherlands Holding company €1 ordinary – – SABMiller Holdings Europe Ltd United Kingdom Holding company £1 ordinary 2,117 2,117 Racetrack Colombia Finance SAS Colombia Dormant company COP1,000 ordinary – – SABMiller Horizon Ltd United Kingdom Agent company US$1 ordinary – – SABSA Holdings Ltd² South Africa Holding company n/a 5 5 SABMiller Capital UK Ltd United Kingdom Holding company US$1 ordinary – – SABMiller Asia Capital LLP³ United Kingdom Partnership US$1 ordinary – – SA Breweries Ltd United Kingdom Dormant company £1 ordinary – – South Africa Breweries Ltd United Kingdom Dormant company £1 ordinary – – South African Breweries Ltd United Kingdom Dormant company £1 ordinary – – 13,495 13,495 Capital contribution relating to share-based payments 633 574 14,128 14,069 1 Operates and resident for tax purposes in the United Kingdom. 2 SABMiller plc contributed ZAR36 million towards the cost of guarantee fee to SABSA Holdings Ltd, a fellow group undertaking. It has no direct interest in the share capital of that company. 3 1% direct interest and 100% effective interest. Indirect investments held by the company, such as subsidiaries, associates and joint ventures of the company’s direct investments, are detailed in the related undertakings section of the annual report. 6. Loans and other financial assets 2016 US$m 2015 US$m Due after more than one year Loans owed by subsidiary undertakings 1,886 5,529 Amounts owed by subsidiary undertakings 205 231 Financial guarantee asset – 2 2,091 5,762 Due within one year Loans owed by subsidiary undertakings 4,446 938 Amounts owed by subsidiary undertakings 190 200 Amounts owed by associated undertakings 1 1 Financial guarantee asset 2 3 4,639 1,142 Interest on the loan owed by subsidiary undertakings due after more than one year is charged at floating rates. The floating rate is one month LIBOR plus 180 basis points (bps) and the loan is repayable in 2017. Interest on loans owed by subsidiary undertakings due within one year is charged at either fixed or floating rates. The fixed rate is 1.72%. The floating rate is one month LIBOR or equivalent depending on the location of the subsidiary undertaking. Spreads range from plus 10 bps to 80 bps. All amounts owed by subsidiary undertakings are non-interest bearing with a fixed repayment date. 179SABMiller plc Annual Report 2016 FINANCIALSTATEMENTS
  • 184.
    FINANCIAL STATEMENTS 7. Tradeand other receivables 2016 US$m 2015 US$m Due after more than one year Prepayments 15 20 Due within one year Other debtors 39 31 Corporation tax – 28 39 59 8. Derivative financial instruments 2016 2015 Notional amounts US$m Assets US$m Liabilities US$m Notional amounts US$m Assets US$m Liabilities US$m Derivative financial instruments due after more than one year Forward foreign currency contracts – – – 1 – – Forward foreign currency contracts designated as cash flow hedges 40 – (1) 46 – (1) Interest rate swaps 600 24 (5) 1,600 64 (4) Interest rate swaps designated as fair value hedges 300 150 – 300 146 – Cross currency swaps 180 74 – 286 178 – 1,120 248 (6) 2,233 388 (5) Derivative financial instruments due within one year Forward foreign currency contracts 134 – (4) 563 20 (7) Forward foreign currency contracts designated as cash flow hedges 276 1 (11) 290 – (25) Interest rate swaps 1,000 15 (2) – – – Cross currency swaps 95 109 (2) – – – 1,505 125 (19) 853 20 (32) Derivatives designated as hedging instruments (i) Cash flow hedges The company has entered into forward exchange contracts designated as cash flow hedges to manage short-term foreign currency exchange exposures to future creditor payments. (ii) Fair value hedges The company has entered into interest rate swaps to pay floating and receive fixed interest which have been designated as fair value hedges to manage changes in the fair value of its fixed rate borrowings. The borrowings and interest rate swaps have the same critical terms. As at 31 March 2016, the carrying value of the hedged borrowings was US$471 million (2015: US$460 million). Held for trading derivative financial instruments (i) Forward foreign currency contracts The company has entered into several forward foreign currency contracts to manage the group’s exposure to foreign exchange risk on the investments in subsidiaries and fellow group undertakings in South Africa (2015: South Africa and Poland) and also GBP-denominated balance sheet exposures. (ii) Cross currency swaps The company has entered into several cross currency swaps to manage the group’s exposure to foreign exchange risk relating to subsidiaries and fellow group undertakings in South Africa and the Netherlands (2015: South Africa and the Netherlands). (iii) Interest rate swaps The company has entered into interest rate swaps to manage exposures to fluctuations in interest rates. The derivatives are fair valued based on discounted future cash flows with gains and losses taken to the income statement. Notes to the company financial statements continued 180 SABMiller plc Annual Report 2016
  • 185.
    9. Cash andcash equivalents 2016 US$m 2015 US$m Short-term deposits 878 449 The company has short-term deposits in US dollars and British pounds. The effective interest rate was 0.24% (2015: 0.18%). 10. Borrowings 2016 US$m 2015 US$m Due within one year Loans owed to subsidiary undertakings 1,106 434 Amounts owed to subsidiary undertakings 20 26 1,126 460 Due after more than one year Amounts owed to subsidiary undertakings – 3 Unsecured bonds 1,215 1,220 1,215 1,223 The maturity of borrowings due after more than one year is as follows: Between one and two years – 2 Between two and five years 745 761 After five years 470 460 1,215 1,223 Interest on loans owed to subsidiary undertakings due within one year is charged at floating rates. The floating rates are one or six month LIBOR or equivalent depending on the location of the subsidiary undertaking. Spreads range from minus 13 bps to plus 80 bps. All amounts owed to subsidiary undertakings are unsecured and repayable on demand. The amount due after five years consists of a bond. The bond matures in 2033 with a fixed interest rate of 6.625%. 11. Trade and other payables 2016 US$m 2015 US$m Due within one year Trade and other payables 79 35 Taxation and social security 37 25 Accruals and deferred income 72 64 Dividends payable to shareholders – 1 188 125 Due after more than one year Other creditors 6 5 Deferred income 4 5 10 10 The maturity of trade and other payables due after more than one year is as follows: Between one and two years 6 5 Between two and five years 3 3 After five years 1 2 10 10 181SABMiller plc Annual Report 2016 FINANCIALSTATEMENTS
  • 186.
    FINANCIAL STATEMENTS 12. Fairvalues of financial assets and financial liabilities Book value 2016 US$m Fair value 2016 US$m Book value 2015 US$m Fair value 2015 US$m Non-current borrowings (1,215) (1,161) (1,220) (1,202) Non-current loans 1,886 1,919 5,529 6,044 All financial assets and liabilities, other than those included in the table above, have a book value which approximates to their fair value. The fair values of financial instruments that are traded in active markets are based on quoted market prices at the balance sheet date. A market is regarded as active if quoted prices are readily and regularly available from an exchange, dealer, broker, industry company, pricing service or regulatory agency and these prices represent actual and regularly occurring transactions on arm’s length basis. The fair values of financial instruments that are not traded in an active market are based on the net present value of the anticipated future cash flows associated with these instruments, using rates currently available for debt on similar terms, credit risk and remaining maturity. Fair value gain on financial instruments recognised in profit and loss 2016 US$m 2015 US$m Derivative financial instruments: Forward foreign currency contracts (6) 40 Fair value gain on forward foreign currency contracts transferred from other comprehensive loss (23) 1 Interest rate swaps (34) (33) Interest rate swaps designated as fair value hedges 11 40 Cross currency swaps 2 66 (50) 114 Other financial instruments: Guarantee fees 54 58 Early repayment costs – (48) Other fair value gains 16 11 Borrowings designated as the hedged item in a fair value hedge (11) (38) 59 (17) Total fair value gain on financial instruments recognised in profit and loss 9 97 13. Other financial liabilities 2016 US$m 2015 US$m Due within one year Financial guarantee in respect of subsidiary borrowings 45 50 Loan guarantee provision 20 – 65 50 Due after more than one year Financial guarantees in respect of subsidiary borrowings 188 231 The company has guaranteed the bank overdrafts and drawn components of bank loans and issued bonds of a number of subsidiaries. Under the terms of the financial guarantee contracts, the company will make payments to reimburse the lenders upon failure of the guaranteed entity to make payments when due. Terms and notional values of the liabilities guaranteed were as follows. 2016 US$m 2015 US$m Financial year of maturity 2016 – 640 2017 2,350 2,251 2018 232 257 2019 1,100 1,100 2020 1,138 1,073 2021 536 – 2022 2,500 2,500 2042 1,500 1,500 9,356 9,321 Additionally the company has recorded a provision of US$20 million in relation to loan guarantees in Angola. Notes to the company financial statements continued 182 SABMiller plc Annual Report 2016
  • 187.
    14. Reserves Foreign exchangedifferences recognised in the profit for the year, except for those arising on financial instruments measured at fair value under IAS 39, were gains of US$55 million (2015: losses of US$70 million). Retained earnings include US$nil of non-distributable reserves (2015: US$3,645 million). During the year, upon realisation of qualifying consideration, the company recognised US$3,645 million of non-distributable reserves as distributable. Merger relief reserve At 1 April 2015 the merger relief reserve comprised US$3,395 million in respect of the excess of value attributed to the shares issued as consideration for Miller Brewing Company over the nominal value of those shares and US$568 million relating to the merger relief arising on the issue of SABMiller plc ordinary shares for the buyout of non-controlling interests in the group’s Polish business. During the year ended 31 March 2016, the company transferred US$335 million of the reserve relating to the Polish business to retained earnings upon realisation of qualifying consideration. Further information relating to the share capital, share premium, the treasury shares and the EBT reserve of the company is detailed in notes 25 and 26 to the consolidated financial statements of the group. Details of share incentive schemes are provided in note 25 to the consolidated financial statements of the group. Details of dividends paid and proposed for the year are provided in note 9 to the consolidated financial statements of the group. 15. Profit and loss information Information relating to directors’ remuneration is included in the directors’ remuneration report on pages 74 to 92. The fee charged for the statutory audit was US$0.1 million (2015: US$0.1 million). The average monthly number of employees for the year is shown on a full-time equivalent basis and includes executive directors. 2016 2015 Number of employees 716 676 The aggregate payroll costs were as follows. 2016 US$m 2015 US$m Wages and salaries 142 125 Share-based payments (2) 4 Social security costs 2 2 Contributions to defined contribution plans 11 9 153 140 Details of key management remuneration are provided in note 6 to the consolidated financial statements of the group. Operating leases Operating lease charges recognised in the income statement during the year were as follows. 2016 US$m 2015 US$m Plant and machinery 5 4 Other 6 6 183SABMiller plc Annual Report 2016 FINANCIALSTATEMENTS
  • 188.
    FINANCIAL STATEMENTS 16. Otherinformation a. Deferred tax assets have not been recognised in respect of the following. 2016 US$m 2015 US$m Tax losses 63 58 Depreciation in excess of capital allowances 10 6 Accruals and provisions – 1 Share-based payments 51 47 124 112 b. Contingent liabilities and guarantees The company has guaranteed borrowings in respect of certain subsidiary undertakings. Guarantee fees received from 100% owned subsidiaries were US$53 million (2015: US$57 million). Guarantees provided on behalf of related parties in respect of bank facilities were US$373 million (2015: US$525 million). Note 17 details guarantee fees received from and paid to related parties. Guarantees provided on behalf of third parties in respect of bank facilities were US$49 million (2015: US$54 million). A loan guarantee provision of US$20 million is held by the company against guarantees related to third party loans. As a result of the AB InBev offer, the company has various commitments which are contingent on the completion of the transaction, including advisers’ fees and staff-related costs, principally reflecting the impact of accelerated vesting of share-based compensation. These contingent liabilities, which have not been recognised in the company’s results for the year ended 31 March 2016, are estimated to range from US$250 million to US$300 million. At 31 March 2016 the company had total annual commitments under non-cancellable operating leases as follows. 2016 US$m 2015 US$m Land and buildings Within one year 6 6 Between two and five years 14 18 After five years – 1 Other Within one year 1 3 Between two and five years 2 3 17. Related party transactions Transactions with undertakings which are not wholly owned The company has taken advantage of the exemption provided under FRS 101.8j not to disclose transactions with subsidiaries which are wholly owned. During the year the company had transactions with undertakings in which it does not hold a 100% interest as follows. 2016 US$m 2015 US$m Guarantee fee income from group subsidiaries 1 3 Guarantee fees paid to subsidiary undertakings (2) (1) 31 March 2016 US$m 2015 US$m Amounts owed by subsidiary undertakings falling due within one year 5 1 Amounts owed by associated undertakings falling due within one year 1 1 Amounts owed by subsidiary undertakings falling due after more than one year – 4 Amounts owed to subsidiary undertakings falling due within one year (3) (4) Amounts owed to subsidiary undertakings falling due after more than one year – (3) Notes to the company financial statements continued 184 SABMiller plc Annual Report 2016
  • 189.
    18. Explanation oftransition to FRS 101 from old UK GAAP As stated in note 1, these are the company’s first financial statements prepared in accordance with FRS 101. The accounting policies set out in note 1 have been applied in preparing the financial statements for the year ended 31 March 2016 and the comparative information presented in these financial statements for the year ended 31 March 2015. In preparing its FRS 101 balance sheet, the company has reclassified amounts reported previously in financial statements prepared in accordance with its old basis of accounting (UK GAAP). An explanation of how the transition from UK GAAP to FRS 101 has affected the company’s financial position and financial performance is set out in the following tables and the notes that accompany the tables. There was no impact on total comprehensive income for the year ended 31 March 2015 and no impact on net assets as at 31 March 2015 or 1 April 2014. 31 March 2015 1 April 2014 UK GAAP US$m Cumulative effect of transition to FRS 101 US$m FRS 101 US$m UK GAAP US$m Cumulative effect of transition to FRS 101 US$m FRS 101 US$m Assets Fixed assets Intangible assets¹ – 133 133 – 119 119 Property, plant and equipment¹ 177 (133) 44 158 (119) 39 Investments in subsidiaries 14,069 – 14,069 14,102 – 14,102 14,246 – 14,246 14,260 – 14,260 Current assets Debtors – due after more than one year² 5,782 (5,782) – 5,412 (5,412) – Loans and other financial assets due after more than one year² – 5,762 5,762 – 5,405 5,405 Trade and other receivables due after more than one year² – 20 20 – 7 7 Derivatives – due after more than one year² 388 (388) – 301 (301) – Derivative financial instruments due after more than one year² – 388 388 – 301 301 Debtors – due within one year² 1,201 (1,201) – 2,293 (2,293) – Loans and other financial assets due within one year² – 1,142 1,142 – 2,171 2,171 Trade and other receivables² – 59 59 – 122 122 Derivative financial instruments² 20 – 20 52 – 52 Cash and cash equivalents 449 – 449 1,532 – 1,532 7,840 – 7,840 9,590 – 9,590 Total assets 22,086 – 22,086 23,850 – 23,850 Liabilities Current liabilities Creditors – due within one year² (667) 667 – (2,091) 2,091 – Derivative financial instruments² – (32) (32) – (11) (11) Borrowings² – (460) (460) – (1,858) (1,858) Trade and other payables² – (125) (125) – (166) (166) Other financial liabilities² – (50) (50) – (56) (56) (667) – (667) (2,091) – (2,091) Net current assets 7,173 – 7,173 7,499 – 7,499 Total assets less current liabilities 21,419 – 21,419 21,759 – 21,759 Non-current liabilities Creditors – due after more than one year² (1,469) 1,469 – (2,387) 2,387 – Derivative financial instruments² – (5) (5) – (1) (1) Borrowings² – (1,223) (1,223) – (2,089) (2,089) Trade and other payables² – (10) (10) – (16) (16) Other financial liabilities² – (231) (231) – (281) (281) (1,469) – (1,469) (2,387) – (2,387) Net assets 19,950 – 19,950 19,372 – 19,372 Total equity 19,950 – 19,950 19,372 – 19,372 ¹ Reclassification of software balances of US$133 million (2014: US$119 million) from tangible assets to intangible assets. ² The balance sheet has been represented under FRS 101 to show separate categories on the face of the balance sheet. 185SABMiller plc Annual Report 2016 FINANCIALSTATEMENTS
  • 190.
    FINANCIAL STATEMENTS Related undertakings Nameof undertaking Country of incorporation Share class A.C.N. 087 233 154 Pty Ltd Australia AUD Ordinary–No par value Amayana Pty. Ltd. Australia AUD1.00 Ordinary Anglemaster Limited United Kingdom £0.25 Ordinary Appletise Hong Kong Limited Hong Kong HKD1.00 Ordinary Appletiser Limited United Kingdom £1.00 Ordinary Austindia Pty Ltd Australia AUD Ordinary–No par value Axin y Cia LTDA Colombia COP2.00 Ordinary BCA–Bebidas de Calidad Para Argentina S.A. Argentina ARS1.00 Ordinary Bevco Limited Corp. Panama US$1.00 Ordinary Bevman Services AG Switzerland CHF100.00 Ordinary BHG Brewing Licence Company Limited Cyprus €1.71 Ordinary Bier Beteiligungserwerbs GmbH Austria ATS1.00 Ordinary Birra Peroni S.r.l. Italy € Share capital Bisa Beteiligungs GmbH Germany € Share capital Bluetongue Brewery Pty Limited Australia AUD1.00 Ordinary Bourse du Vin Limited United Kingdom £1.00 Ordinary Brewing Holdings Pty Ltd Australia AUD0.50 Ordinary Brewing Investments Pty Ltd Australia AUD1.00 Ordinary Brewman Group Limited United Kingdom £0.25 Ordinary Bright Star Investments Pty Ltd Australia US$1.00 Ordinary Browar Dojlidy S.A. Poland PLN50.00 Ordinary Bulmer Australia Pty Ltd Australia AUD Ordinary Cantab Holdings N.V. Curaçao US$1,000.00 B ordinary US$1,000.00 Preference Canterbury Overseas Inc. British Virgin Islands US$1.00 Ordinary Carlton and United Breweries Holdings (UK) Limited United Kingdom £1.00 Ordinary Cascade Brewery Company Pty Ltd Australia AUD1.00 Ordinary AUD1.00 Redeemable preference Cerveceria Argentina Sociedad Anomima Isenbeck Argentina ARS1.00 Ordinary Cervejas de Angola LDA Angola AOA 200,000 Ordinary CNAB Pty Ltd Australia AUD Ordinary AUD Ordinary-A AUD Ordinary-B AUD Special Coca-Cola Beverages Africa Limited United Kingdom US$1.00 Ordinary Craigburn Land Co. Pty. Ltd. Australia AUD1.00 Ordinary CUB (New Zealand) Limited New Zealand NZD1.00 Ordinary CUB (NZ) Holding Co Pty Ltd Australia AUD1.00 Ordinary CUB People Pty Ltd Australia AUD1.00 Ordinary CUB Pty Ltd Australia AUD1.00 CLASS A AUD1.00 Ordinary De Antilope B.V. Netherlands €1.00 Ordinary De Giraffe B.V. Netherlands €1.00 Ordinary De Klok Dranken B.V. Netherlands €1.00 Ordinary Dismin Investments Pty. Ltd. Australia AUD1.00 Ordinary Dreamgame Limited United Kingdom £0.25 8% Cumulative Redeemable Preference £0.25 Ordinary East West Oriental Brewing Company Limited United Kingdom £1.00 Ordinary EFG Australia Pty Ltd Australia AUD1.00 ‘A’ Ordinary AUD1.00 ‘B’ Ordinary EFG Finance Leasing Pty Ltd Australia AUD2.00 Ordinary EFG Investments Pty Ltd Australia AUD1.00 Non-cumulative preference AUD1.00 Ordinary EFG Securities Pty Ltd Australia AUD1.00 A Ordinary AUD1.00 B Ordinary AUD1.00 Non-cumulative preference EFG Treasury Pty Limited Australia AUD1.00 Ordinary ELFIC Pty Ltd Australia AUD1.00 A Ordinary AUD1.00 B Ordinary Elstone Developments Pty. Ltd. Australia AUD1.00 Ordinary FBG Brewery Holdings UK Limited United Kingdom £1.00 Ordinary FBG Finance Pty Ltd Australia AUD1.00 Ordinary FBG Holdings (UK) Limited United Kingdom £1.00 Ordinary FBG International Limited United Kingdom £1.00 Ordinary FBG Treasury (Aust.) Pty Ltd Australia AUD1.00 Ordinary FBG Treasury (UK) Limited United Kingdom £1.00 Ordinary Foster’s Brands Limited United Kingdom £1.00 Ordinary Foster’s Brewing Group Pty. Ltd. Australia AUD1.00 Ordinary Foster’s Group Pty Ltd Australia AUD Ordinary Gardwell Limited British Virgin Islands US$1.00 Ordinary Grolsch Agencies B.V. Netherlands €1.00 Ordinary Grolsch Canada Inc Canada CAD1.00 C1 Ordinary CAD20.00 C2 Ordinary CAD1.00 C3 Ordinary Grolsch International B.V. Netherlands €1.00 Ordinary Grolsch Monumenten B.V. Netherlands €100.00 Ordinary The direct related undertakings of the company as at 31 March 2016 are shown in note 5 to the company financial statements. (a) Indirect wholly owned subsidiaries Unless indicated all shares are 100% held by group companies and effective interests are 100%. Name of undertaking Country of incorporation Share class Grolsch Vastgoed B.V. Netherlands €100.00 Ordinary Grolsche Bierbrouwerij Nederland B.V. Netherlands €1.00 Ordinary Hotel Solutions Inc British Virgin Islands USD1.00 Ordinary Industrias La Constancia S.A. de C.V. El Salvador US$1.00 Ordinary I-NOVA Consulting Pty Ltd Australia AUD Ordinary Kangaroo Ridge Wines Europe Limited United Kingdom £1.00 Ordinary Kompania Piwowarska S.A. Poland PLN2.50 Ordinary Koninklijke Grolsch N.V. Netherlands €1.00 Ordinary Liana Cottage Pty Ltd Australia 1.00 Ordinary Linser N.V. Curaçao US$1.00 Ordinary US$1.00 Preference Linton Brewing Pty Ltd Australia AUD Ordinary Lion Enterprises Singapore Pte. Ltd. Singapore SGD1.00 Ordinary Marshville Associates Inc. Panama Ordinary MBBC Pty Ltd Australia 1.00 Ordinary MBL Breweries Limited India INR100.00 Ordinary Meantime Brewing Company (Retail) Limited United Kingdom £1.00 Ordinary Meantime Brewing Company Limited United Kingdom £1.00 Ordinary Miller Brewing 1855, Inc. USA US$1.00 Common Stock Miller Brewing Company USA Common Stock Miller Brewing International Inc. Chile Limitada Chile Partnership interest Miller Brewing International, Inc. USA US$1.00 Common stock Miller Brewing Trading Company Limited Canada Common Miller Servicios Mexicanos S.A. de C.V. Mexico US$1.00 Series B ordinary US$1.00 Series BB ordinary Miller Trading Company S.A. de C.V. Mexico US$1.00 Minimum Fixed Capital Series B US$1.00 Variable Capital Series BB MUBEX Mauritius US$1.00 Ordinary MUFIN Mauritius US$1.00 Ordinary Negocios Inmobiliarios Agroindustriales S.A. de C.V. El Salvador US$1.00 Ordinary New Crest Investments Pty. Ltd. Australia AUD1.00 Ordinary Newark Investments AG Switzerland CHF100.00 Ordinary Newbelco SA/NV Belgium €0.01 Ordinary Pacific Beverages Pty Ltd Australia AUD Ordinary Peroni Nastro Azzurro Limited Isle of Man US$1.00 Ordinary Pilsner Urquell Company Limited United Kingdom £1.00 Ordinary Pilsner Urquell International Limited United Kingdom £1.00 Ordinary Pilsner Urquell Investments B.V. Netherlands €1.00 Ordinary Pivovary Topvar a.s. Slovakia €33,194.00 Ordinary €14,000,000.00 Ordinary €33.20 Registered bearer Plze ˇnský Prazdroj as Czech Republic CZK1,000.00 Ordinary Queensland Breweries Pty Ltd Australia 1.00 Cumulative preference 1.00 Ordinary RSG Land Group Pty Ltd Australia AUD2.00 Ordinary S.A. Breweries Ltd South Africa ZAR1.00 Ordinary SAB Colombia S.A.S. Colombia COP1,000.00 Ordinary SAB Limited United Kingdom £1.00 Ordinary SABFIN (Pty) Limited South Africa ZAR2.00 Ordinary SABM Centro America S. de R.L. Panama US$1.00 Ordinary Sabmark International Inc. British Virgin Islands US$1.00 Ordinary SABMiller Africa Mauritius US$1.00 Ordinary SABMiller Africa Holdings II Limited United Kingdom £1.00 Ordinary SABMiller Africa Holdings Limited United Kingdom £1.00 Ordinary SABMiller Africa Investments Limited United Kingdom £1.00 Ordinary SABMiller America Holdings Limited United Kingdom US$1.00 US$ Ordinary US$1,000.00 US$ Redeemable C Preference ZAR10.8808 ZAR Ordinary ZAR10,880.80 ZAR Redeemable C Preference SABMiller America Investments LLC USA US$1.00 Common US$1,000.00 Series C Redeemable Preferred SABMiller Americas Holdings LLC USA US$1.00 Class A US$1.00 Class C US$1,000.00 Series C Redeemable Preferred Stock SABMiller Angola 1 Mauritius US$1.00 Ordinary SABMiller Angola 2 Mauritius US$1.00 Ordinary SABMiller Asia B.V. Netherlands €1.00 Ordinary SABMiller Asia Holdings Limited United Kingdom US$1.00 Ordinary SABMiller Asia Limited Hong Kong HKD1.00 Ordinary SABMiller Australia Beverage Holdings LLP United Kingdom US$1.00 Ordinary SABMiller Australia Holdings Limited United Kingdom US$1.00 Ordinary US$1,000.00 Redeemable C Preference 186 SABMiller plc Annual Report 2016
  • 191.
    Name of undertaking Country ofincorporation Share class SABMiller Australia Investment Holdings Pty Ltd Australia AUD1.00 Ordinary SABMiller Australia Pty Limited Australia AUD Ordinary–No par value SABMiller Beverage Investments Pty Limited Australia AUD Ordinary–No par value SABMiller Brands Europe a.s. Czech Republic CZK5.00 Ordinary SABMiller Brasil Marketing Ltda. Brazil Quotas BRL1.00 Ordinary SABMiller Breweries Private Limited India INR10.00 Ordinary INR10.00 Preference SABMiller Capital AU Pty Limited Australia AUD Ordinary–No par value SABMiller Corporate Services Limited United Kingdom US$1.00 Ordinary SABMiller Europe AG Switzerland CHF1,000.00 Ordinary SABMiller Europe B.V. Netherlands €1.00 Ordinary SABMiller Europe Menedzsment Szolgaltato Kft Hungary HUF1.00 Share capital SABMiller Finance (HK) Limited Hong Kong US$1.00 Ordinary SABMiller Finance B.V. Netherlands €10.00 Ordinary SABMiller Finance Holdings (HK) Limited Hong Kong US$1.00 Ordinary SABMiller Finance SA Limited United Kingdom US$1.00 Ordinary SABMiller Financing Southern LLP United Kingdom US$1.00 Ordinary SABMiller Global Business Services Colombia S A S Colombia COP10,000,000.00 Ordinary SABMiller Global Business Services India Holdings B.V. Netherlands €1.00 Ordinary SABMiller Global Business Services India Private Limited India INR10.00 Ordinary SABMiller Global Business Services Limited United Kingdom US$1.00 Ordinary SABMiller Global Business Services Poland sp.z.o.o. Poland PLN5,000.00 Ordinary SABMiller Harmony Holdings Limited United Kingdom £0.01 A ordinary £0.01 B ordinary SABMiller Harmony Limited United Kingdom £0.01 B ordinary SABMiller Holdings Inc. USA US$0.01 Common US$1,000.00 Series A Redeemable Preferred SABMiller Holdings SA Limited United Kingdom US$1.00 Ordinary SABMiller Holdings SH Limited United Kingdom US$0.333,333,333,333,333 Ordinary SABMiller India Holdings Mauritius US$1.00 Non-cumulative redeemable preference US$1.00 Ordinary US$1.00 Senior non-cumulative redeemable preference SABMiller International B.V. Netherlands €1.00 Ordinary SABMiller International Brands Limited United Kingdom US$1.00 Ordinary SABMiller Investments Pty Ltd Australia AUD1.00 Ordinary SABMiller Latin America Inc. USA US$1.00 Common Stock SABMiller Latin Inc. USA US$1.00 Common stock US$1,000.00 Series A Redeemable Preferred Stock US$1,000.00 Series C Redeemable Preferred Stock SABMiller Management (IN) B.V. Netherlands €1.00 Ordinary SABMiller Management Africa Limited Guernsey £1.00 Ordinary SABMiller Management Limited Guernsey £1.00 Ordinary SABMiller Namibia (Pty) Limited Namibia NAD1.00 Ordinary SABMiller Netherlands B.V. Netherlands €1.00 Ordinary Name of undertaking Country of incorporation Share class SABMiller Netherlands Cooperatieve W.A. Netherlands Members interest SABMiller Poland B.V. Netherlands €1.00 Ordinary SABMiller Procurement GmbH Switzerland CHF100.00 Ordinary SABMiller Procurement s.r.o. Czech Republic Share capital SABMiller S.r.l. Italy €1.00 Share capital SABMiller SAF Limited United Kingdom US$1.00 Ordinary SABMiller SI Limited United Kingdom US$1.00 A ordinary US$1.00 B ordinary US$1,000.00 Redeemable C Preference SABMiller SI2 Limited United Kingdom US$1.00 A ordinary US$0.000,002,234,636,872 B ordinary SABMiller Sourcing Limited United Kingdom US$1.00 Ordinary SABMiller Southern Capital Financing LLC USA US$1.00 Common shares SABMiller Southern Capital Limited United Kingdom US$1.00 A ordinary US$0.000,002,234,636,872 B ordinary US$0.000,000,131,163,281 Redeemable A Preference US$0.000,000,085,518,400 Redeemable C Preference SABMiller Southern Investments Limited United Kingdom US$0.000,000,248,385,433 A ordinary US$0.000,002,234,636,872 B ordinary US$0.000,000,075,518,400 Redeemable C Preference SABMiller Vietnam Company Limited Vietnam US$ Charter capital SABMiller Vietnam Distribution Company Limited Vietnam US$ Charter capital SABSA Holdings Ltd South Africa ZAR1.00 Ordinary Sabsure Limited South Africa ZAR1.00 A ordinary ZAR1.00 Ordinary Silvester Brothers (AMH) Pty. Limited Australia AUD1.00 A Class SKOL Beer Manufacturing Company Limited India INR10.00 Ordinary INR10.00 Preference Somar Pty Ltd Australia AUD1.00 Ordinary South African Breweries International Holdings Inc. British Virgin Islands US$1.00 Ordinary SPR Distilleries Private Limited India INR10.00 Ordinary The Continental Spirits Company Pty Ltd Australia 1.00 Ordinary The Delphic Insurance Company Limited Guernsey US$1.00 Ordinary The Wine Exchange Limited United Kingdom £1.00 Ordinary Tibsco Limited United Kingdom £0.25 Ordinary Tres Montañas S.A. de C.V. El Salvador US$1.00 Ordinary Trinity Park Inc. USA AUD0.01 Common stock Tyskie Sp. z o.o. Poland PLN50.00 Ordinary Tyskie Sp. z.o.o. sp. k. Poland Partnership interest UBH (Ukrainian Brewery Holding) Limited (in liquidation) Cyprus US$1.00 Ordinary Voskane Pty Ltd Australia 1.00 Ordinary Windemere Securities Limited Turks and Caicos Islands USD1.00 Ordinary USD1.00 Preference Zythos Insurance Company Pte. Limited Singapore AUD1.00 Ordinary US$1.00 Ordinary (a) Indirect wholly owned subsidiaries continued (b) Subsidiaries where the effective interest is less than 100% Name of undertaking Country of incorporation Effective % interest Share class % of share class held by group companies ABI Bottling (Proprietary) Ltd South Africa 92 ZAR1.00 ordinary 100 Accra Brewery Limited1 Ghana 60 GHS1.00 Ordinary 96 Alliance Beverages (Pty) Ltd1 South Africa 62 ZAR Ordinary–No par value 100 Ambo International Holdings Ltd Mauritius 60 US$1.00 Ordinary 75 Ambo Mineral Water Share Company1 Ethiopia 40 ETB1,000.00 Ordinary 67 Appletiser Pure Fruit Juices (Pty) Limited South Africa 92 ZAR1.00 Ordinary 100 Appletiser South Africa (Pty) Limited South Africa 92 ZAR2.00 Ordinary 100 Aqua Service Mayotte SA1 Mayotte 50 €15.00 Ordinary 100 Azucarera del Norte S.A. de C.V. Honduras 99 HNL10.00 Ordinary 100 Bananeras Amelia S.A. de C.V. Honduras 99 HNL10.00 Ordinary 100 Bavaria S.A. Colombia 99 COP2.50 Ordinary 99 Beverage Management Solutions Limited Nigeria 50 NGN1.00 Ordinary 100 Brauhaase International Management GmbH1 Germany 50 €1,982,100.00 Ordinary 100 Browning Investments N.V. Curaçao 62 US$1.00 Ordinary 100 US$1.00 Preference shares 100 Canbrew B.V. Netherlands 71 €0.4537802 Ordinary 71 C.A.P.T.S. Beverages Share Company Ethiopia 60 ETB100.00 Ordinary 100 CAPTS Beverages Holdings1 Mauritius 60 US$1.00 Ordinary 75 Castle Brewing Namibia (Pty) Limited Namibia 92 NAD1.00 Ordinary 100 Cervecería del Valle S.A. Colombia 99 COP1,000.00 Ordinary 100 Cervejas de Moçambique SA1, 5 Moçambique 49 MZN2.00 Ordinary 80 Cervecería Hondureña S.A de C.V. Honduras 99 HNL100.00 Ordinary 99 187SABMiller plc Annual Report 2016 FINANCIALSTATEMENTS
  • 192.
    FINANCIAL STATEMENTS Related Undertakingscontinued Name of undertaking Country of incorporation Effective % interest Share class % of share class held by group companies Cervecería Nacional CN S.A.5 Ecuador 96 US$1.00 Ordinary 96 Cervecería Nacional S.A.5 Panama 97 Ordinary–No par value 98 Cervecería San Juan S.A.5 Peru 92 PEN1.00 Investment 67 PEN1.00 Ordinary 96 Cerveceria Union S.A. Colombia 98 COP0.57 Ordinary 99 Chantries Limited Kenya 80 KES10.00 Ordinary 100 Chibuku Products Limited1 Malawi 31 MWK1.00 Ordinary 50 Club Sporting Cristal S.A. Peru 94 PEN100.00 Ordinary 100 Coleus Packaging (Pty) Limited South Africa 55 ZAR0.001 Ordinary 60 Comco Societe Anonyme1 Comoros 42 KMF10,162.00 Ordinary 84 Comercializadora Cervecera S.A. de C.V. Honduras 99 HNL100.00 Ordinary 100 Compañía Cervecera de Canarias, S.A. Spain 51 €6.0101 Ordinary 71 Compañia Cerveceria S.A. de C.V. Honduras 99 HNL100.00 Ordinary 100 Compañia de Credito S.A. de C.V. Honduras 99 HNL100.00 Ordinary 100 Copperbelt Bottling Company Ltd Zambia 54 ZMK Ordinary 100 Crown Beverages Limited Kenya 80 KES100.00 Ordinary 100 Darbrew Limited1 Tanzania 21 TZS20.00 Ordinary 60 DINADEC S.A. Ecuador 99 US$1.00 Ordinary 100 Distribuidora Comercial S.A. Panama 97 US$20.00 Ordinary 99 Distribuidora Coronel Portillo S.A.C. Peru 99 PEN1.00 Ordinary 100 Dreher Sörgyárak Zrt. Hungary 99 HUF6,500.00 Ordinary 99 Dwarsloop Beer Wholesalers (Pty) Limited South Africa 92 ZAR1.00 Ordinary 100 Envases Industriales Hondurenos S.A. Honduras 99 HNL100.00 Ordinary 100 Export Compliance Services (Pty) Ltd South Africa 62 ZAR Ordinary 100 Heinrich’s Syndicate Limited Zambia 62 ZMK0.50 Ordinary 100 Impresora del Sur S.A. Colombia 99 COP1,000.00 Ordinary 100 Industria Grafica Latinoamerica S.A. Colombia 99 COP1,000.00 Ordinary 100 Inmobiliaria IDE S.A. Peru 94 PEN1.00 Common 100 PEN1.00 Investment 35 Intafact Beverages Limited1 Nigeria 38 NGN Ordinary 75 International Breweries PLC1, 5 Nigeria 36 NGN50.00 Ordinary 72 International Breweries (Agro-Allied) Limited1 Nigeria 36 NGN Ordinary–No par value 100 Inversiones Hondureñas S.A. de C.V. Honduras 99 HNL100.00 Ordinary 100 Inversiones Malteria Tropical S.A. Colombia 99 COP1,000.00 Ordinary 100 Inversiones Nixa S.A. Colombia 51 COP2.00 Ordinary 51 Kenbev Limited Kenya 80 KES100.00 Ordinary 100 KES100.00 Preference 100 Kgalagadi Breweries (Proprietary) Limited1, 2 Botswana 31 BWP1.00 B ordinary 100 Kibo Breweries Ltd1 Tanzania 36 TZS1.00 Ordinary 100 Lesotho Liquor Distributors (Proprietary) Ltd1 Lesotho 24 LSL1.00 Ordinary 100 Lesotho Traditional Beverages (Proprietary)Ltd Lesotho 62 LSL1.00 Ordinary 100 Liquid Packaging Limited1 Zambia 43 ZMK1.00 Ordinary 100 Logísitca Integral Hondureña, S. A. Honduras 99 HNL100.00 Ordinary 100 Maheu Number One Limited Zambia 62 ZMW0.001 Ordinary Malawi Breweries Limited Malawi 62 MWK2.00 Ordinary 100 Malawi Traditional Beverages Ltd Malawi 62 MWK2.00 Ordinary 100 Malteria Tropical S.A. Colombia 99 COP1,000.00 Ordinary 100 Maluti Mountain Brewery (Pty) Ltd1 Lesotho 24 LSL1.00 Ordinary 39 Mayco Societe Anonyme1 Mayotte 50 €0.16 Ordinary 100 Namanve Property Company Limited1 Uganda 39 UGX2,000.00 Ordinary 49 National Breweries plc1, 5 Zambia 43 ZMK0.01 Ordinary 70 Naviera Oriente S.A.C. Peru 94 PEN1.00 Ordinary 100 New Age Beverages (Pty) Limited South Africa 92 ZAR0.01 Ordinary 100 Nile Breweries Ltd Uganda 62 UGX10.00 Ordinary 99 Osiris Industries Limited Ghana 80 Ordinary–No par value 100 Other Beverage Interests (Proprietary) Limited South Africa 92 ZAR1.00 Ordinary 100 Overseas Breweries Limited Switzerland 62 CHF20.00 Ordinary 100 Pabod Breweries Limited1 Nigeria 41 NGN1.00 Ordinary 82 Plásticos Industriales Hondureños, S. A. de C. V. Honduras 99 HNL100.00 Ordinary 100 Racetrack Peru S.r.l. Peru 99 PEN1.00 Ordinary 100 Rainier Inc.1 Cayman Islands 62 US$1.00 Ordinary 100 Rombas Trans International Srl Romania 98 RON160.00 Ordinary 100 Rwenzori Bottling Company Uganda 80 UGX Ordinary 100 S.C. Andip Distribution S.R.L. Romania 99 RON10.00 Ordinary 100 S.C. Ursus Consulting S.R.L. Romania 99 RON10.00 Ordinary 100 SABMiller Africa B.V. Netherlands 62 €1.00 A ordinary 100 €1.00 D Preference 100 SABMiller Botswana B.V. Netherlands 62 €1.00 A ordinary 100 SABMiller Brands Korea Republic of Korea 75 KRW100,000.00 Ordinary 75 SABMiller India Limited India 99 INR10.00 Ordinary 99 SABMiller Investments II B.V. Netherlands 80 €1.00 Ordinary 80 SABMiller Investments Ltd Mauritius 80 US$1.00 Ordinary 80 SABMiller NAB Korea Republic of Korea 75 KRW100,000.00 Ordinary 100 SABMiller Nigeria Holdings B.V.1 Netherlands 50 €1.00 Ordinary 50 SABMiller Zimbabwe B.V. Netherlands 62 €1.00 Ordinary 100 San Ignacio S.A. Peru 99 PEN1.00 Ordinary 100 Siembra de Caña S.A. de C.V. Honduras 99 HNL50.00 Ordinary 100 Sociedad Portuaria Bavaria S.A. Colombia 99 COP1,000.00 Ordinary 100 Societa’ per Azioni Produzione Lavorazione Orzo–S.A.P.L.O Italy 90 €0.65 Ordinary 90 South African Barley Breeding Institute South Africa 92 Non profit company 100 Southern Sudan Beverages Ltd South Sudan 80 US$10.00 Ordinary 100 Strategic Alliance JV1 Mauritius 50 US$1.00 Ordinary 50 Swaziland Beverages Limited1 Swaziland 37 SZL1.00 Ordinary 60 Tanzania Breweries Limited1, 5 Tanzania 36 TZS100.00 Ordinary 57 Tanzania Distilleries Limited1 Tanzania 23 TZS20.00 Ordinary 65 The South African Breweries Centenary Company South Africa 92 Non profit company 100 The South African Breweries (Pty) Ltd South Africa 92 ZAR0.000001 Ordinary 92 The South African Breweries Barley Farm (Pty) Limited South Africa 92 ZAR1.00 Ordinary 100 The South African Breweries Hop Farms (Pty) Limited South Africa 92 ZAR2.00 Ordinary 100 (b) Subsidiaries where the effective interest is less than 100% continued 188 SABMiller plc Annual Report 2016
  • 193.
    Name of undertaking Countryof incorporation Effective % interest Share class % of share class held by group companies The South African Breweries Maltings (Pty) Limited South Africa 92 ZAR1.00 Ordinary 100 Thohoyandou Beer Distributors (Pty) Limited South Africa 54 ZAR1.00 Ordinary 59 Transportes 77 S.A. Peru 94 PEN1.00 Ordinary 100 Transportes TEV S.A. Colombia 99 COP500,000.00 Ordinary 100 Unión de Cervecerias Peruanas Backus y Johnston S.A.A.5 Peru 94 PEN10.00 A ordinary PEN10.00 B preference PEN1.00 Investment 99 13 89 Ursus Breweries S.A. Romania 99 RON5.90 Ordinary 99 Voltic (GH) Limited Ghana 80 Ordinary 100 Voltic International Inc. British Virgin Islands 80 US$1.00 Ordinary 100 Voltic Holdings B.V.1 Netherlands 50 US$1.00 Ordinary 100 Voltic Nigeria Ltd1 Nigeria 50 NGN1.00 Ordinary 100 V-Pet (GH) Limited1 ) Ghana 56 Ordinary 70 Westonaria Beer Distributors (Pty) Limited South Africa 41 ZAR1.00 Ordinary 45 Zambian Breweries plc5 Zambia 54 ZMK0.01 Ordinary 87 (c) Joint ventures Name Principal place of business address Effective % interest Share class % of share class held by group companies MillerCoors LLC4, 6 250 S Wacker Dr, Chicago, 58 US$0.001 A ordinary 50 IL 60606, USA US$0.001 B ordinary 100 (d) Associates Name Country of incorporation Effective % interest Share class % of share class held by group companies Ale Property B.V. Netherlands 25 €1.00 Ordinary 25 Algerienne de Bavaroise Spa6, 7 Algeria 40 DZD1,000.00 Ordinary 40 Anadolu Efes Biracılık ve Malt Sanayii A.5, 6 Turkey 24 TRL1.00 Common 24 Associated Fruit Processors (Pty) Limited South Africa 46 ZAR1.00 Ordinary 50 B.I.H. Brasseries Internationales Holding (Angola) Limited6 Gibraltar 27 €500.00 Class A Preference 100 €500.00 Ordinary 27 B.I.H. Brasseries Internationales Holding Limited6 Gibraltar 20 €1,000.00 Ordinary 20 €1,000.00 R Tracker 100 China Resources Snow Breweries Limited6 British Virgin Islands 49 US$1.00 Ordinary 49 Coca-Cola Canners of Southern Africa (Pty) Limited6 South Africa 29 ZAR1.00 Ordinary 32 Cooperatieve Inkoop Slijterij Ondernemingen U.A. Netherlands 45 €100.00 B ordinary 100 Delta Corporation Limited5, 8 Zimbabwe 25 US$0.01 Ordinary 40 Distell Group Limited5, 9 South Africa 25 ZAR0.01 Ordinary 27 Drankenorganisatie Nederland “D.O.N.” B.V. Netherlands 35 €45.378 Ordinary 35 Ensemble Vastgoed B.V. Netherlands 50 €1,000.00 Ordinary 50 Grolsch (UK) Limited United Kingdom 50 £1.00 Ordinary 51 Heisterkamp-Grolsch Real Estate B.V. Netherlands 50 €1.00 Ordinary 50 Heisterkamp-Grolsch Vastgoed B.V. Netherlands 50 €1.00 Participations A 100 Henk Smit Amsterdam B.V. Netherlands 35 €100.00 Ordinary 35 International Trade & Supply Limited6 British Virgin Islands 40 US$1.00 Ordinary 40 Marocaine d’Investissements et de Services SA5, 6, 10 Morocco 40 MAD100 Ordinary 100 Skikda Bottling Company S.A.R.L.6, 7 Algeria 40 DZD10,000.00 Ordinary 100 Société de Boissons de l’Ouest Algerien S.A.R.L.6, 7 Algeria 40 DZD1,000.00 Ordinary 100 Société Des Brasseries et Glacières Internationales S.A.6 France 20 €15.24 Ordinary 20 Société des Nouvelles Brasseries6, 7 Algeria 40 DZD1,000.00 Ordinary 100 Van Erp Dranken B.V. Netherlands 35 €1.00 Participations B 100 Výzkumný ústav Pivovarský a Slada ský, a.s. Czech Republic 22 CZK1,000.00 bearer 22 Notes 1 The operations continue to be consolidated due to the group’s ability to control the operations. 2 SABMiller Botswana BV holds a 40% interest in Kgalagadi Breweries (Pty) Ltd with the remaining 60% interest held by Sechaba Brewery Holdings Ltd. SABMiller Botswana’s shares entitle the holder to twice the voting rights of those shares held by Sechaba Brewery Holdings Ltd. SABMiller Africa BV’s 10.1% indirect interest is held via a 16.8% interest in Sechaba Brewery Holdings Ltd. 3 SABMiller Africa BV holds a 39% interest in Maluti with the remaining interest held by a government authority, the Lesotho National Development Corporation (51%), the Privatisation Unit (5.25%), and the Lesotho Unit Trust (4.75%). Maluti is treated as a subsidiary undertaking based on the group’s ability to control its operations through its board representation. The day to day business operations are managed in accordance with a management agreement with a group company. 4 SABMiller shares joint control of MillerCoors with Molson Coors Brewing Company under a shareholders’ agreement. Voting interests are shared equally between SABMiller and Molson Coors, and each of SABMiller and Molson Coors has equal board representation. Under the agreement SABMiller has a 58% economic interest in MillerCoors and Molson Coors has a 42% economic interest. 5 Listed in country of incorporation. 6 These entities report their financial results for each 12-month period ending 31 December. 7 Effective 18 March 2004, SABMiller acquired 25% of the Castel group’s holding in these entities. Together with its 20% interest in the Castel group’s Africa beverage interests, this gives SABMiller participation on a 40:60 basis with the Castel group. 8 Interests in this company are held by SABMiller Africa BV which is held 62% by SABMiller Holdings Ltd. 9 This entity reports its financial results for each 12-month period ending 30 June. 10 SABMiller acquired a 25% direct interest in this holding company on 18 March 2004 which has controlling interests in three breweries, a malting plant and a wet depot in Morocco. This 25% interest, together with its 20% interest in the Castel group’s African beverage interests, gives SABMiller an effective participation of 40% and the other 60% is held by the Castel group’s Africa beverage interests. (b) Subsidiaries where the effective interest is less than 100% continued 189SABMiller plc Annual Report 2016 FINANCIALSTATEMENTS
  • 194.
    FINANCIAL STATEMENTS Five-year financialreview for the years ended 31 March 2016 US$m 2015 US$m 2014 US$m 2013 US$m 2012 US$m Income statements Group NPR 24,149 26,288 26,719 26,932 24,949 Revenue 19,833 22,130 22,311 23,213 21,760 Operating profit 3,454 4,384 4,242 4,192 5,013 Net finance costs (506) (637) (645) (726) (562) Share of post-tax results of associates and joint ventures 1,126 1,083 1,226 1,213 1,152 Taxation (1,152) (1,273) (1,173) (1,192) (1,126) Non-controlling interests (223) (258) (269) (237) (256) Profit for the year attributable to owners of the parent 2,699 3,299 3,381 3,250 4,221 Adjusted earnings 3,604 3,835 3,865 3,772 3,400 Adjusted EBITDA 6,114 6,677 6,656 6,564 n/a Balance sheets Non-current assets 39,084 40,552 48,366 50,588 50,998 Current assets 4,505 4,359 5,385 5,683 4,851 Assets of disposal group classified as held for sale – – – 23 79 Total assets 43,589 44,911 53,751 56,294 55,928 Derivative financial instruments (239) (111) (115) (86) (109) Borrowings (11,740) (12,544) (17,047) (18,548) (19,226) Other liabilities and provisions (7,522) (7,901) (9,107) (10,199) (10,554) Liabilities of disposal group classified as held for sale – – – (1) (7) Total liabilities (19,501) (20,556) (26,269) (28,834) (29,896) Net assets 24,088 24,355 27,482 27,460 26,032 Total shareholders’ equity 22,892 23,172 26,319 26,372 25,073 Non-controlling interests in equity 1,196 1,183 1,163 1,088 959 Total equity 24,088 24,355 27,482 27,460 26,032 Cash flow statements Net cash generated from operations before working capital movements 5,055 5,680 5,677 5,758 4,979 Net working capital movements 61 132 93 (204) 258 Net cash generated from operations 5,116 5,812 5,770 5,554 5,237 Net interest paid (386) (651) (743) (770) (407) Tax paid (1,315) (1,439) (1,596) (683) (893) Net cash inflow from operating activities 3,415 3,722 3,431 4,101 3,937 Net capital expenditure and other investments (1,239) (1,503) (1,416) (1,440) (1,522) Net investments in subsidiaries, joint ventures and associates (496) 755 (338) (223) (11,095) Dividends received from joint ventures, associates and other investments 1,251 1,407 1,128 1,000 1,017 Net cash inflow before financing and dividends 2,931 4,381 2,805 3,438 (7,663) Net cash outflow from financing (435) (3,677) (1,195) (517) 8,819 Dividends paid to shareholders of the parent (1,860) (1,705) (1,640) (1,517) (1,324) Effect of exchange rates (115) (117) (61) (51) (39) Increase/(decrease) in cash and cash equivalents 521 (1,118) (91) 1,353 (207) Per share information (US cents per share) Basic earnings per share 167.8 205.7 211.8 204.3 266.6 Diluted earnings per share 166.0 203.5 209.1 202.0 263.8 Adjusted basic earnings per share 224.1 239.1 242.0 237.2 214.8 Total number of shares in issue (millions) 1,679.6 1,675.7 1,672.6 1,669.7 1,664.3 Other operating and financial statistics Return on equity (%)1 15.7 16.6 14.7 14.3 13.6 EBITA margin (as a percentage of group NPR) 24.1 24.2 24.2 23.7 n/a Adjusted EBITDA margin (as a percentage of relevant NPR) 31.5 31.7 31.4 30.0 n/a Net debt: adjusted EBITDA 1.6 1.6 2.1 2.4 n/a Interest cover (times) 13.8 10.7 10.3 8.9 n/a Free cash flow (US$m) 2,969 3,233 2,563 3,230 3,048 Gearing ratio (%) 40.0 43.0 52.0 56.8 68.4 Average monthly number of employees 70,089 68,808 69,947 70,486 71,144 1 This is calculated by expressing adjusted earnings as a percentage of total shareholders’ equity. 190 SABMiller plc Annual Report 2016
  • 195.
    2016 US$m 2015 US$m 2014 US$m 2013 US$m 2012 US$m Group NPR Segmental analysis LatinAmerica 5,211 5,768 5,745 5,802 5,315 Africa 6,781 7,462 7,421 7,765 7,834 Asia Pacific 3,650 3,867 3,944 4,005 2,600 Europe 3,832 4,398 4,574 4,300 4,235 North America 4,675 4,682 4,665 4,656 4,544 Retained operations 24,149 26,177 26,349 26,528 24,528 South Africa: Hotels and Gaming – 111 370 404 421 24,149 26,288 26,719 26,932 24,949 Operating profit (excluding share of associates and joint ventures) Segmental analysis Latin America 1,873 2,110 2,069 1,983 1,736 Africa 1,312 1,471 1,478 1,491 1,513 Asia Pacific 434 438 468 461 124 Europe 511 548 576 652 804 North America (9) 14 9 7 – Corporate (111) (122) (161) (202) (190) Operating profit – before exceptional items 4,010 4,459 4,439 4,392 3,987 Exceptional credit/(charge) Latin America – – 47 (63) (119) Africa (389) 45 (8) 57 121 Asia Pacific 29 (452) (103) (104) (70) Europe – – (11) (64) 1,135 North America – – – – – Corporate (196) (69) (122) (26) (41) Retained operations (556) (476) (197) (200) 1,026 South Africa: Hotels and Gaming – 401 – – – Operating profit – after exceptional items 3,454 4,384 4,242 4,192 5,013 EBITA Segmental analysis Latin America 1,959 2,224 2,192 2,112 1,865 Africa 1,708 1,907 1,954 1,957 1,911 Asia Pacific 753 768 845 854 321 Europe 636 700 703 784 836 North America 865 858 804 740 756 Corporate (111) (122) (161) (202) (190) Retained operations 5,810 6,335 6,337 6,245 5,499 South Africa: Hotels and Gaming – 32 123 134 135 5,810 6,367 6,460 6,379 5,634 191SABMiller plc Annual Report 2016 FINANCIALSTATEMENTS
  • 196.
    FINANCIAL STATEMENTS Definitions Financial definitions Adjustedearnings Adjusted earnings are calculated by adjusting headline earnings (as defined below) for the amortisation of intangible assets (excluding computer software), exceptional integration and restructuring costs, and other items which have been treated as exceptional but not included above or as headline earnings adjustments together with the group’s share of associates’ and joint ventures’ adjustments for similar items. The tax and non-controlling interests in respect of these items are also adjusted. Adjusted EBITDA This comprises operating profit before exceptional items, depreciation and amortisation, and includes the group’s share of MillerCoors’ operating profit on a similar basis. Adjusted net finance costs This comprises net finance costs excluding any exceptional finance charges or income. Adjusted profit before tax This comprises EBITA less adjusted net finance costs and less the group’s share of associates’ and joint ventures’ net finance costs on a similar basis. Constant currency Constant currency results have been determined by translating the local currency denominated results for the year ended 31 March at the exchange rates for the prior year. EBITA This comprises operating profit before exceptional items, and amortisation of intangible assets (excluding computer software) and includes the group’s share of associates’ and joint ventures’ operating profit on a similar basis. EBITA margin (%) This is calculated by expressing EBITA as a percentage of group net producer revenue. EBITDA This comprises EBITA (as defined above) plus depreciation and amortisation of computer software, including the group’s share of associates’ and joint ventures’ depreciation and amortisation of computer software. EBITDA margin (%) This is calculated by expressing EBITDA as a percentage of group net producer revenue. Effective tax rate (%) The effective tax rate is calculated by expressing tax before tax on exceptional items and on amortisation of intangible assets (excluding computer software), including the group’s share of associates’ and joint ventures’ tax on a similar basis, as a percentage of adjusted profit before tax. Free cash flow This comprises net cash generated from operating activities less cash paid for the purchase of property, plant and equipment, and intangible assets, net investments in existing associates and joint ventures (in both cases only where there is no change in the group’s effective ownership percentage) and dividends paid to non-controlling interests plus cash received from the sale of property, plant and equipment and intangible assets and dividends received. Group revenue This comprises revenue together with the group’s share of revenue from associates and joint ventures. Group net producer revenue (NPR) This comprises group revenue less excise duties and other similar taxes, together with the group’s share of excise duties and other similar taxes from associates and joint ventures. Headline earnings Headline earnings are calculated by adjusting profit for the year attributable to owners of the parent for items in accordance with the South African Circular 2/2015 entitled ‘Headline Earnings’. Such items include exceptional impairments of non-current assets and profits or losses on disposals of non-current assets and their related tax and non-controlling interests. This also includes the group’s share of associates’ and joint ventures’ adjustments on a similar basis. Interest cover This is the ratio of adjusted EBITDA to adjusted net finance costs. Net debt This comprises gross debt (including borrowings, financing derivative financial instruments, overdrafts and finance leases) net of cash and cash equivalents (excluding overdrafts). Organic information Organic results and volumes exclude the first 12 months’ results and volumes relating to acquisitions and the last 12 months’ results and volumes relating to disposals. Total Shareholder Return (TSR) TSR is the measure of the returns that a company has provided for its shareholders, reflecting share price movements and assuming reinvestment of dividends. Sales volumes In the determination and disclosure of sales volumes, the group aggregates 100% of the volumes of all consolidated subsidiaries and its equity accounted percentage of all associates’ and joint ventures’ volumes. Contract brewing volumes are excluded from volumes although revenue from contract brewing is included within group revenue. Volumes exclude intra-group sales volumes. This measure of volumes is used for lager volumes, soft drinks volumes, other alcoholic beverage volumes and beverage volumes and is used in the segmental analyses as it more closely aligns with the consolidated group net producer revenue and EBITA disclosures. KPI definitions – how we measure Total shareholder return (TSR) in excess of the median of peer group over five-year periods TSR performance is measured by taking the percentage growth in our TSR over the five-year period to the date aligned with the related measurement date of value share (2014: performance share) awards for the excom, and deducting the percentage growth in the TSR of the median of our peer group over the same period. Growth in adjusted earnings per share (EPS) Growth in adjusted EPS is measured by comparing the adjusted EPS for the year with that of the prior year. Adjusted EPS is measured using adjusted earnings divided by the basic number of shares in issue. Adjusted earnings are measured using the definition above. Growth in adjusted earnings per share (EPS) (constant currency) Growth in adjusted EPS compared with the prior year is measured on a constant currency basis (as defined above). Adjusted EPS is measured using adjusted earnings divided by the basic number of shares in issue. Adjusted earnings are measured using the definition above. Free cash flow Free cash flow is measured using the definition above. 192 SABMiller plc Annual Report 2016
  • 197.
    Proportion of ourtotal lager volume from markets in which we have no. 1 or no. 2 national market share positions Lager volumes generated in markets where we have a number one or number two national beer market share position divided by total lager volumes. Lager volumes are measured as defined on page 192. Proportion of group EBITA from developing economies EBITA generated in developing economies divided by group EBITA before corporate costs. EBITA is defined on page 192. Developing economies are as defined by the International Monetary Fund (IMF). Organic growth in total beverage volumes Organic growth in total beverage volumes is measured by comparing total beverage volumes in the year with those in the prior year excluding the effects of acquisitions and disposals (organic information is defined on page 192). Total beverage volumes are measured as defined on page 192. Group net producer revenue growth (organic, constant currency) Growth in group net producer revenue compared with the prior year is measured on a constant currency basis (as defined on page 192) and excluding the effects of acquisitions and disposals (organic information is defined on page 192). Group net producer revenue is defined on page 192. Net producer revenue growth in premium brands (constant currency) Growth in subsidiary net producer revenue from sales of premium brands compared with the prior year is measured on a constant currency basis (as defined on page 192). Premium brands are those in the premium segment as defined below. EBITA growth (organic, constant currency) EBITA growth compared with the prior year is measured on a constant currency basis (as defined on page 192) and excluding the effects of acquisitions and disposals (organic information is defined on page 192). EBITA is defined on page 192. EBITA margin progression (organic, constant currency) Progression in EBITA margin compared with the prior year is measured on a constant currency basis (as defined on page 192) and excluding the effects of acquisitions and disposals (organic information is defined on page 192). EBITA margin is defined on page 192. Hectolitres of water used at our breweries per hl of lager produced Water used at our breweries divided by the volume of lager produced. All consolidated subsidiaries are included on a 100% basis together with our equity accounted percentage share of the MillerCoors joint venture. Fossil fuel emissions from energy used at our breweries per hl of lager produced Fossil fuel emissions are measured by the total amount of carbon dioxide (CO2e) in kilograms released to the atmosphere by our brewery operations divided by the volume of lager produced. The total amount of CO2e is the sum of direct emissions produced by the combustion of fuel (e.g. coal, oil, gas) and indirect emissions from the use of electricity and steam. Emissions are calculated using the internationally recognised WRI/WBCSD Greenhouse Gas Protocol. All consolidated businesses are included on a 100% basis together with our equity accounted percentage share of the MillerCoors joint venture. Cumulative financial benefits from our cost and efficiency programme Cumulative annual cost savings as a result of the roll out of global business services organisation and the expansion of the scope of our supply chain activities. Non-financial definitions AB InBev Anheuser-Busch InBev SA/NV Altria Altria Group, Inc our largest shareholder. BevCo Ltd A holding company of the Santo Domingo Group, our second largest shareholder. Corporate Governance Code The UK Corporate Governance Code, as adopted by the Financial Reporting Council. Direct economic value generated Revenue plus interest and dividend receipts, royalty income, and proceeds of sales of assets (in accordance with guidance by the Global Reporting Initiative GRI EC1). Economy segment Taking the leading brand in the most popular pack type as the standard (=100), brands with a weighted average market price which fall below an index of 90 form the economy segment. Normally, all brands in this segment will be local brands. Global brands SABMiller’s global brands are Peroni Nastro Azzurro, Miller Genuine Draft, Miller Lite, Pilsner Urquell and Grolsch. Their volumes and NPR are measured on a subsidiary basis, excluding home markets. Like-for-like definition in China The like-for-like comparison in China is on a constant currency and underlying basis consistent with the prior year, excluding the reclassification undertaken by our associate, CR Snow. Mainstream segment Taking the leading brand in the most popular pack type as the standard (=100), the mainstream segment is formed of brands with a weighted average market price which fall into the 90-109 band. Mainstream brands tend to be local. PET PET is short for polyethylene terephthalate, a form of plastic which is used for bottling alcoholic and non-alcoholic drinks. PwC PricewaterhouseCoopers LLP, our external auditors. Premium segment Taking the leading brands in the most popular pack type as the standard (=100), brands with a weighted average market price which have an index of 110+ form the premium segment. The premium segment comprises local, regional and global brands. STRATE South Africa’s Central Securities Depository, which exists to allow share transactions in South Africa to be settled electronically. Underlying Where underlying is used in the description of business performance, this refers to performance on an organic, constant currency basis. Organic and constant currency are both defined on page 192. 193SABMiller plc Annual Report 2016 FINANCIALSTATEMENTS
  • 198.
    SHAREHOLDER INFORMATION Ordinary shareholdinganalyses Listed below are analyses of holdings extracted from the register of ordinary shareholders at the year end: Number of shareholders Percentage of share capital Portfolio size 1 – 1,000 50,552 0.68 1,001 – 10,000 6,127 1.05 10,001 – 100,000 1,662 3.94 100,001 – 1,000,000 750 14.18 1,000,001 and over 170 80.15 59,261 100.00 Category Banks 10 0.09 Individuals, nominees and trusts 57,063 5.51 Insurance companies 160 3.64 Investment companies 16 0.54 Medical aid schemes 37 0.14 Mutual funds 916 21.45 Other corporate entities 22 39.40 Pension funds 806 11.78 Other 231 17.45 59,261 100.00 Shareholders’ diary1 Financial reporting calendar and annual general meeting Trading update and annual general meeting July 2016 Announcement of interim results, for the half year to September November 2016 Preliminary announcement of annual results May 2017 Annual report published June 2017 Dividends Declared Paid Ordinary: Interim November December Final May August 1 Should the completion of the transaction with AB InBev not be completed prior to these dates. Unsolicited investment advice – warning to shareholders Many companies have become aware that their shareholders have received unsolicited phone calls or correspondence concerning investment matters. These are typically from overseas-based ‘brokers’ who target UK shareholders offering to sell them what often turn out to be worthless or high-risk shares in US or UK investments. They can be very persistent and extremely persuasive. It is not just the novice investor that can be duped in this way; many victims have been successfully investing for several years. Shareholders are advised to be very wary of any unsolicited advice, offers to buy shares at a discount, sell shares at a premium or requests to complete confidentiality agreements with the callers. It is unlikely that firms authorised by the Financial Conduct Authority (FCA) would approach shareholders in this manner, so it is advisable to seek out your own investment opportunities. If you receive any unsolicited investment advice: − make sure you get the correct name of the person and organisation. − check that they are properly authorised by the FCA before getting involved. You can check at http://www.fca.org.uk/firms/systems-reporting/register/search the FCA also maintains on its website a list of unauthorised overseas firms who are targeting, or have targeted, UK investors and any approach from such organisations should be reported to the FCA so that this list can be kept up to date and any other appropriate action can be considered. − report the matter to the FCA either by calling 0800 111 6768 or by completing an online form at: http://www.fca.org.uk/consumers/scams/investment-scams. If you deal with an unauthorised firm, you would not be eligible to receive payment under the Financial Services Compensation Scheme. − you can find guidance on being a “scamsmart investor” on the FCA website at http://scamsmart.fca.org.uk/ South African shareholders may report such approaches to the Financial Services Board (FSB) on: Toll free: 0800 110443 or 0800 202087 Email: info@fsb.co.za 194 SABMiller plc Annual Report 2016
  • 199.
    Administration SABMiller plc Incorporated inEngland and Wales (Registration No. 3528416) Group Company Secretary Stephen Shapiro Registered office SABMiller House Church Street West Woking Surrey, England GU21 6HS Telephone +44 1483 264000 Head office One Stanhope Gate London, England W1K 1AF Telephone +44 20 7659 0100 Internet address www.sabmiller.com Investor relations Telephone +44 20 7659 0100 Email: investor.relations@sabmiller.com Sustainable development Telephone +44 1483 264134 Email: sustainable.development@sabmiller.com Independent auditors PricewaterhouseCoopers LLP Chartered Accountants and Statutory Auditors 1 Embankment Place London, England WC2N 6RH Telephone +44 20 7583 5000 Registrar (United Kingdom) Equiniti Aspect House Spencer Road Lancing West Sussex BN99 6DA Telephone 0371 384 2395 Overseas telephone +44 121 415 7047 (outside UK) www.equiniti.com www.shareview.co.uk Registrar (South Africa) Computershare Investor Services (Proprietary) Limited 70 Marshall Street, Johannesburg PO Box 61051 Marshalltown 2107 South Africa Telephone +27 11 370 5000 United States ADR Depositary JP Morgan Depositary Bank 4 New York Plaza, floor 12 New York, NY 10004 Telephone +1 866 576 2377 Email: adr@jpmorgan.com 195SABMiller plc Annual Report 2016 SHAREHOLDERINFORMATION
  • 200.
    SHAREHOLDER INFORMATION Cautionary statement Thisdocument does not constitute an offer to sell or issue or the solicitation of an offer to buy or acquire ordinary shares in the capital of SABMiller plc (the “company”) or any other securities of the company or its subsidiaries or associates in any jurisdiction or an inducement to enter into investment activity. This document is intended to provide information to shareholders. It should not be relied upon by any other party or for any other purpose. This document includes ‘forward-looking statements’ with respect to certain of SABMiller plc’s plans, current goals and expectations relating to its future financial condition, performance and results. These statements contain the words “anticipate”, “believe”, “intend”, “estimate”, “expect” and words of similar meaning. All statements other than statements of historical facts included in this document, including, without limitation, those regarding the company’s financial position, business strategy, plans and objectives of management for future operations (including development plans and objectives relating to the company’s products and services) are forward-looking statements. Such forward-looking statements involve known and unknown risks, uncertainties and other important factors that could cause the actual results, performance or achievements of the company to be materially different from future results, performance or achievements expressed or implied by such forward-looking statements. Such forward-looking statements are based on numerous assumptions regarding the company’s present and future business strategies and the environment in which the company will operate in the future. These forward-looking statements speak only as at the date of this document. Factors which may cause differences between actual results and those expected or implied by the forward-looking statements include, but are not limited to: the outcome of the proposed transaction with Anheuser-Busch InBev SA/NV; material adverse changes in the economic and business conditions in the markets in which SABMiller operates; increased competition in the global brewing and beverages industry; changes in consumer preferences; changes to the regulatory environment; and fluctuations in foreign currency exchange rates and interest rates. The company expressly disclaims any obligation or undertaking to disseminate any updates or revisions to any forward-looking statements contained herein to reflect any change in the company’s expectations with regard thereto or any change in events, conditions or circumstances on which any such statement is based. The past business and financial performance of SABMiller plc is not to be relied on as an indication of its future performance. 196 SABMiller plc Annual Report 2016
  • 201.
    The paper usedin the report contains 75% recycled content, all of which is sourced from de-inked post-consumer waste. All of the pulp is bleached using an elemental chlorine free process (ECF). Printed in the UK by CPI Colour, a CarbonNeutral® company. Both manufacturing mill and the printer are registered to the Environmental Management System ISO14001 and are Forest Stewardship Council® (FSC® ) chain-of-custody certified. Designed and produced by
  • 202.
    Registered office SABMiller House ChurchStreet West Woking Surrey England GU21 6HS Telephone +44 1483 264000 www.sabmiller.com