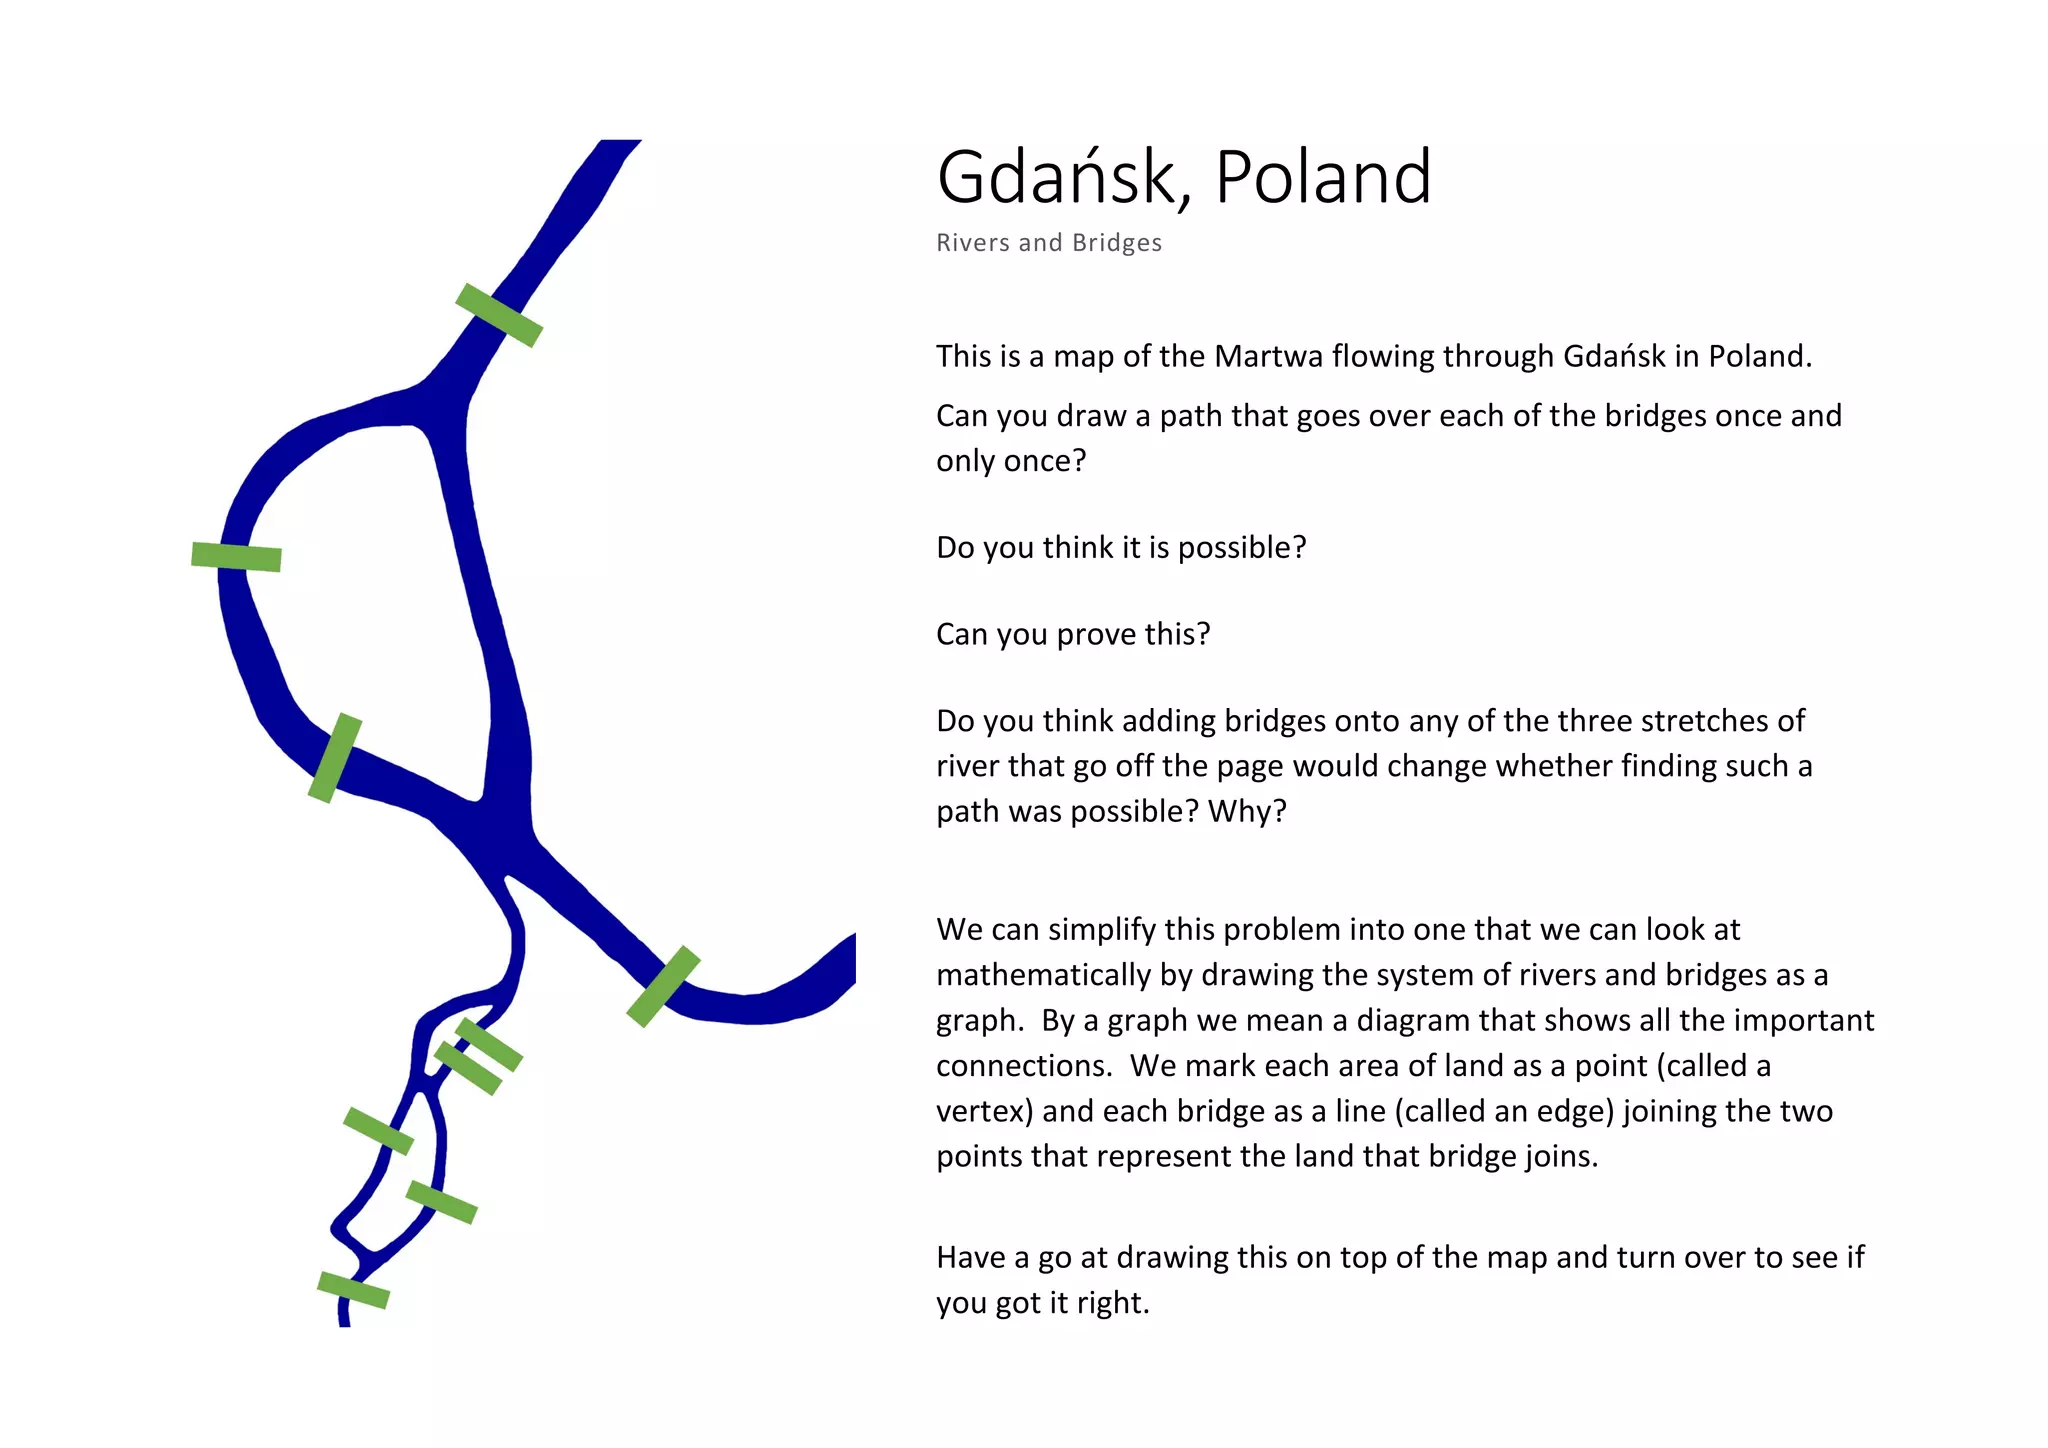
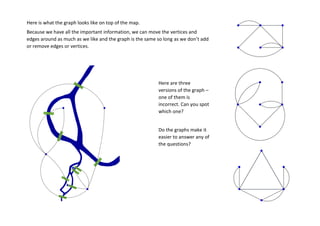
Gdańsk, Poland
Rivers and Bridges
This is a map of the Martwa flowing through Gdańsk in Poland.
Can you draw a path that goes over each of the bridges once and
only once?
Do you think it is possible?
Can you prove this?
Do you think adding bridges onto any of the three stretches of
river that go off the page would change whether finding such a
path was possible? Why?
We can simplify this problem into one that we can look at
mathematically by drawing the system of rivers and bridges as a
graph. By a graph we mean a diagram that shows all the important
connections. We mark each area of land as a point (called a
vertex) and each bridge as a line (called an edge) joining the two
points that represent the land that bridge joins.
Have a go at drawing this on top of the map and turn over to see if
you got it right.
Here is what the graph looks like on top of the map.
Because we have all the important information, we can move the vertices and
edges around as much as we like and the graph is the same so long as we don’t add
or remove edges or vertices.
Here are three
versions of the graph –
one of them is
incorrect. Can you spot
which one?
Do the graphs make it
easier to answer any of
the questions?

Rivers and Bridges - Gdansk

  • 1.
    Gdańsk, Poland Rivers andBridges This is a map of the Martwa flowing through Gdańsk in Poland. Can you draw a path that goes over each of the bridges once and only once? Do you think it is possible? Can you prove this? Do you think adding bridges onto any of the three stretches of river that go off the page would change whether finding such a path was possible? Why? We can simplify this problem into one that we can look at mathematically by drawing the system of rivers and bridges as a graph. By a graph we mean a diagram that shows all the important connections. We mark each area of land as a point (called a vertex) and each bridge as a line (called an edge) joining the two points that represent the land that bridge joins. Have a go at drawing this on top of the map and turn over to see if you got it right.
  • 2.
    Here is whatthe graph looks like on top of the map. Because we have all the important information, we can move the vertices and edges around as much as we like and the graph is the same so long as we don’t add or remove edges or vertices. Here are three versions of the graph – one of them is incorrect. Can you spot which one? Do the graphs make it easier to answer any of the questions?